0001163739
false
0001163739
2023-10-25
2023-10-25
iso4217:USD
xbrli:shares
iso4217:USD
xbrli:shares
UNITED
STATES
SECURITIES
AND EXCHANGE COMMISSION
Washington,
D.C. 20549
Form 8-K
CURRENT
REPORT
PURSUANT
TO SECTION 13 OR 15(d) OF THE
SECURITIES
EXCHANGE ACT OF 1934
Date of Report (Date of earliest event reported):
October 25, 2023
NABORS INDUSTRIES LTD.
(Exact name of registrant as specified in
its charter)
| Bermuda |
|
001-32657 |
|
98-0363970 |
| |
|
|
|
|
(State or Other Jurisdiction of
Incorporation or Organization) |
|
(Commission File Number) |
|
(I.R.S. Employer
Identification No.) |
Crown House
4 Par-la-Ville Road
Second Floor
Hamilton, HM08 Bermuda |
|
N/A |
| (Address of principal executive offices) |
|
(Zip Code) |
(441) 292-1510
(Registrant’s telephone number, including
area code)
N/A
(Former name or former address, if changed
since last report.)
Check the appropriate box below if the Form 8-K filing
is intended to simultaneously satisfy the filing obligation of the registrant under any of the following provisions:
| ¨ | Written
communications pursuant to Rule 425 under the Securities Act (17 CFR 230.425) |
| ¨ | Soliciting
material pursuant to Rule 14a-12 under the Exchange Act (17 CFR 240.14a-12) |
| ¨ | Pre-commencement
communications pursuant to Rule 14d-2(b) under the Exchange Act (17 CFR 240.14d-2(b)) |
| ¨ | Pre-commencement
communications pursuant to Rule 13e-4(c) under the Exchange Act (17 CFR 240.13e-4(c)) |
| Title of each class |
|
Trading Symbol(s) |
|
Name of exchange on which
registered |
| Common shares |
|
NBR |
|
NYSE |
Indicate by check mark whether the registrant is an emerging
growth company as defined in Rule 405 of the Securities Act of 1933 (§230.405 of this chapter) or Rule 12b-2 of
the Securities Exchange Act of 1934 (§240.12b-2 of this chapter).
Emerging growth
company ¨
If an emerging
growth company, indicate by check mark if the registrant has elected not to use the extended transition period for complying with
any new or revised financial accounting standards provided pursuant to Section 13(a) of the Exchange Act. ¨
Item 2.02 Results of Operations and Financial
Condition.
On October 25, 2023,
Nabors Industries Ltd. (“Nabors”) issued a press release announcing its results of operations for the three months ended September 30,
2023. A copy of that release is furnished herewith as Exhibit 99.1 and is incorporated herein by reference.
On October 26th, 2023,
Nabors will hold a conference call at 1:00 p.m. Central Time, regarding the Company’s financial results for the quarter ended
September 30, 2023. Information about the call—including dial-in information, recording and replay of the call, and supplemental
information—is available on the Investor Relations page of www.nabors.com.
The information in this Item
2.02, including Exhibits 99.1 and 99.2, shall not be deemed “filed” for purposes of Section 18 of the Securities Exchange
Act, of 1934 or otherwise subject to liabilities of that Section or Sections 11 and 12(a)(2) of the Securities Act of 1933.
Item 9.01 Financial Statements and Exhibits.
(d) Exhibits.
SIGNATURES
Pursuant to the requirements of the Securities
Exchange Act of 1934, the Registrant has duly caused this report to be signed on its behalf by the undersigned hereunto duly authorized.
| |
NABORS INDUSTRIES LTD. |
| |
|
| Date: October 25, 2023 |
By: |
/s/ Mark D. Andrews |
| |
|
Name: Mark D. Andrews |
| |
|
Title: Corporate Secretary |
Exhibit 99.1
 |
NEWS RELEASE |
Nabors Announces
Third Quarter 2023 Results
HAMILTON,
Bermuda, October 25, 2023 /PRNewswire/ - Nabors Industries Ltd. (“Nabors”
or the “Company”) (NYSE: NBR) today reported third quarter 2023 operating revenues of $734 million, compared to operating
revenues of $767 million in the second quarter. The net loss attributable to Nabors shareholders for the quarter was $49 million, compared
to net income of $5 million in the second quarter. This equates to a loss of $6.26 per diluted share, compared to a loss per diluted share
of $0.31 in the second quarter. The third quarter results included a charge, related to mark-to-market treatment of Nabors warrants, of
$8 million, or $0.86 per diluted share, compared to a gain of $18 million, or $1.95 per diluted share, in the second quarter. Third quarter
adjusted EBITDA was $210 million, compared to $235 million in the previous quarter.
Anthony G. Petrello, Nabors Chairman,
CEO and President, commented, “Drilling activity across our markets generally met our expectations. As we had anticipated in the
Lower 48, rig count decreased in the third quarter but it appears to have bottomed, while leading-edge pricing also seems to have stabilized.
The reduced drilling activity in the U.S. did impact our Nabors Drilling Solutions and Rig Technologies results somewhat more than we
expected. In line with our forecasts, international markets have continued to expand with higher pricing.
“During the quarter we experienced
challenges with our newbuild rigs and some of their critical components in Saudi Arabia, which resulted in deployment delays and significant
downtime. We are currently addressing the quality assurance issues on these assets delivered by our third-party supplier. We expect our
supplier’s performance to improve rapidly as its local manufacturing experience increases.
“On
the positive side, margins in our Lower 48 operation remained at higher levels than in any prior upcycle. During the third quarter we
saw the early signs of the expected market upturn. In preparation, we have 14 warm stacked rigs ready to return to work immediately at
minimum cost, as soon as drilling activity turns around.
“In
our International segment, multiple rigs commenced operations, contributing to an increase in sequential revenue. We are encouraged by
the prospects for a significant number of additional rigs in our international markets through 2024 and beyond.
“Broad
demand for our technology portfolio in Nabors Drilling Solutions drove meaningful increases in U.S. third-party and international revenue.
“In
Rig Technologies, our Energy Transition initiatives continued to gain momentum as we expanded our PowerTAP deployments, and our customers
increased their demand for our innovative solutions.”
Segment Results
The U.S.
Drilling segment reported $117.4 million in adjusted EBITDA for the third quarter of 2023. Nabors’ average Lower 48 rig count totaled
74. Daily adjusted gross margin in the Lower 48 market averaged $15,855.
|
NEWS RELEASE |
International
Drilling adjusted EBITDA totaled $96.2 million. Improved results across multiple markets were offset by start-up expenses in Saudi Arabia
and lower rig count in Colombia and Kuwait. International rig count averaged 77, in line with the previous quarter. Daily adjusted gross
margin for the third quarter averaged $15,778, down approximately 3% from the prior quarter.
Drilling
Solutions adjusted EBITDA declined sequentially by approximately $2.3 million, to $30.4 million. Growth of 8% in both U.S. third-party
revenue and international operations was more than offset by decreased Lower 48 activity on the reductions in Nabors rig count.
In Rig
Technologies, adjusted EBITDA totaled $7.2 million, compared to $6.4 million in the second quarter. Increases in aftermarket margins and
growth from the Energy Transition products accounted for the sequential improvement in adjusted EBITDA.
Adjusted Free Cash
Flow
Adjusted free cash flow was negative
$5 million in the third quarter. Capital expenditures totaled $157 million, which included $52 million for the newbuilds in Saudi Arabia.
This compares to $152 million in the second quarter, including $66 million supporting the newbuilds in Saudi Arabia.
At the end of the third quarter,
net debt was $2.1 billion.
William Restrepo, Nabors CFO,
stated, “The results delivered by our operating rigs were encouraging. Our rig count in the Lower 48 held up well in the third quarter
despite total market rig count landing a bit below expectations. In addition, our revenue per day and daily gross margin remained near
the record high levels set the prior quarter. We remain well positioned to take advantage of any recovery in U.S. drilling activity. Internationally
we continued to deploy rigs at attractive pricing, offsetting the contract expirations in Colombia and Kuwait. In the fourth quarter we
expect rig count increases in the U.S. as well as in international markets, as compared to the current levels. And we expect Nabors Drilling
Solutions to resume its growth trajectory.
“During the quarter, on
top of the $5 million EBITDA shortfall on our new builds in Saudi Arabia, we faced several unexpected items that negatively affected our
adjusted free cash flow. Most of these were one-offs or timing shifts across quarters. Capital expenditures were the largest of these
items as they exceeded our forecast by $33 million. This increase was driven by higher capital spending in Saudi Arabia and by the $9.5
million purchase of our operating base in Vaca Muerta, Argentina. We had been attempting without success to lock in this critical facility
over the last couple of years and had the opportunity to do so during the third quarter. We expect capital spending to fall materially
in the fourth quarter as these items should not repeat. In addition, our accounts receivable and other working capital items were approximately
$40 million higher than we had forecast at the end of last quarter. We expect this impact to reverse in the fourth quarter.
“Mainly as a result of higher
capital expenditures, an EBITDA shortfall in Saudi Arabia of $11 million in the second half, and lower NDS and Rig Technologies EBITDA
of about $13 million combined in the second half, our full year free cash flow is now expected to total $225 to $250 million, as compared
to our prior forecast at the end of the second quarter of $300 to $350 million. The impact from higher capital expenditures during the
second half, an increment of approximately $40 million, comes from the acceleration of deployments in Algeria, which will shift $20 million
in capital expenditures from early 2024 into the fourth quarter of 2023, from capital spending in Saudi Arabia which is expected to be
some $10 million higher than forecast earlier, and from the acquisition of the Vaca Muerta base, which was not part of our prior forecast.
|
NEWS RELEASE |
“We are now beginning the
forecasting process for 2024. Although we are not yet ready to discuss these projections, we do expect meaningful year over year increases
in both EBITDA and free cash flow.”
Outlook
Nabors
expects the following metrics for the fourth quarter 2023:
U.S.
Drilling
| o | Lower 48 average rig count of 72 - 74 rigs |
| o | Lower 48 adjusted gross margin per day of $15,000 - $15,200 |
| o | Alaska and Gulf of Mexico adjusted EBITDA up by $1.5 million |
International
| o | Rig count up by one to two rigs versus the third quarter average |
| o | Adjusted gross margin per day of approximately $16,200 - $16,300 |
Drilling
Solutions
| o | Adjusted EBITDA up by approximately 10% vs the third quarter |
Rig Technologies
| o | Adjusted EBITDA up by approximately 20% vs the third quarter |
Capital
Expenditures
| o | Capital expenditures of $95 million, with approximately $35 million for the newbuilds in Saudi Arabia |
Adjusted
Free Cash Flow
| o | Adjusted free cash flow for the fourth quarter of $165 to $190 million and for the full year 2023 of $225
to $250 million |
Mr. Petrello
concluded, “As we look to the fourth quarter, we expect improvements in our financial results, especially in free cash flow. With
the international expansion already in hand, and the indications we have seen for growth in the U.S., we are positioned for meaningful
improvement in 2024. The momentum we are now generating with our Energy Transition initiatives gives us additional confidence in this
positive outlook.”
|
NEWS RELEASE |
About Nabors Industries
Nabors Industries
(NYSE: NBR) is a leading provider of advanced technology for the energy industry. With presence in more than 20 countries, Nabors has
established a global network of people, technology and equipment to deploy solutions that deliver safe, efficient and responsible energy
production. By leveraging its core competencies, particularly in drilling, engineering, automation, data science and manufacturing, Nabors
aims to innovate the future of energy and enable the transition to a lower-carbon world. Learn more about Nabors and its energy technology
leadership: www.nabors.com.
Forward-looking Statements
The information included
in this press release includes forward-looking statements within the meaning of the Securities Act of 1933 and the Securities Exchange
Act of 1934. Such forward-looking statements are subject to a number of risks and uncertainties, as disclosed by Nabors from time to time
in its filings with the Securities and Exchange Commission. As a result of these factors, Nabors' actual results may differ materially
from those indicated or implied by such forward-looking statements. The forward-looking statements contained in this press release
reflect management's estimates and beliefs as of the date of this press release. Nabors does not undertake to update these forward-looking
statements.
Non-GAAP Disclaimer
This press release presents certain “non-GAAP” financial
measures. The components of these non-GAAP measures are computed by using amounts that are determined in accordance with accounting
principles generally accepted in the United States of America (“GAAP”). Adjusted operating income (loss) represents income
(loss) from continuing operations before income taxes, interest expense, investment income (loss), and other, net. Adjusted EBITDA is
computed similarly, but also excludes depreciation and amortization expenses. In addition, adjusted EBITDA and adjusted operating income
(loss) exclude certain cash expenses that the Company is obligated to make. Net debt is calculated as total debt minus the sum of cash,
cash equivalents and short-term investments.
Adjusted free cash flow represents net cash provided by operating activities
less cash used for capital expenditures, net of proceeds from sales of assets. Management believes that adjusted free cash flow is
an important liquidity measure for the company and that it is useful to investors and management as a measure of the company’s ability
to generate cash flow, after reinvesting in the company for future growth, that could be available for paying down debt or other financing
cash flows, such as dividends to shareholders. Management believes that this non-GAAP measure is useful information to investors
when comparing our cash flows with the cash flows of other companies.
|
NEWS RELEASE |
Each of these non-GAAP measures has limitations and therefore should
not be used in isolation or as a substitute for the amounts reported in accordance with GAAP. However, management evaluates the performance
of its operating segments and the consolidated Company based on several criteria, including Adjusted EBITDA, adjusted operating income
(loss), net debt, and adjusted free cash flow, because it believes that these financial measures accurately reflect the Company’s
ongoing profitability and performance. Securities analysts and investors also use these measures as some of the metrics on which
they analyze the Company’s performance. Other companies in this industry may compute these measures differently. Reconciliations
of consolidated adjusted EBITDA and adjusted operating income (loss) to income (loss) from continuing operations before income taxes,
net debt to total debt, and adjusted free cash flow to net cash provided by operations, which are their nearest comparable GAAP financial
measures, are included in the tables at the end of this press release. We do not provide a forward-looking reconciliation of our
outlook for Segment Adjusted EBITDA, Segment Gross Margin or Adjusted Free Cash Flow, as the amount and significance of items required
to develop meaningful comparable GAAP financial measures cannot be estimated at this time without unreasonable efforts. These special
items could be meaningful.
Investor Contacts: William C. Conroy, CFA,
Vice President of Corporate Development & Investor Relations, +1 281-775-2423 or via e-mail william.conroy@nabors.com,
or Kara Peak, Director of Corporate Development & Investor Relations, +1 281-775-4954 or via email kara.peak@nabors.com.
To request investor materials, contact Nabors' corporate headquarters in Hamilton, Bermuda at +441-292-1510 or via e-mail mark.andrews@nabors.com
NABORS
INDUSTRIES LTD. AND SUBSIDIARIES
CONDENSED
CONSOLIDATED STATEMENTS OF INCOME (LOSS)
(Unaudited)
| | |
| | |
| | |
| | |
| | |
| |
| | |
Three
Months Ended | | |
Nine
Months Ended | |
| | |
September
30, | | |
June
30, | | |
September
30, | |
| (In
thousands, except per share amounts) | |
2023 | | |
2022 | | |
2023 | | |
2023 | | |
2022 | |
| Revenues and other income: | |
| | | |
| | | |
| | | |
| | | |
| | |
| Operating revenues | |
$ | 733,974 | | |
$ | 694,136 | | |
$ | 767,067 | | |
$ | 2,280,180 | | |
$ | 1,893,618 | |
| Investment income
(loss) | |
| 10,169 | | |
| 4,813 | | |
| 11,743 | | |
| 31,778 | | |
| 5,798 | |
| Total revenues
and other income | |
| 744,143 | | |
| 698,949 | | |
| 778,810 | | |
| 2,311,958 | | |
| 1,899,416 | |
| | |
| | | |
| | | |
| | | |
| | | |
| | |
| Costs and other deductions: | |
| | | |
| | | |
| | | |
| | | |
| | |
| Direct costs | |
| 447,751 | | |
| 432,311 | | |
| 455,531 | | |
| 1,365,611 | | |
| 1,208,820 | |
| General and administrative expenses | |
| 62,182 | | |
| 57,594 | | |
| 63,232 | | |
| 187,144 | | |
| 169,400 | |
| Research and engineering | |
| 14,016 | | |
| 13,409 | | |
| 13,281 | | |
| 42,371 | | |
| 36,028 | |
| Depreciation and amortization | |
| 161,337 | | |
| 169,857 | | |
| 159,698 | | |
| 484,066 | | |
| 496,231 | |
| Interest expense | |
| 44,042 | | |
| 43,841 | | |
| 46,164 | | |
| 135,347 | | |
| 133,650 | |
| Other, net | |
| 35,546 | | |
| (25,954 | ) | |
| (1,775 | ) | |
| (8,604 | ) | |
| 68,975 | |
| Total costs
and other deductions | |
| 764,874 | | |
| 691,058 | | |
| 736,131 | | |
| 2,205,935 | | |
| 2,113,104 | |
| | |
| | | |
| | | |
| | | |
| | | |
| | |
| Income (loss) before income taxes | |
| (20,731 | ) | |
| 7,891 | | |
| 42,679 | | |
| 106,023 | | |
| (213,688 | ) |
| Income tax expense
(benefit) | |
| 10,513 | | |
| 12,352 | | |
| 26,448 | | |
| 59,976 | | |
| 35,376 | |
| | |
| | | |
| | | |
| | | |
| | | |
| | |
| Net income (loss) | |
| (31,244 | ) | |
| (4,461 | ) | |
| 16,231 | | |
| 46,047 | | |
| (249,064 | ) |
| Less: Net (income)
loss attributable to noncontrolling interest | |
| (17,672 | ) | |
| (9,322 | ) | |
| (11,620 | ) | |
| (41,128 | ) | |
| (32,132 | ) |
| Net income (loss) attributable to
Nabors | |
$ | (48,916 | ) | |
$ | (13,783 | ) | |
$ | 4,611 | | |
$ | 4,919 | | |
$ | (281,196 | ) |
| | |
| | | |
| | | |
| | | |
| | | |
| | |
| Earnings (losses) per share: | |
| | | |
| | | |
| | | |
| | | |
| | |
| Basic | |
$ | (6.26 | ) | |
$ | (1.80 | ) | |
$ | (0.31 | ) | |
$ | (2.79 | ) | |
$ | (32.72 | ) |
| Diluted | |
$ | (6.26 | ) | |
$ | (1.80 | ) | |
$ | (0.31 | ) | |
$ | (2.79 | ) | |
$ | (32.72 | ) |
| | |
| | | |
| | | |
| | | |
| | | |
| | |
| Weighted-average number of common shares outstanding: | |
| | | |
| | | |
| | | |
| | | |
| | |
| Basic | |
| 9,148 | | |
| 9,099 | | |
| 9,195 | | |
| 9,168 | | |
| 8,830 | |
| Diluted | |
| 9,148 | | |
| 9,099 | | |
| 9,195 | | |
| 9,168 | | |
| 8,830 | |
| | |
| | | |
| | | |
| | | |
| | | |
| | |
| Adjusted EBITDA | |
$ | 210,025 | | |
$ | 190,822 | | |
$ | 235,023 | | |
$ | 685,054 | | |
$ | 479,370 | |
| | |
| | | |
| | | |
| | | |
| | | |
| | |
| Adjusted operating income (loss) | |
$ | 48,688 | | |
$ | 20,965 | | |
$ | 75,325 | | |
$ | 200,988 | | |
$ | (16,861 | ) |
NABORS
INDUSTRIES LTD. AND SUBSIDIARIES
CONDENSED
CONSOLIDATED BALANCE SHEETS
(Unaudited)
| | |
| | |
| | |
| |
| | |
September
30, | | |
June
30, | | |
December
31, | |
| (In
thousands) | |
2023 | | |
2023 | | |
2022 | |
| ASSETS | |
| | | |
| | | |
| | |
| Current assets: | |
| | | |
| | | |
| | |
| Cash and short-term investments | |
$ | 406,643 | | |
$ | 429,059 | | |
$ | 452,315 | |
| Accounts receivable, net | |
| 324,970 | | |
| 297,388 | | |
| 327,397 | |
| Other current assets | |
| 228,941 | | |
| 251,687 | | |
| 220,911 | |
| Total current assets | |
| 960,554 | | |
| 978,134 | | |
| 1,000,623 | |
| Property, plant and equipment, net | |
| 2,945,964 | | |
| 2,963,898 | | |
| 3,026,100 | |
| Other long-term assets | |
| 820,332 | | |
| 521,235 | | |
| 703,131 | |
| Total
assets | |
$ | 4,726,850 | | |
$ | 4,463,267 | | |
$ | 4,729,854 | |
| | |
| | | |
| | | |
| | |
| LIABILITIES AND EQUITY | |
| | | |
| | | |
| | |
| Current liabilities: | |
| | | |
| | | |
| | |
| Trade accounts payable | |
$ | 287,228 | | |
$ | 301,751 | | |
$ | 314,041 | |
| Other current liabilities | |
| 241,475 | | |
| 242,514 | | |
| 282,349 | |
| Total current liabilities | |
| 528,703 | | |
| 544,265 | | |
| 596,390 | |
| Long-term debt | |
| 2,501,339 | | |
| 2,503,250 | | |
| 2,537,540 | |
| Other long-term liabilities | |
| 314,441 | | |
| 310,263 | | |
| 380,529 | |
| Total liabilities | |
| 3,344,483 | | |
| 3,357,778 | | |
| 3,514,459 | |
| | |
| | | |
| | | |
| | |
| Redeemable noncontrolling interest in subsidiary | |
| 834,195 | | |
| 513,817 | | |
| 678,604 | |
| | |
| | | |
| | | |
| | |
| Equity: | |
| | | |
| | | |
| | |
| Shareholders' equity | |
| 348,234 | | |
| 402,650 | | |
| 368,956 | |
| Noncontrolling interest | |
| 199,938 | | |
| 189,022 | | |
| 167,835 | |
| Total
equity | |
| 548,172 | | |
| 591,672 | | |
| 536,791 | |
| Total
liabilities and equity | |
$ | 4,726,850 | | |
$ | 4,463,267 | | |
$ | 4,729,854 | |
NABORS
INDUSTRIES LTD. AND SUBSIDIARIES
SEGMENT
REPORTING
(Unaudited)
The
following tables set forth certain information with respect to our reportable segments and rig activity:
| | |
Three Months Ended | | |
Nine Months Ended | |
| | |
September 30, | | |
June 30, | | |
September 30, | |
| (In thousands, except rig activity) | |
2023 | | |
2022 | | |
2023 | | |
2023 | | |
2022 | |
| Operating revenues: | |
| | | |
| | | |
| | | |
| | | |
| | |
| U.S. Drilling | |
$ | 276,385 | | |
$ | 297,178 | | |
$ | 314,830 | | |
$ | 941,867 | | |
$ | 767,769 | |
| International Drilling | |
| 344,780 | | |
| 306,355 | | |
| 337,650 | | |
| 1,002,478 | | |
| 881,705 | |
| Drilling Solutions | |
| 72,831 | | |
| 61,981 | | |
| 76,855 | | |
| 224,729 | | |
| 172,042 | |
| Rig Technologies (1) | |
| 61,437 | | |
| 50,496 | | |
| 63,565 | | |
| 183,481 | | |
| 132,326 | |
| Other reconciling items (2) | |
| (21,459 | ) | |
| (21,874 | ) | |
| (25,833 | ) | |
| (72,375 | ) | |
| (60,224 | ) |
| Total operating revenues | |
$ | 733,974 | | |
$ | 694,136 | | |
$ | 767,067 | | |
$ | 2,280,180 | | |
$ | 1,893,618 | |
| | |
| | | |
| | | |
| | | |
| | | |
| | |
| Adjusted EBITDA: (3) | |
| | | |
| | | |
| | | |
| | | |
| | |
| U.S. Drilling | |
$ | 117,357 | | |
$ | 114,486 | | |
$ | 141,446 | | |
$ | 415,292 | | |
$ | 276,122 | |
| International Drilling | |
| 96,175 | | |
| 85,922 | | |
| 98,331 | | |
| 283,114 | | |
| 239,616 | |
| Drilling Solutions | |
| 30,419 | | |
| 25,612 | | |
| 32,756 | | |
| 95,089 | | |
| 68,363 | |
| Rig Technologies (1) | |
| 7,221 | | |
| 4,818 | | |
| 6,408 | | |
| 18,583 | | |
| 7,138 | |
| Other reconciling items (4) | |
| (41,147 | ) | |
| (40,016 | ) | |
| (43,918 | ) | |
| (127,024 | ) | |
| (111,869 | ) |
| Total adjusted EBITDA | |
$ | 210,025 | | |
$ | 190,822 | | |
$ | 235,023 | | |
$ | 685,054 | | |
$ | 479,370 | |
| | |
| | | |
| | | |
| | | |
| | | |
| | |
| Adjusted operating income (loss): (5) | |
| | | |
| | | |
| | | |
| | | |
| | |
| U.S. Drilling | |
$ | 49,582 | | |
$ | 37,776 | | |
$ | 75,408 | | |
$ | 210,859 | | |
$ | 40,213 | |
| International Drilling | |
| 9,862 | | |
| (907 | ) | |
| 10,407 | | |
| 22,226 | | |
| (2,629 | ) |
| Drilling Solutions | |
| 25,341 | | |
| 20,099 | | |
| 28,351 | | |
| 80,830 | | |
| 53,068 | |
| Rig Technologies (1) | |
| 4,995 | | |
| 3,412 | | |
| 5,052 | | |
| 13,741 | | |
| 2,788 | |
| Other reconciling items (4) | |
| (41,092 | ) | |
| (39,415 | ) | |
| (43,893 | ) | |
| (126,668 | ) | |
| (110,301 | ) |
| Total adjusted operating income (loss) | |
$ | 48,688 | | |
$ | 20,965 | | |
$ | 75,325 | | |
$ | 200,988 | | |
$ | (16,861 | ) |
| | |
| | | |
| | | |
| | | |
| | | |
| | |
| Rig activity: | |
| | | |
| | | |
| | | |
| | | |
| | |
| Average Rigs Working: (7) | |
| | | |
| | | |
| | | |
| | | |
| | |
| Lower 48 | |
| 73.7 | | |
| 92.1 | | |
| 81.6 | | |
| 82.8 | | |
| 88.3 | |
| Other US | |
| 6.7 | | |
| 7.7 | | |
| 7.0 | | |
| 6.9 | | |
| 7.2 | |
| U.S. Drilling | |
| 80.4 | | |
| 99.8 | | |
| 88.6 | | |
| 89.7 | | |
| 95.5 | |
| International Drilling | |
| 77.2 | | |
| 74.6 | | |
| 77.1 | | |
| 76.9 | | |
| 73.6 | |
| Total average rigs working | |
| 157.6 | | |
| 174.4 | | |
| 165.7 | | |
| 166.6 | | |
| 169.1 | |
| | |
| | | |
| | | |
| | | |
| | | |
| | |
| Daily Rig Revenue: (6),(8) | |
| | | |
| | | |
| | | |
| | | |
| | |
| Lower 48 | |
$ | 35,697 | | |
$ | 29,190 | | |
$ | 36,751 | | |
$ | 36,324 | | |
$ | 26,050 | |
| Other US | |
| 56,163 | | |
| 70,661 | | |
| 65,860 | | |
| 64,312 | | |
| 70,953 | |
| U.S. Drilling (10) | |
| 37,397 | | |
| 32,380 | | |
| 39,049 | | |
| 38,474 | | |
| 29,449 | |
| International Drilling | |
| 48,528 | | |
| 44,658 | | |
| 48,106 | | |
| 47,728 | | |
| 43,859 | |
| | |
| | | |
| | | |
| | | |
| | | |
| | |
| Daily Adjusted Gross Margin: (6),(9) | |
| | | |
| | | |
| | | |
| | | |
| | |
| Lower 48 | |
$ | 15,855 | | |
$ | 11,165 | | |
$ | 16,890 | | |
$ | 16,505 | | |
$ | 9,225 | |
| Other US | |
| 27,631 | | |
| 38,034 | | |
| 35,932 | | |
| 33,618 | | |
| 37,215 | |
| U.S. Drilling (10) | |
| 16,833 | | |
| 13,232 | | |
| 18,394 | | |
| 17,820 | | |
| 11,371 | |
| International Drilling | |
| 15,778 | | |
| 14,589 | | |
| 16,276 | | |
| 15,762 | | |
| 14,033 | |
| (1) |
Includes our oilfield equipment
manufacturing activities. |
| |
|
| (2) |
Represents the elimination of inter-segment transactions
related to our Rig Technologies operating segment. |
| |
|
| (3) |
Adjusted EBITDA represents net income (loss) before
income tax expense (benefit), investment income (loss), interest expense, other, net and depreciation and amortization. Adjusted
EBITDA is a non-GAAP financial measure and should not be used in isolation or as a substitute for the amounts reported in accordance
with GAAP. In addition, adjusted EBITDA excludes certain cash expenses that the Company is obligated to make. However, management
evaluates the performance of its operating segments and the consolidated Company based on several criteria, including adjusted EBITDA
and adjusted operating income (loss), because it believes that these financial measures accurately reflect the Company’s ongoing
profitability and performance. Securities analysts and investors use this measure as one of the metrics on which they
analyze the Company’s performance. Other companies in this industry may compute these measures differently. A
reconciliation of this non-GAAP measure to net income (loss), which is the most closely comparable GAAP measure, is provided in the
table set forth immediately following the heading "Reconciliation of Non-GAAP Financial Measures to Net Income (Loss)". |
| |
|
| (4) |
Represents the elimination of inter-segment transactions
and unallocated corporate expenses. |
| |
|
| (5) |
Adjusted operating income (loss) represents net income
(loss) before income tax expense (benefit), investment income (loss), interest expense and other, net. Adjusted operating
income (loss) is a non-GAAP financial measure and should not be used in isolation or as a substitute for the amounts reported in
accordance with GAAP. In addition, adjusted operating income (loss) excludes certain cash expenses that the Company is obligated
to make. However, management evaluates the performance of its operating segments and the consolidated Company based on several criteria,
including adjusted EBITDA and adjusted operating income (loss), because it believes that these financial measures accurately reflect
the Company’s ongoing profitability and performance. Securities analysts and investors use this measure as one of
the metrics on which they analyze the Company’s performance. Other companies in this industry may compute these
measures differently. A reconciliation of this non-GAAP measure to net income (loss), which is the most closely comparable
GAAP measure, is provided in the table set forth immediately following the heading "Reconciliation of Non-GAAP Financial Measures
to Net Income (Loss)". |
| |
|
| (6) |
Rig revenue days represents the number of days the
Company's rigs are contracted and performing under a contract during the period. These would typically include days in
which operating, standby and move revenue is earned. |
| |
|
| (7) |
Average rigs working represents a measure of the average
number of rigs operating during a given period. For example, one rig operating 45 days during a quarter represents approximately
0.5 average rigs working for the quarter. On an annual period, one rig operating 182.5 days represents approximately 0.5
average rigs working for the year. Average rigs working can also be calculated as rig revenue days during the period divided
by the number of calendar days in the period. |
| |
|
| (8) |
Daily rig revenue represents operating revenue, divided
by the total number of revenue days during the quarter. |
| |
|
| (9) |
Daily adjusted gross margin represents operating revenue
less direct costs, divided by the total number of rig revenue days during the quarter. |
| |
|
| (10) |
The U.S. Drilling segment includes the Lower 48, Alaska,
and Gulf of Mexico operating areas. |
NABORS
INDUSTRIES LTD. AND SUBSIDIARIES
Reconciliation
of Earnings per Share
(Unaudited)
| | |
| | |
| | |
| | |
| | |
| |
| | |
Three
Months Ended | | |
Nine
Months Ended | |
| | |
September 30, | | |
June
30, | | |
September 30, | |
| (in
thousands, except per share amounts) | |
2023 | | |
2022 | | |
2023 | | |
2023 | | |
2022 | |
| BASIC EPS: | |
| | | |
| | | |
| | | |
| | | |
| | |
| Net income (loss) (numerator): | |
| | | |
| | | |
| | | |
| | | |
| | |
| Income (loss), net of
tax | |
$ | (31,244 | ) | |
$ | (4,461 | ) | |
$ | 16,231 | | |
$ | 46,047 | | |
$ | (249,064 | ) |
| Less: net (income) loss attributable
to noncontrolling interest | |
| (17,672 | ) | |
| (9,322 | ) | |
| (11,620 | ) | |
| (41,128 | ) | |
| (32,132 | ) |
| Less: deemed dividends to SPAC public
shareholders | |
| (823 | ) | |
| — | | |
| — | | |
| (8,180 | ) | |
| — | |
| Less: accrued
distribution on redeemable noncontrolling interest in subsidiary | |
| (7,517 | ) | |
| (2,601 | ) | |
| (7,436 | ) | |
| (22,307 | ) | |
| (7,720 | ) |
| Numerator for basic earnings per share: | |
| | | |
| | | |
| | | |
| | | |
| | |
| Adjusted income
(loss), net of tax - basic | |
$ | (57,256 | ) | |
$ | (16,384 | ) | |
$ | (2,825 | ) | |
$ | (25,568 | ) | |
$ | (288,916 | ) |
| | |
| | | |
| | | |
| | | |
| | | |
| | |
| Weighted-average number of shares outstanding - basic | |
| 9,148 | | |
| 9,099 | | |
| 9,195 | | |
| 9,168 | | |
| 8,830 | |
| Earnings (losses) per share: | |
| | | |
| | | |
| | | |
| | | |
| | |
| Total Basic | |
$ | (6.26 | ) | |
$ | (1.80 | ) | |
$ | (0.31 | ) | |
$ | (2.79 | ) | |
$ | (32.72 | ) |
| | |
| | | |
| | | |
| | | |
| | | |
| | |
| DILUTED EPS: | |
| | | |
| | | |
| | | |
| | | |
| | |
| Adjusted income (loss), net of tax
- diluted | |
$ | (57,256 | ) | |
$ | (16,384 | ) | |
$ | (2,825 | ) | |
$ | (25,568 | ) | |
$ | (288,916 | ) |
| | |
| | | |
| | | |
| | | |
| | | |
| | |
| Weighted-average number of shares outstanding - diluted | |
| 9,148 | | |
| 9,099 | | |
| 9,195 | | |
| 9,168 | | |
| 8,830 | |
| Earnings (losses) per share: | |
| | | |
| | | |
| | | |
| | | |
| | |
| Total Diluted | |
$ | (6.26 | ) | |
$ | (1.80 | ) | |
$ | (0.31 | ) | |
$ | (2.79 | ) | |
$ | (32.72 | ) |
NABORS
INDUSTRIES LTD. AND SUBSIDIARIES
NON-GAAP
FINANCIAL MEASURES
RECONCILIATION
OF ADJUSTED EBITDA BY SEGMENT TO ADJUSTED OPERATING INCOME (LOSS) BY SEGMENT
(Unaudited)
(In
thousands)
| | |
Three
Months Ended September 30, 2023 | |
| | |
U.S.
Drilling | | |
International
Drilling | | |
Drilling
Solutions | | |
Rig
Technologies | | |
Other
reconciling
items | | |
Total | |
| Adjusted operating income
(loss) | |
$ | 49,582 | | |
$ | 9,862 | | |
$ | 25,341 | | |
$ | 4,995 | | |
$ | (41,092 | ) | |
$ | 48,688 | |
| Depreciation
and amortization | |
| 67,775 | | |
| 86,313 | | |
| 5,078 | | |
| 2,226 | | |
| (55 | ) | |
| 161,337 | |
| Adjusted EBITDA | |
$ | 117,357 | | |
$ | 96,175 | | |
$ | 30,419 | | |
$ | 7,221 | | |
$ | (41,147 | ) | |
$ | 210,025 | |
| | |
Three
Months Ended September 30, 2022 | |
| | |
U.S.
Drilling | | |
International
Drilling | | |
Drilling
Solutions | | |
Rig
Technologies | | |
Other
reconciling
items | | |
Total | |
| Adjusted operating income
(loss) | |
$ | 37,776 | | |
$ | (907 | ) | |
$ | 20,099 | | |
$ | 3,412 | | |
$ | (39,415 | ) | |
$ | 20,965 | |
| Depreciation
and amortization | |
| 76,710 | | |
| 86,829 | | |
| 5,513 | | |
| 1,406 | | |
| (601 | ) | |
| 169,857 | |
| Adjusted EBITDA | |
$ | 114,486 | | |
$ | 85,922 | | |
$ | 25,612 | | |
$ | 4,818 | | |
$ | (40,016 | ) | |
$ | 190,822 | |
| | |
Three
Months Ended June 30, 2023 | |
| | |
U.S.
Drilling | | |
International
Drilling | | |
Drilling
Solutions | | |
Rig
Technologies | | |
Other
reconciling
items | | |
Total | |
| Adjusted operating income
(loss) | |
$ | 75,408 | | |
$ | 10,407 | | |
$ | 28,351 | | |
$ | 5,052 | | |
$ | (43,893 | ) | |
$ | 75,325 | |
| Depreciation
and amortization | |
| 66,038 | | |
| 87,924 | | |
| 4,405 | | |
| 1,356 | | |
| (25 | ) | |
| 159,698 | |
| Adjusted EBITDA | |
$ | 141,446 | | |
$ | 98,331 | | |
$ | 32,756 | | |
$ | 6,408 | | |
$ | (43,918 | ) | |
$ | 235,023 | |
| | |
Nine
Months Ended September 30, 2023 | |
| | |
U.S.
Drilling | | |
International
Drilling | | |
Drilling
Solutions | | |
Rig
Technologies | | |
Other
reconciling
items | | |
Total | |
| Adjusted operating income
(loss) | |
$ | 210,859 | | |
$ | 22,226 | | |
$ | 80,830 | | |
$ | 13,741 | | |
$ | (126,668 | ) | |
$ | 200,988 | |
| Depreciation
and amortization | |
| 204,433 | | |
| 260,888 | | |
| 14,259 | | |
| 4,842 | | |
| (356 | ) | |
| 484,066 | |
| Adjusted EBITDA | |
$ | 415,292 | | |
$ | 283,114 | | |
$ | 95,089 | | |
$ | 18,583 | | |
$ | (127,024 | ) | |
$ | 685,054 | |
| | |
Nine
Months Ended September 30, 2022 | |
| | |
U.S.
Drilling | | |
International
Drilling | | |
Drilling
Solutions | | |
Rig
Technologies | | |
Other
reconciling
items | | |
Total | |
| Adjusted operating income
(loss) | |
$ | 40,213 | | |
$ | (2,629 | ) | |
$ | 53,068 | | |
$ | 2,788 | | |
$ | (110,301 | ) | |
$ | (16,861 | ) |
| Depreciation
and amortization | |
| 235,909 | | |
| 242,245 | | |
| 15,295 | | |
| 4,350 | | |
| (1,568 | ) | |
| 496,231 | |
| Adjusted EBITDA | |
$ | 276,122 | | |
$ | 239,616 | | |
$ | 68,363 | | |
$ | 7,138 | | |
$ | (111,869 | ) | |
$ | 479,370 | |
NABORS
INDUSTRIES LTD. AND SUBSIDIARIES
NON-GAAP
FINANCIAL MEASURES
RECONCILIATION
OF ADJUSTED GROSS MARGIN BY SEGMENT TO ADJUSTED OPERATING INCOME (LOSS) BY SEGMENT
(Unaudited)
| | |
| | |
| | |
| | |
| | |
| |
| | |
Three
Months Ended | | |
Nine
Months Ended | |
| | |
September 30, | | |
June
30, | | |
September 30, | |
| (in
thousands) | |
2023 | | |
2022 | | |
2023 | | |
2023 | | |
2022 | |
| Lower 48 - U.S. Drilling | |
| | | |
| | | |
| | | |
| | | |
| | |
| Adjusted operating income (loss) | |
$ | 40,366 | | |
$ | 25,551 | | |
$ | 60,496 | | |
$ | 174,933 | | |
$ | 10,018 | |
| Plus: General and administrative costs | |
| 5,239 | | |
| 4,798 | | |
| 5,209 | | |
| 15,503 | | |
| 13,983 | |
| Plus: Research and engineering | |
| 1,389 | | |
| 1,652 | | |
| 1,189 | | |
| 4,098 | | |
| 4,902 | |
| GAAP Gross Margin | |
| 46,994 | | |
| 32,001 | | |
| 66,894 | | |
| 194,534 | | |
| 28,903 | |
| Plus: Depreciation and amortization | |
| 60,447 | | |
| 62,583 | | |
| 58,533 | | |
| 178,487 | | |
| 194,139 | |
| Adjusted gross margin | |
$ | 107,441 | | |
$ | 94,584 | | |
$ | 125,427 | | |
$ | 373,021 | | |
$ | 223,042 | |
| | |
| | | |
| | | |
| | | |
| | | |
| | |
| Other - U.S. Drilling | |
| | | |
| | | |
| | | |
| | | |
| | |
| Adjusted operating income (loss) | |
$ | 9,216 | | |
$ | 12,225 | | |
$ | 14,912 | | |
$ | 35,926 | | |
$ | 30,195 | |
| Plus: General and administrative costs | |
| 331 | | |
| 343 | | |
| 323 | | |
| 999 | | |
| 1,034 | |
| Plus: Research and engineering | |
| 90 | | |
| 157 | | |
| 132 | | |
| 349 | | |
| 428 | |
| GAAP Gross Margin | |
| 9,637 | | |
| 12,725 | | |
| 15,367 | | |
| 37,274 | | |
| 31,657 | |
| Plus: Depreciation and amortization | |
| 7,329 | | |
| 14,127 | | |
| 7,504 | | |
| 25,945 | | |
| 41,770 | |
| Adjusted gross margin | |
$ | 16,966 | | |
$ | 26,852 | | |
$ | 22,871 | | |
$ | 63,219 | | |
$ | 73,427 | |
| | |
| | | |
| | | |
| | | |
| | | |
| | |
| U.S. Drilling | |
| | | |
| | | |
| | | |
| | | |
| | |
| Adjusted operating income (loss) | |
$ | 49,582 | | |
$ | 37,776 | | |
$ | 75,408 | | |
$ | 210,859 | | |
$ | 40,213 | |
| Plus: General and administrative costs | |
| 5,570 | | |
| 5,141 | | |
| 5,532 | | |
| 16,502 | | |
| 15,017 | |
| Plus: Research and engineering | |
| 1,479 | | |
| 1,809 | | |
| 1,321 | | |
| 4,447 | | |
| 5,330 | |
| GAAP Gross Margin | |
| 56,631 | | |
| 44,726 | | |
| 82,261 | | |
| 231,808 | | |
| 60,560 | |
| Plus: Depreciation and amortization | |
| 67,776 | | |
| 76,710 | | |
| 66,037 | | |
| 204,432 | | |
| 235,909 | |
| Adjusted gross margin | |
$ | 124,407 | | |
$ | 121,436 | | |
$ | 148,298 | | |
$ | 436,240 | | |
$ | 296,469 | |
| | |
| | | |
| | | |
| | | |
| | | |
| | |
| International Drilling | |
| | | |
| | | |
| | | |
| | | |
| | |
| Adjusted operating income (loss) | |
$ | 9,862 | | |
$ | (907 | ) | |
$ | 10,407 | | |
$ | 22,226 | | |
$ | (2,629 | ) |
| Plus: General and administrative costs | |
| 14,300 | | |
| 12,599 | | |
| 14,089 | | |
| 42,725 | | |
| 38,137 | |
| Plus: Research and engineering | |
| 1,622 | | |
| 1,558 | | |
| 1,821 | | |
| 5,229 | | |
| 4,360 | |
| GAAP Gross Margin | |
| 25,784 | | |
| 13,250 | | |
| 26,317 | | |
| 70,180 | | |
| 39,868 | |
| Plus: Depreciation and amortization | |
| 86,313 | | |
| 86,830 | | |
| 87,924 | | |
| 260,887 | | |
| 242,247 | |
| Adjusted gross margin | |
$ | 112,097 | | |
$ | 100,080 | | |
$ | 114,241 | | |
$ | 331,067 | | |
$ | 282,115 | |
Adjusted gross
margin by segment represents adjusted operating income (loss) plus general and administrative costs, research and engineering costs and
depreciation and amortization.
NABORS
INDUSTRIES LTD. AND SUBSIDIARIES
RECONCILIATION
OF NON-GAAP FINANCIAL MEASURES TO NET INCOME (LOSS)
(Unaudited)
| | |
| | |
| | |
| | |
| | |
| |
| | |
Three
Months Ended | | |
Nine
Months Ended | |
| | |
September
30, | | |
June
30, | | |
September
30, | |
| (In
thousands) | |
2023 | | |
2022 | | |
2023 | | |
2023 | | |
2022 | |
| Net income (loss) | |
| (31,244 | ) | |
| (4,461 | ) | |
| 16,231 | | |
| 46,047 | | |
| (249,064 | ) |
| Income
tax expense (benefit) | |
| 10,513 | | |
| 12,352 | | |
| 26,448 | | |
| 59,976 | | |
| 35,376 | |
| Income (loss) from continuing operations
before income taxes | |
| (20,731 | ) | |
| 7,891 | | |
| 42,679 | | |
| 106,023 | | |
| (213,688 | ) |
| Investment (income)
loss | |
| (10,169 | ) | |
| (4,813 | ) | |
| (11,743 | ) | |
| (31,778 | ) | |
| (5,798 | ) |
| Interest expense | |
| 44,042 | | |
| 43,841 | | |
| 46,164 | | |
| 135,347 | | |
| 133,650 | |
| Other,
net | |
| 35,546 | | |
| (25,954 | ) | |
| (1,775 | ) | |
| (8,604 | ) | |
| 68,975 | |
| Adjusted operating
income (loss) (1) | |
| 48,688 | | |
| 20,965 | | |
| 75,325 | | |
| 200,988 | | |
| (16,861 | ) |
| Depreciation
and amortization | |
| 161,337 | | |
| 169,857 | | |
| 159,698 | | |
| 484,066 | | |
| 496,231 | |
| Adjusted EBITDA
(2) | |
$ | 210,025 | | |
$ | 190,822 | | |
$ | 235,023 | | |
$ | 685,054 | | |
$ | 479,370 | |
| (1) Adjusted operating income (loss) represents net income (loss) before
income tax expense (benefit), investment income (loss), interest expense, and other, net. Adjusted operating income (loss) is a non-GAAP
financial measure and should not be used in isolation or as a substitute for the amounts reported in accordance with GAAP. In addition,
adjusted operating income (loss) excludes certain cash expenses that the Company is obligated to make. However, management evaluates
the performance of its operating segments and the consolidated Company based on several criteria, including adjusted EBITDA and adjusted
operating income (loss), because it believes that these financial measures accurately reflect the Company’s ongoing profitability
and performance. Securities analysts and investors use this measure as one of the metrics on which they analyze the Company’s
performance. Other companies in this industry may compute these measures differently. |
| |
| (2) Adjusted EBITDA represents net income (loss)
before income tax expense (benefit), investment income (loss), interest expense, other, net and depreciation and amortization. Adjusted
EBITDA is a non-GAAP financial measure and should not be used in isolation or as a substitute for the amounts reported in accordance
with GAAP. In addition, adjusted EBITDA excludes certain cash expenses that the Company is obligated to make. However, management
evaluates the performance of its operating segments and the consolidated Company based on several criteria, including adjusted EBITDA
and adjusted operating income (loss), because it believes that these financial measures accurately reflect the Company’s ongoing
profitability and performance. Securities analysts and investors use this measure as one of the metrics on which they
analyze the Company’s performance. Other companies in this industry may compute these measures differently. |
NABORS
INDUSTRIES LTD. AND SUBSIDIARIES
RECONCILIATION
OF NET DEBT TO TOTAL DEBT
(Unaudited)
| | |
| | |
| | |
| |
| | |
September
30, | | |
June
30, | | |
December
31, | |
| (In
thousands) | |
2023 | | |
2023 | | |
2022 | |
| Long-term debt | |
$ | 2,501,339 | | |
$ | 2,503,250 | | |
$ | 2,537,540 | |
| Less: Cash and short-term investments | |
| 406,643 | | |
| 429,059 | | |
| 452,315 | |
| Net
Debt | |
$ | 2,094,696 | | |
$ | 2,074,191 | | |
$ | 2,085,225 | |
NABORS
INDUSTRIES LTD. AND SUBSIDIARIES
RECONCILIATION
OF ADJUSTED FREE CASH FLOW TO
NET
CASH PROVIDED BY OPERATING ACTIVITIES
(Unaudited)
| | |
| | |
| | |
| |
| | |
Three
Months Ended | | |
Nine
Months Ended | |
| | |
September
30, | | |
June
30, | | |
September
30, | |
| (In
thousands) | |
2023 | | |
2023 | | |
2023 | |
| Net cash provided by
operating activities | |
$ | 133,425 | | |
$ | 168,466 | | |
$ | 455,941 | |
| Add: Capital expenditures, net of
proceeds from sales of assets | |
| (138,583 | ) | |
| (141,683 | ) | |
| (397,018 | ) |
| Adjusted
free cash flow | |
$ | (5,158 | ) | |
$ | 26,783 | | |
$ | 58,923 | |
Adjusted
free cash flow represents net cash provided by operating activities less cash used for capital expenditures, net of proceeds from sales
of assets. Management believes that adjusted free cash flow is an important liquidity measure for the company and that it
is useful to investors and management as a measure of the company’s ability to generate cash flow, after reinvesting in the company
for future growth, that could be available for paying down debt or other financing cash flows, such as dividends to shareholders. Adjusted
free cash flow does not represent the residual cash flow available for discretionary expenditures. Adjusted free cash flow
is a non-GAAP financial measure that should be considered in addition to, not as a substitute for or superior to, cash flow from operations
reported in accordance with GAAP.
Exhibit 99.2

| NABORS INDUSTRIES LTD. October 26, 2023
3Q 2023 Earnings
Presentation |
| N A B O R S . C O M
We often discuss expectations regarding our future markets, demand for our products and
services, and our performance in our annual, quarterly, and current reports, press releases, and
other written and oral statements. Such statements, including statements in this document that
relate to matters that are not historical facts, are “forward-looking statements” within the meaning
of the safe harbor provisions of Section 27A of the U.S. Securities Act of 1933 and Section 21E
of the U.S. Securities Exchange Act of 1934. These “forward-looking statements” are based on
our analysis of currently available competitive, financial and economic data and our operating
plans. They are inherently uncertain, and investors should recognize that events and actual
results could turn out to be significantly different from our expectations.
Factors to consider when evaluating these forward-looking statements include, but are not
limited to: • geopolitical events, pandemics (including COVID-19) and other macro-events and their
respective and collective impact on our operations as well as oil and gas markets and
prices; • fluctuations and volatility in worldwide prices of and demand for oil and natural gas; • fluctuations in levels of oil and natural gas exploration and development activities; • fluctuations in the demand for our services; • competitive and technological changes and other developments in the oil and gas and
oilfield services industries; • our ability to renew customer contracts in order to maintain competitiveness; • the existence of operating risks inherent in the oil and gas and oilfield services industries; • the possibility of the loss of one or a number of our large customers; • the impact of long-term indebtedness and other financial commitments on our financial
and operating flexibility; • our access to and the cost of capital, including the impact of a further downgrade in our
credit rating, covenant restrictions, availability under our revolving credit facility, and future
issuances of debt or equity securities and the global interest rate environment; • our dependence on our operating subsidiaries and investments to meet our
financial obligations;
2
Forward Looking Statements
• our ability to retain skilled employees; • our ability to complete, and realize the expected benefits of, strategic transactions; • changes in tax laws and the possibility of changes in other laws and regulation; • the possibility of changes to U.S. trade policies and regulations including the imposition
of trade embargoes or sanctions; and • global views on and the regulatory environment related to energy transition and our
ability to implement our energy transition initiatives; • the possibility of changes to U.S. trade policies and regulations including the imposition
of trade embargoes, sanctions or tariffs; and • general economic conditions, including the capital and credit markets.
Our businesses depend, to a large degree, on the level of spending by oil and gas companies for
exploration, development and production activities. Therefore, sustained lower oil or natural gas
prices that have a material impact on exploration, development or production activities could also
materially affect our financial position, results of operations and cash flows.
The above description of risks and uncertainties is by no means all-inclusive but is designed to
highlight what we believe are important factors to consider. For a discussion of these factors and
other risks and uncertainties, please refer to our filings with the Securities and Exchange
Commission ("SEC"), including those contained in our Annual Reports on Form 10-K and
Quarterly Reports on Form 10-Q, which are available at the SEC's website at www.sec.gov. We
undertake no obligation to publicly update or revise any forward-looking statement as a result of
new information, future events or otherwise, except as otherwise required by law.
Non-GAAP Financial Measures
This presentation refers to certain “non-GAAP” financial measures, such as adjusted EBITDA,
net debt, adjusted gross margin and adjusted free cash flow. The components of these non-GAAP measures are computed by using amounts that are determined in accordance with
accounting principles generally accepted in the United States of America (“GAAP”).
Reconciliations of non-GAAP measures to the most comparable GAAP measures are provided
in the Appendix at the end of this presentation. |
| N A B O R S . C O M 3
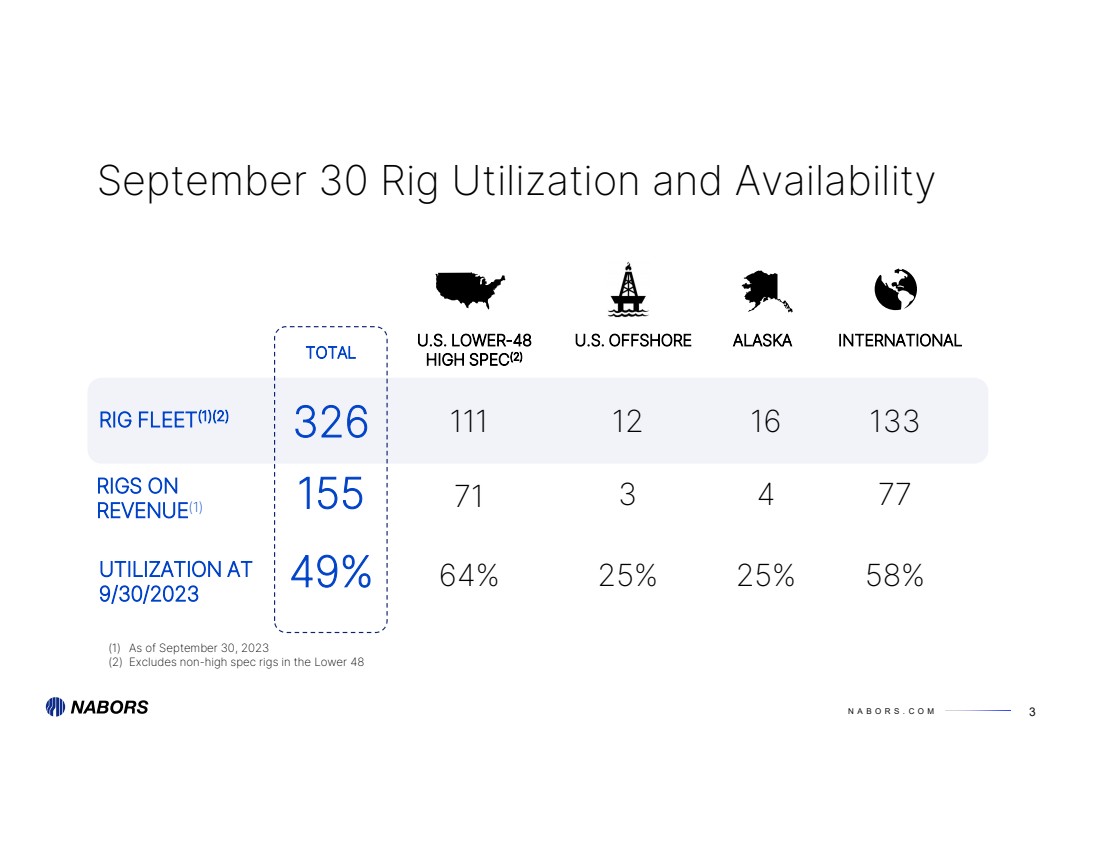
September 30 Rig Utilization and Availability
RIG FLEET(1)(2) 326
RIGS ON
REVENUE(1) 155
UTILIZATION AT
9/30/2023 49%
TOTAL U.S. OFFSHORE
12
3
25%
16
4
25%
ALASKA INTERNATIONAL
133
77
58%
111
71
64%
U.S. LOWER-48
HIGH SPEC(2)
(1) As of September 30, 2023
(2) Excludes non-high spec rigs in the Lower 48 |
| N A B O R S . C O M
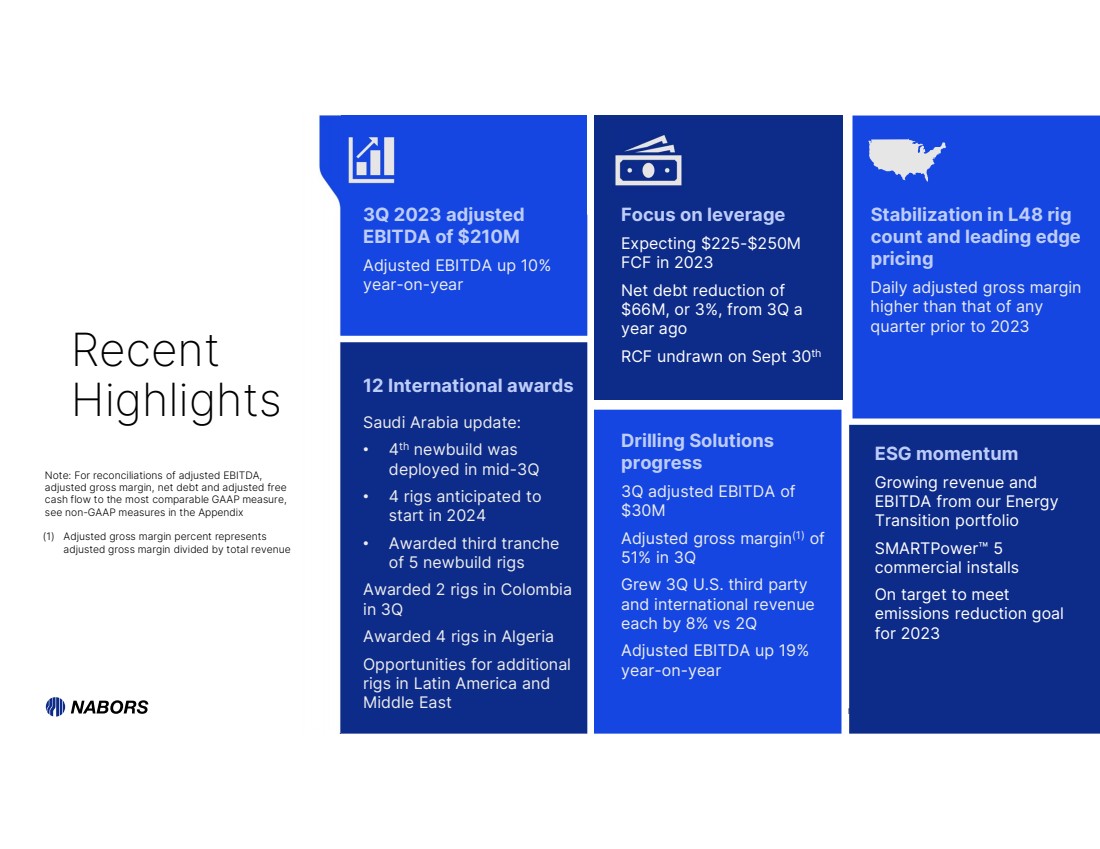
Focus on leverage
Expecting $225-$250M
FCF in 2023
Net debt reduction of
$66M, or 3%, from 3Q a
year ago
RCF undrawn on Sept 30th
3Q 2023 adjusted
EBITDA of $210M
Adjusted EBITDA up 10%
year-on-year
Drilling Solutions
progress
3Q adjusted EBITDA of
$30M
Adjusted gross margin(1) of
51% in 3Q
Grew 3Q U.S. third party
and international revenue
each by 8% vs 2Q
Adjusted EBITDA up 19%
year-on-year
12 International awards
Saudi Arabia update:
• 4th newbuild was
deployed in mid-3Q
• 4 rigs anticipated to
start in 2024
• Awarded third tranche
of 5 newbuild rigs
Awarded 2 rigs in Colombia
in 3Q
Awarded 4 rigs in Algeria
Opportunities for additional
rigs in Latin America and
Middle East
ESG momentum
Growing revenue and
EBITDA from our Energy
Transition portfolio
SMARTPower™ 5
commercial installs
On target to meet
emissions reduction goal
for 2023
Recent
Highlights
Note: For reconciliations of adjusted EBITDA,
adjusted gross margin, net debt and adjusted free
cash flow to the most comparable GAAP measure,
see non-GAAP measures in the Appendix
Stabilization in L48 rig
count and leading edge
pricing
Daily adjusted gross margin
higher than that of any
quarter prior to 2023
(1) Adjusted gross margin percent represents
adjusted gross margin divided by total revenue |

| N A B O R S . C O M
Performance
excellence in
the Lower-48
Expanding &
enhancing our
International
segment
Advancing
technology &
innovation with
demonstrated
results
Progress on our
commitment to
de-lever
Leading in
Sustainability
and the Energy
Transition
Five Keys to Excellence
1 2 3 4 5 |
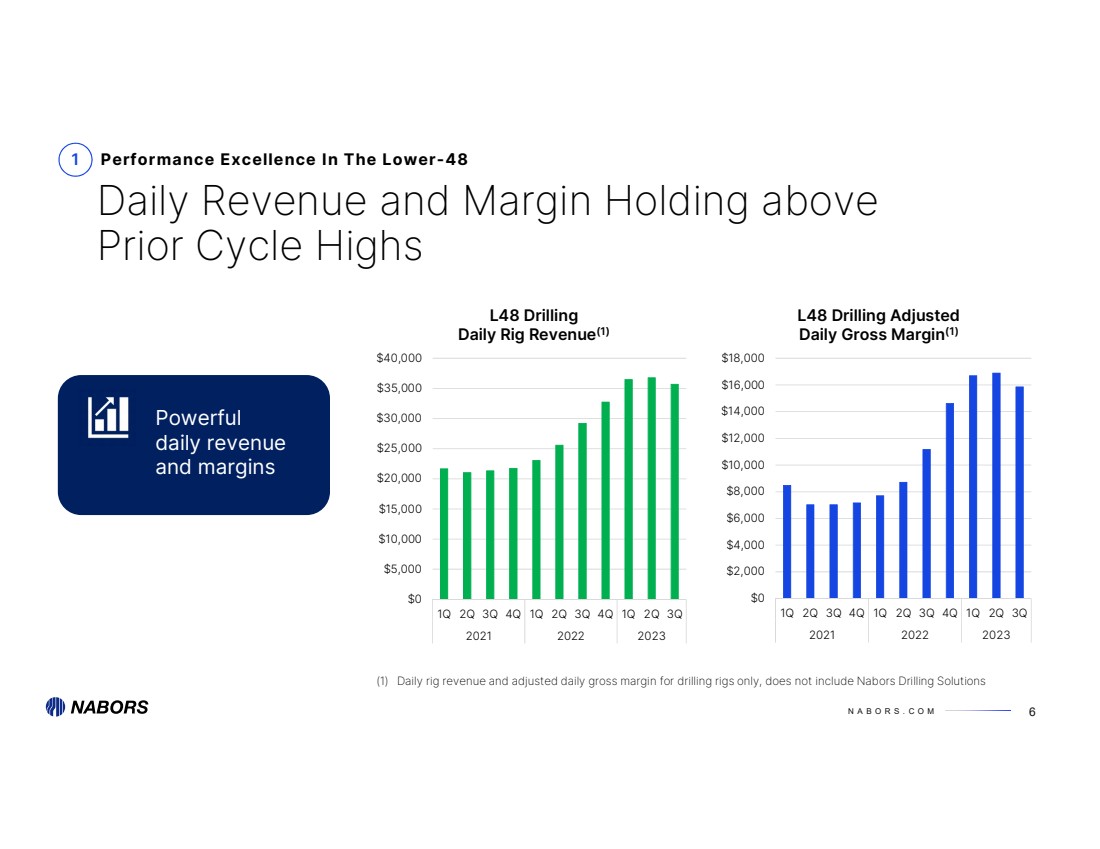
| N A B O R S . C O M $0
$2,000
$4,000
$6,000
$8,000
$10,000
$12,000
$14,000
$16,000
$18,000
1Q 2Q 3Q 4Q 1Q 2Q 3Q 4Q 1Q 2Q 3Q
2021 2022 2023
L48 Drilling Adjusted
Daily Gross Margin(1)
$0
$5,000
$10,000
$15,000
$20,000
$25,000
$30,000
$35,000
$40,000
1Q 2Q 3Q 4Q 1Q 2Q 3Q 4Q 1Q 2Q 3Q
2021 2022 2023
L48 Drilling
Daily Rig Revenue(1)
6
Powerful
daily revenue
and margins
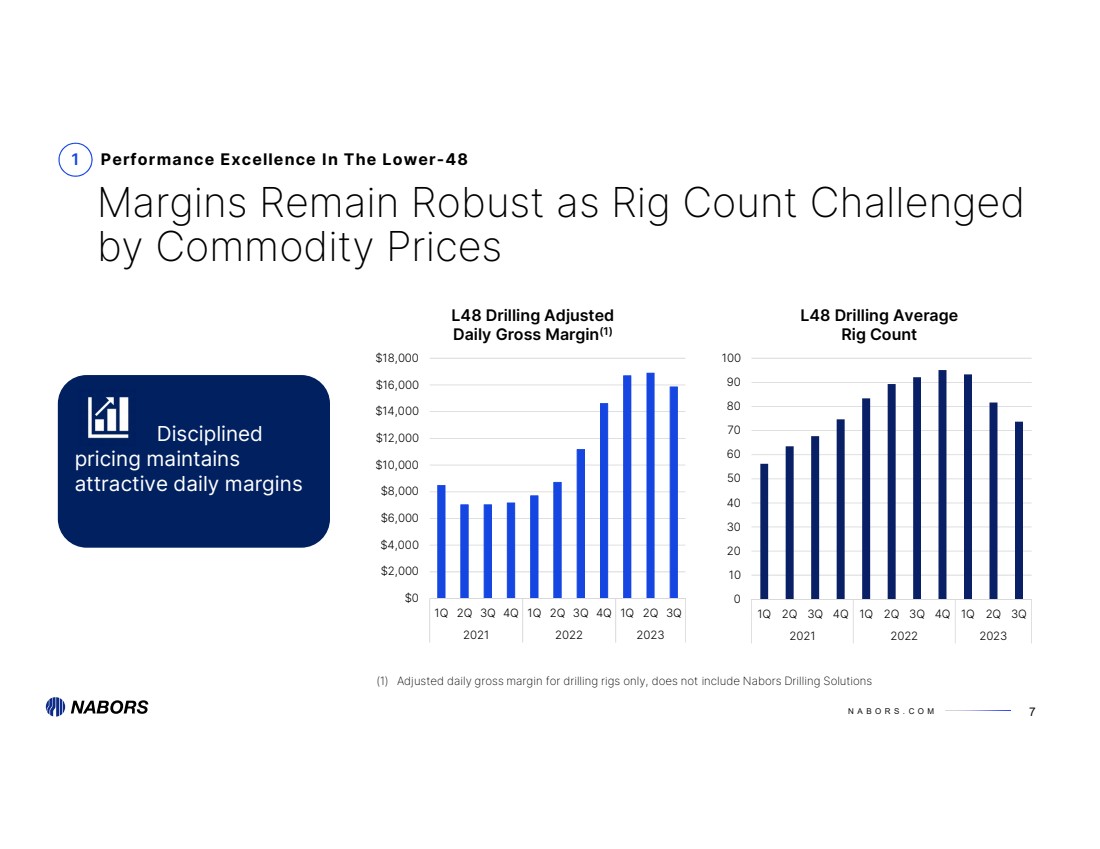
1 Performance Excellence In The Lower-48
Daily Revenue and Margin Holding above
Prior Cycle Highs
(1) Daily rig revenue and adjusted daily gross margin for drilling rigs only, does not include Nabors Drilling Solutions |
| N A B O R S . C O M $0
$2,000
$4,000
$6,000
$8,000
$10,000
$12,000
$14,000
$16,000
$18,000
1Q 2Q 3Q 4Q 1Q 2Q 3Q 4Q 1Q 2Q 3Q
2021 2022 2023
L48 Drilling Adjusted
Daily Gross Margin(1)
0
10
20
30
40
50
60
70
80
90
100
1Q 2Q 3Q 4Q 1Q 2Q 3Q 4Q 1Q 2Q 3Q
2021 2022 2023
L48 Drilling Average
Rig Count
7
Disciplined
pricing maintains
attractive daily margins
1 Performance Excellence In The Lower-48
Margins Remain Robust as Rig Count Challenged
by Commodity Prices
(1) Adjusted daily gross margin for drilling rigs only, does not include Nabors Drilling Solutions |

| N A B O R S . C O M
Performance
excellence in
the Lower-48
Expanding &
enhancing our
International
segment
Advancing
technology &
innovation with
demonstrated
results
Progress on our
commitment to
de-lever
Leading in
Sustainability
and the Energy
Transition
1 2 3 4 5
Five Keys to Excellence |
| N A B O R S . C O M $0
$2,000
$4,000
$6,000
$8,000
$10,000
$12,000
$14,000
$16,000
$18,000
1Q 2Q 3Q 4Q 1Q 2Q 3Q 4Q 1Q 2Q 3Q
2021 2022 2023
International Drilling
Adjusted Daily Gross Margin(1)
$0
$5,000
$10,000
$15,000
$20,000
$25,000
$30,000
$35,000
$40,000
$45,000
$50,000
1Q 2Q 3Q 4Q 1Q 2Q 3Q 4Q 1Q 2Q 3Q
2021 2022 2023
International Drilling
Daily Rig Revenue(1)
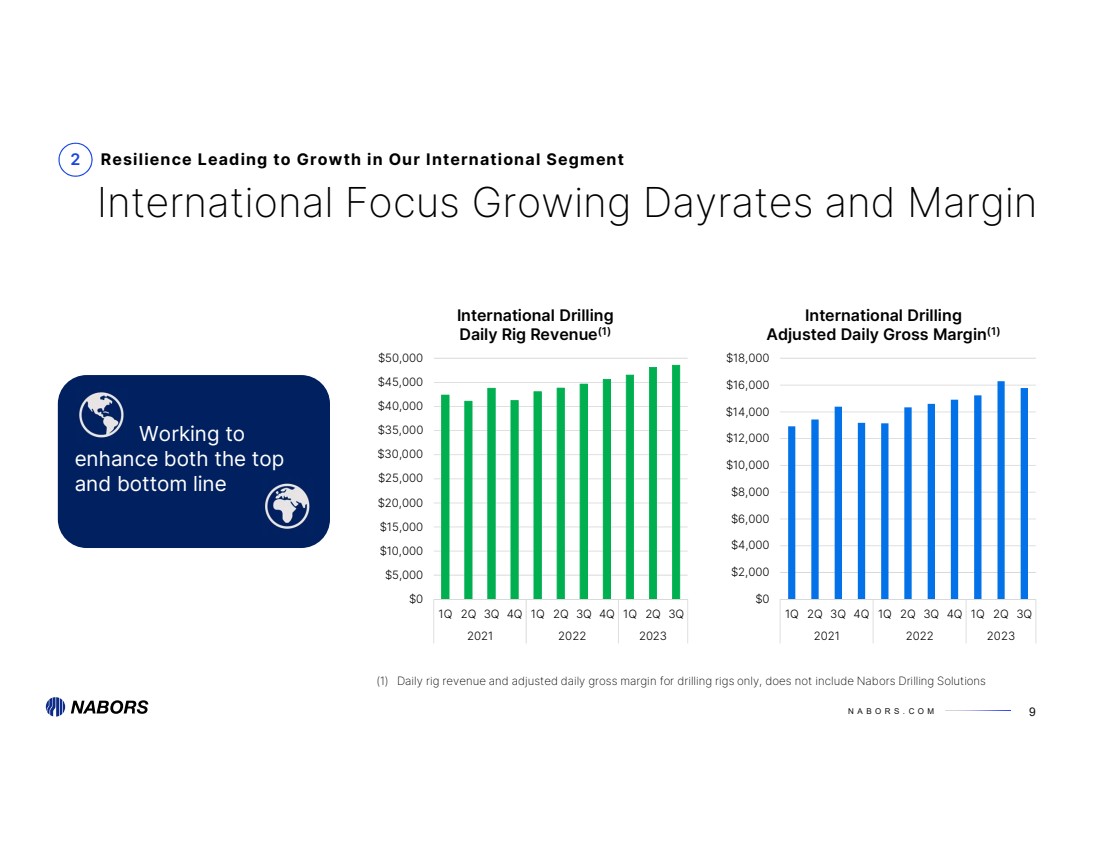
Working to
enhance both the top
and bottom line
9
International Focus Growing Dayrates and Margin
2 Resilience Leading to Growth in Our International Segment
(1) Daily rig revenue and adjusted daily gross margin for drilling rigs only, does not include Nabors Drilling Solutions |
| N A B O R S . C O M
50
55
60
65
70
75
80
1Q 2Q 3Q 4Q 1Q 2Q 3Q 4Q 1Q 2Q 3Q
2021 2022 2023
International Drilling
Average Rig Count
$0
$2,000
$4,000
$6,000
$8,000
$10,000
$12,000
$14,000
$16,000
$18,000
1Q 2Q 3Q 4Q 1Q 2Q 3Q 4Q 1Q 2Q 3Q
2021 2022 2023
International Drilling
Adjusted Daily Gross Margin(1)
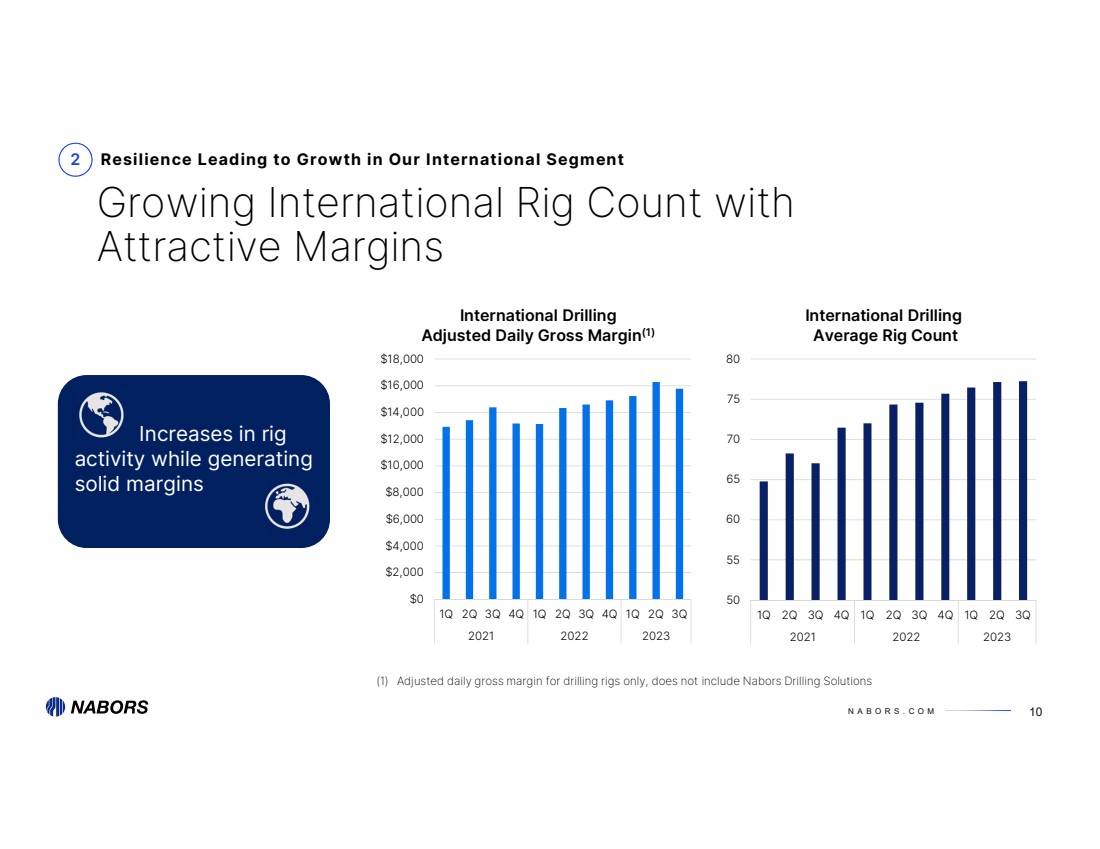
Increases in rig
activity while generating
solid margins
10
Growing International Rig Count with
Attractive Margins
2 Resilience Leading to Growth in Our International Segment
(1) Adjusted daily gross margin for drilling rigs only, does not include Nabors Drilling Solutions |
| N A B O R S . C O M 40
45
50
55
1Q 2Q 3Q 4Q 1QA 2QA 3QA 4QF 1Q 2Q 3Q 4Q
2022 A 2023 2024 F
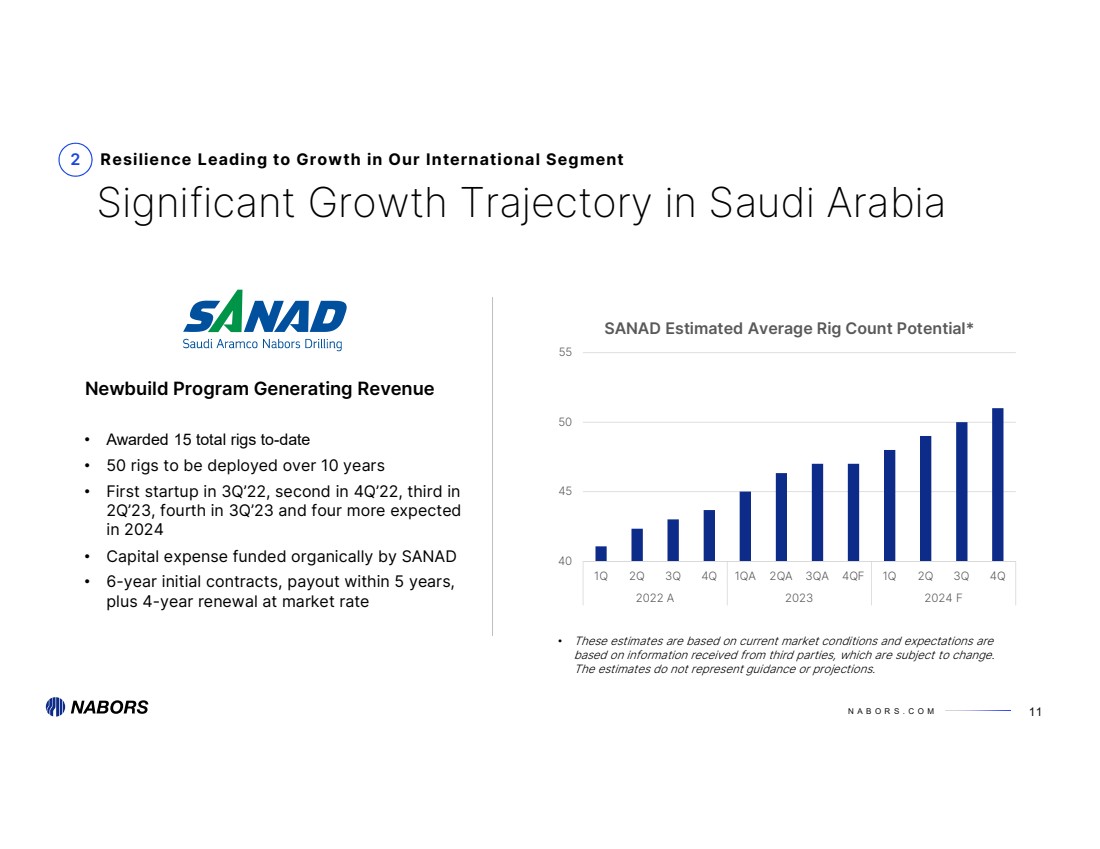
SANAD Estimated Average Rig Count Potential*
11
Significant Growth Trajectory in Saudi Arabia
Resilience Leading to Growth in Our International Segment
• Awarded 15 total rigs to-date
• 50 rigs to be deployed over 10 years
• First startup in 3Q’22, second in 4Q’22, third in
2Q’23, fourth in 3Q’23 and four more expected
in 2024
• Capital expense funded organically by SANAD
• 6-year initial contracts, payout within 5 years,
plus 4-year renewal at market rate
Newbuild Program Generating Revenue
• These estimates are based on current market conditions and expectations are
based on information received from third parties, which are subject to change.
The estimates do not represent guidance or projections.
2 |

| N A B O R S . C O M
Performance
excellence in
the Lower-48
Expanding &
enhancing our
International
segment
Advancing
technology &
innovation
with
demonstrated
results
Progress on our
commitment to
de-lever
Leading in
Sustainability
and the Energy
Transition
1 2 3 4 5
Five Keys to Excellence |
| N A B O R S . C O M 30%
35%
40%
45%
50%
55%
60%
65%
$-
$10
$20
$30
$40
$50
$60
$70
$80
$90
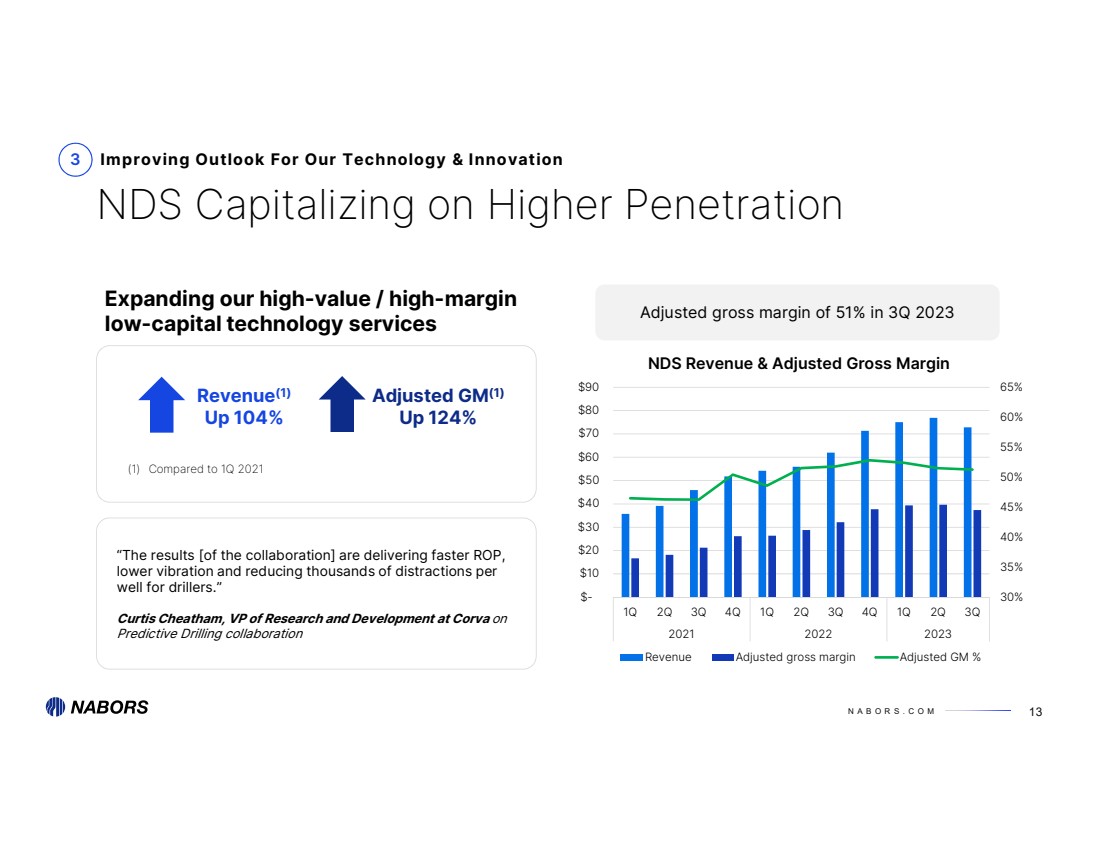
1Q 2Q 3Q 4Q 1Q 2Q 3Q 4Q 1Q 2Q 3Q
2021 2022 2023
NDS Revenue & Adjusted Gross Margin
Revenue Adjusted gross margin Adjusted GM %
13
NDS Capitalizing on Higher Penetration
Improving Outlook For Our Technology & Innovation
Revenue(1)
Up 104%
Adjusted GM(1)
Up 124%
Expanding our high-value / high-margin
low-capital technology services
3
Adjusted gross margin of 51% in 3Q 2023
(1) Compared to 1Q 2021
“The results [of the collaboration] are delivering faster ROP,
lower vibration and reducing thousands of distractions per
well for drillers.”
Curtis Cheatham, VP of Research and Development at Corva on
Predictive Drilling collaboration |
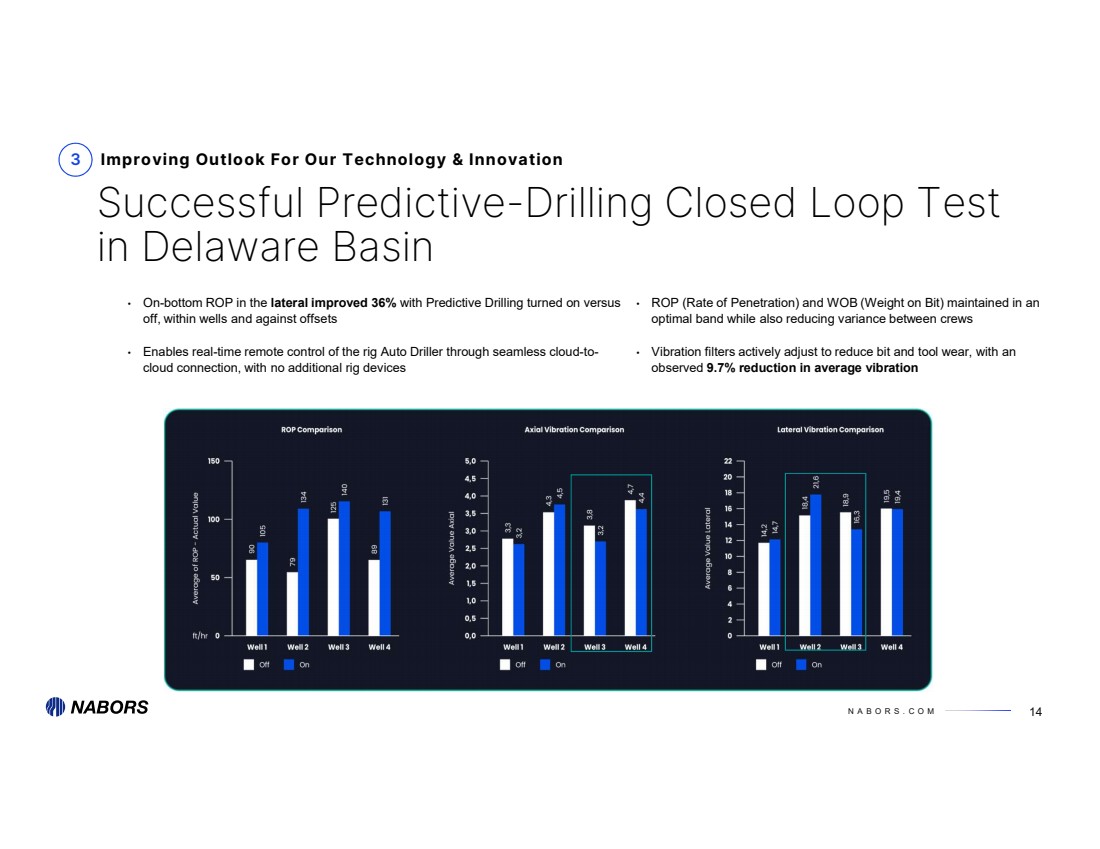
| N A B O R S . C O M 14
3 Improving Outlook For Our Technology & Innovation
Successful Predictive-Drilling Closed Loop Test
in Delaware Basin
• ROP (Rate of Penetration) and WOB (Weight on Bit) maintained in an
optimal band while also reducing variance between crews
• Vibration filters actively adjust to reduce bit and tool wear, with an
observed 9.7% reduction in average vibration
• On-bottom ROP in the lateral improved 36% with Predictive Drilling turned on versus
off, within wells and against offsets
• Enables real-time remote control of the rig Auto Driller through seamless cloud-to-cloud connection, with no additional rig devices |
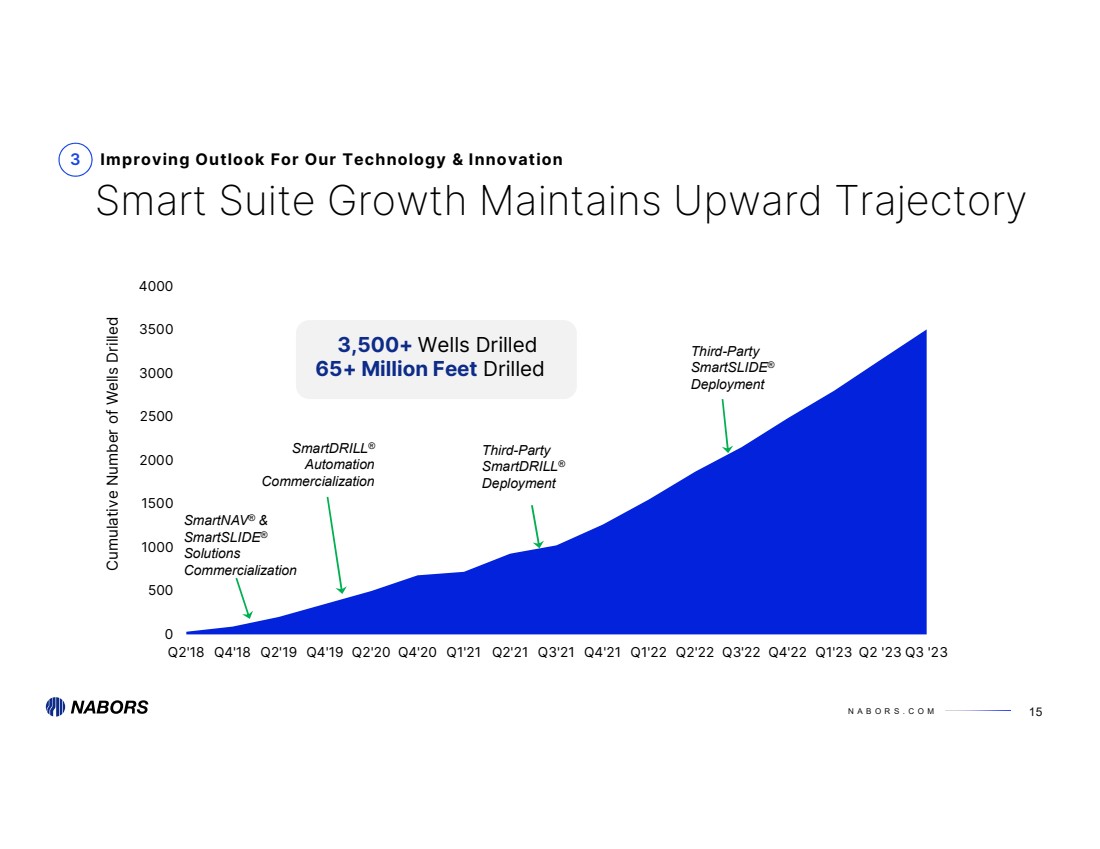
| N A B O R S . C O M 0
500
1000
1500
2000
2500
3000
3500
4000
Q2'18 Q4'18 Q2'19 Q4'19 Q2'20 Q4'20 Q1'21 Q2'21 Q3'21 Q4'21 Q1'22 Q2'22 Q3'22 Q4'22 Q1'23 Q2 '23 Q3 '23 Cumulative Number of Wells Drilled
15
Smart Suite Growth Maintains Upward Trajectory
Improving Outlook For Our Technology & Innovation
3,500+ Wells Drilled
65+ Million Feet Drilled
SmartDRILL®
Automation
Commercialization
SmartNAV® &
SmartSLIDE®
Solutions
Commercialization
Third-Party
SmartDRILL®
Deployment
3
Third-Party
SmartSLIDE®
Deployment |

| N A B O R S . C O M
Performance
excellence in
the Lower-48
Expanding &
enhancing our
International
segment
Advancing
technology &
innovation with
demonstrated
results
Progress on
our
commitment
to de-lever
Leading in
Sustainability
and the Energy
Transition
1 2 3 4 5
Five Keys to Excellence |
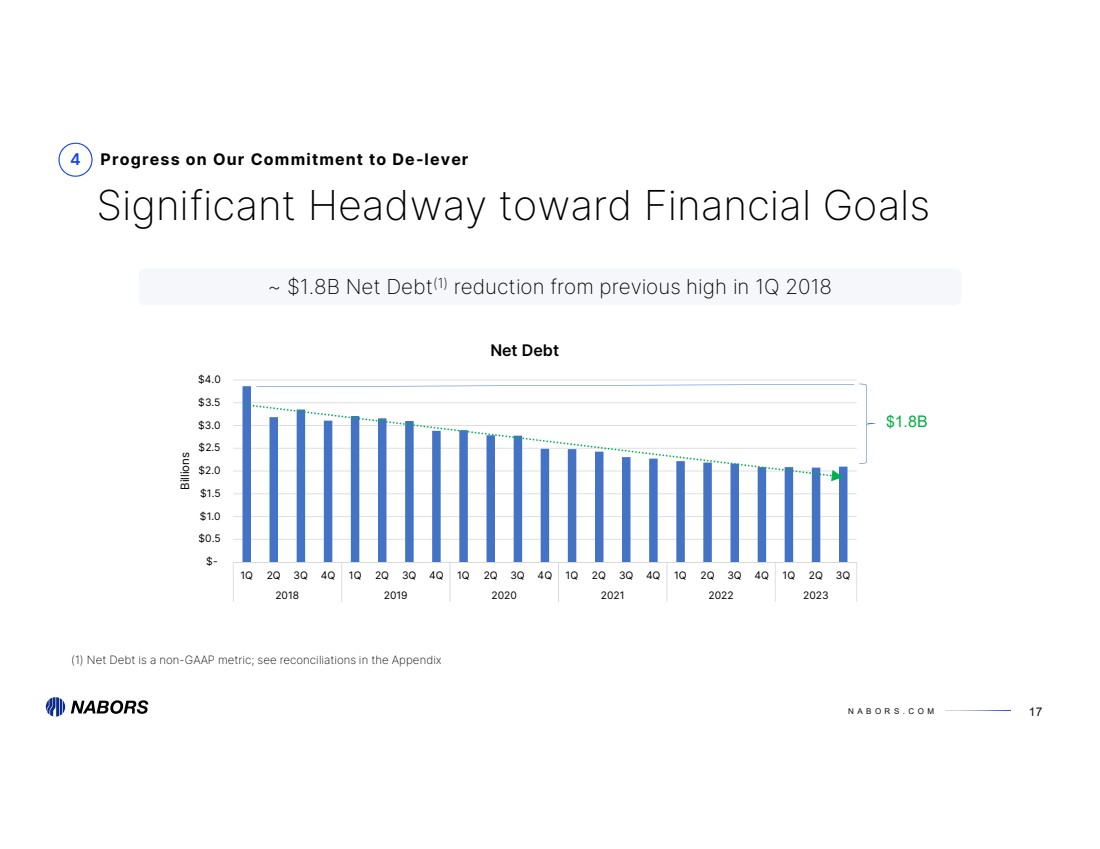
| N A B O R S . C O M
$-
$0.5
$1.0
$1.5
$2.0
$2.5
$3.0
$3.5
$4.0
1Q 2Q 3Q 4Q 1Q 2Q 3Q 4Q 1Q 2Q 3Q 4Q 1Q 2Q 3Q 4Q 1Q 2Q 3Q 4Q 1Q 2Q 3Q
2018 2019 2020 2021 2022 2023 Billions
Net Debt
17
Significant Headway toward Financial Goals
4 Progress on Our Commitment to De-lever
~ $1.8B Net Debt(1) reduction from previous high in 1Q 2018
$1.8B
(1) Net Debt is a non-GAAP metric; see reconciliations in the Appendix |

| N A B O R S . C O M
Performance
excellence in
the Lower-48
Expanding &
enhancing our
International
segment
Advancing
technology &
innovation with
demonstrated
results
Progress on
our
commitment
to de-lever
Leading in
Sustainability
and the Energy
Transition
1 2 3 4 5
Five Keys to Excellence |
| N A B O R S . C O M
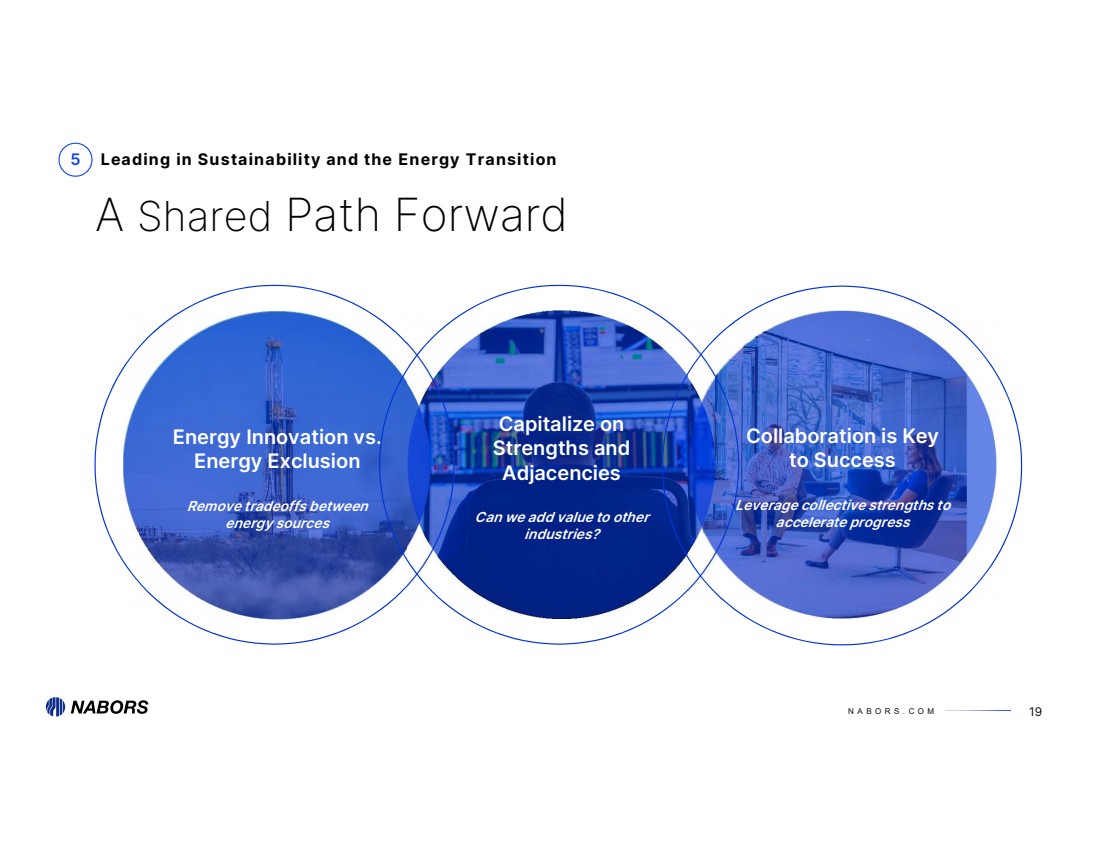
5 Leading in Sustainability and the Energy Transition
Energy Innovation vs.
Energy Exclusion
Remove tradeoffs between
energy sources
19
A Shared Path Forward
Capitalize on
Strengths and
Adjacencies
Can we add value to other
industries?
Collaboration is Key
to Success
Leverage collective strengths to
accelerate progress |
| N A B O R S . C O M
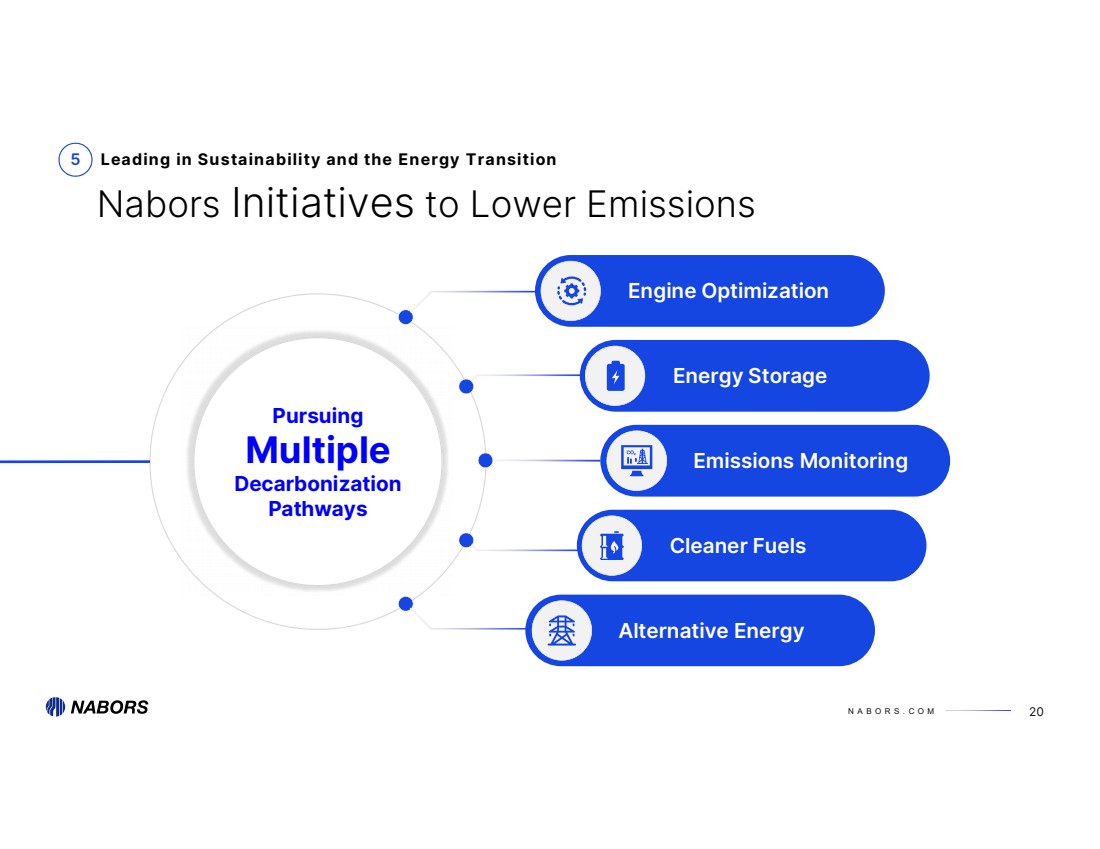
5 Leading in Sustainability and the Energy Transition
20
Nabors Initiatives to Lower Emissions
Pursuing
Multiple
Decarbonization
Pathways
Cleaner Fuels
Energy Storage
Engine Optimization
Emissions Monitoring
Alternative Energy |
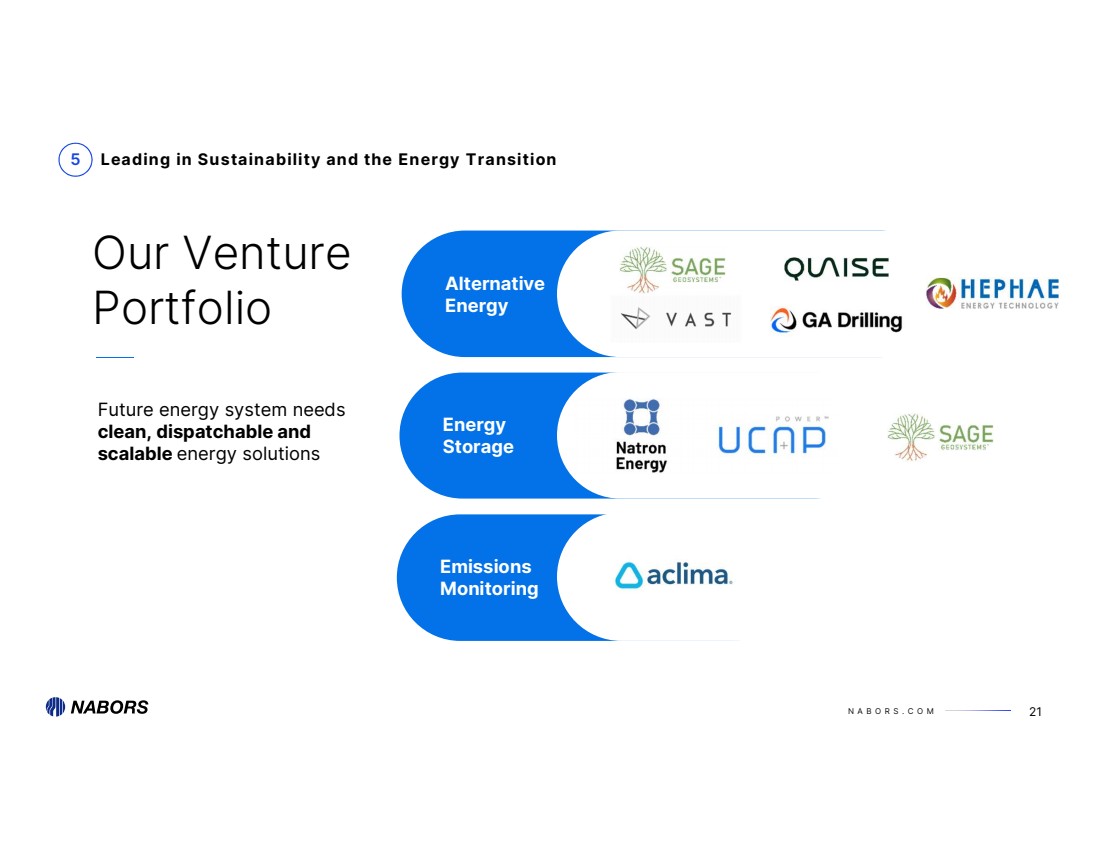
| 5 Leading in Sustainability and the Energy Transition
Emissions
Monitoring
Energy
Storage
Alternative
Energy
Our Venture
Portfolio
Future energy system needs
clean, dispatchable and
scalable energy solutions N A B O R S . C O M 21 |
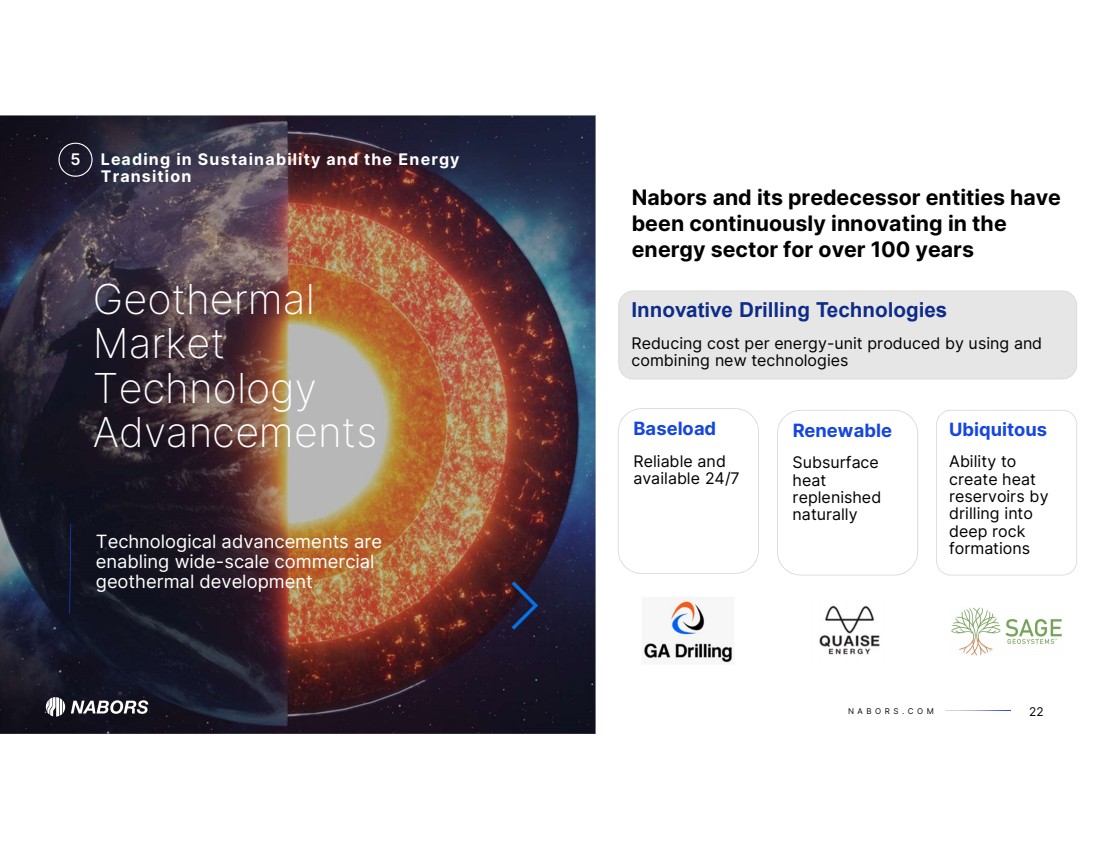
| N A B O R S . C O M 22
Ubiquitous
Ability to
create heat
reservoirs by
drilling into
deep rock
formations
Innovative Drilling Technologies
Reducing cost per energy-unit produced by using and
combining new technologies
Baseload
Reliable and
available 24/7
Renewable
Subsurface
heat
replenished
naturally
Nabors and its predecessor entities have
been continuously innovating in the
energy sector for over 100 years
Geothermal
Market
Technology
Advancements
Technological advancements are
enabling wide-scale commercial
geothermal development
Leading in Sustainability and the Energy
Transition
5 |
| N A B O R S . C O M Appendix
23 |
| N A B O R S . C O M
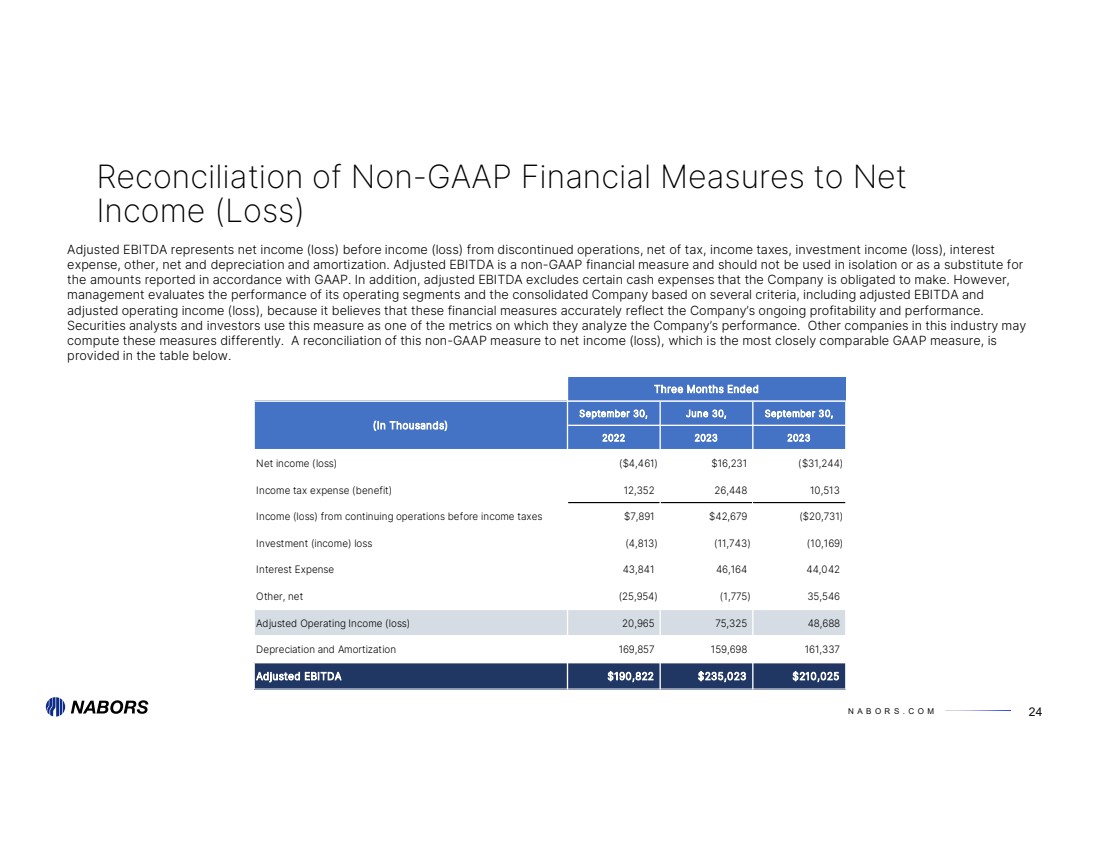
September 30, June 30, September 30,
2022 2023 2023
Net income (loss) ($4,461) $16,231 ($31,244)
Income tax expense (benefit) 12,352 26,448 10,513
Income (loss) from continuing operations before income taxes $7,891 $42,679 ($20,731)
Investment (income) loss (4,813) (11,743) (10,169)
Interest Expense 43,841 46,164 44,042
Other, net (25,954) (1,775) 35,546
Adjusted Operating Income (loss) 20,965 75,325 48,688
Depreciation and Amortization 169,857 159,698 161,337
Adjusted EBITDA $190,822 $235,023 $210,025
(In Thousands)
Three Months Ended
24
Reconciliation of Non-GAAP Financial Measures to Net
Income (Loss)
Adjusted EBITDA represents net income (loss) before income (loss) from discontinued operations, net of tax, income taxes, investment income (loss), interest
expense, other, net and depreciation and amortization. Adjusted EBITDA is a non-GAAP financial measure and should not be used in isolation or as a substitute for
the amounts reported in accordance with GAAP. In addition, adjusted EBITDA excludes certain cash expenses that the Company is obligated to make. However,
management evaluates the performance of its operating segments and the consolidated Company based on several criteria, including adjusted EBITDA and
adjusted operating income (loss), because it believes that these financial measures accurately reflect the Company’s ongoing profitability and performance.
Securities analysts and investors use this measure as one of the metrics on which they analyze the Company’s performance. Other companies in this industry may
compute these measures differently. A reconciliation of this non-GAAP measure to net income (loss), which is the most closely comparable GAAP measure, is
provided in the table below. |
| N A B O R S . C O M
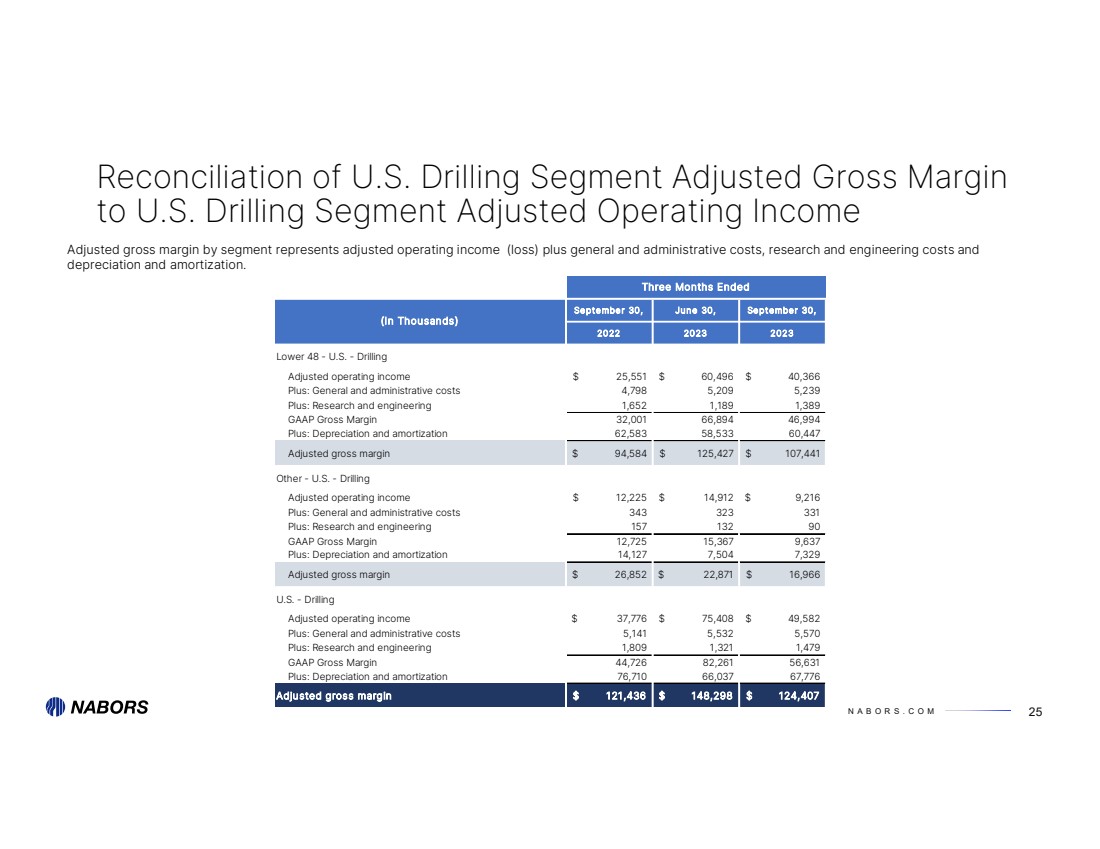
September 30, June 30, September 30,
2022 2023 2023
Lower 48 - U.S. - Drilling
Adjusted operating income 25,551 $ 60,496 $ 40,366 $
Plus: General and administrative costs 4,798 5,209 5,239 Plus: Research and engineering 1,652 1,189 1,389 GAAP Gross Margin 32,001 66,894 46,994 Plus: Depreciation and amortization 62,583 58,533 60,447 Adjusted gross margin 94,584 $ 125,427 $ 107,441 $
Other - U.S. - Drilling
Adjusted operating income 12,225 $ 14,912 $ 9,216 $
Plus: General and administrative costs 343 323 331 Plus: Research and engineering 157 132 90 GAAP Gross Margin 12,725 15,367 9,637 Plus: Depreciation and amortization 14,127 7,504 7,329
Adjusted gross margin 26,852 $ 22,871 $ 16,966 $
U.S. - Drilling
Adjusted operating income 37,776 $ 75,408 $ 49,582 $
Plus: General and administrative costs 5,141 5,532 5,570 Plus: Research and engineering 1,809 1,321 1,479 GAAP Gross Margin 44,726 82,261 56,631 Plus: Depreciation and amortization 76,710 66,037 67,776 Adjusted gross margin 121,436 $ 148,298 $ 124,407 $
(In Thousands)
Three Months Ended
25
Reconciliation of U.S. Drilling Segment Adjusted Gross Margin
to U.S. Drilling Segment Adjusted Operating Income
Adjusted gross margin by segment represents adjusted operating income (loss) plus general and administrative costs, research and engineering costs and
depreciation and amortization. |
| N A B O R S . C O M
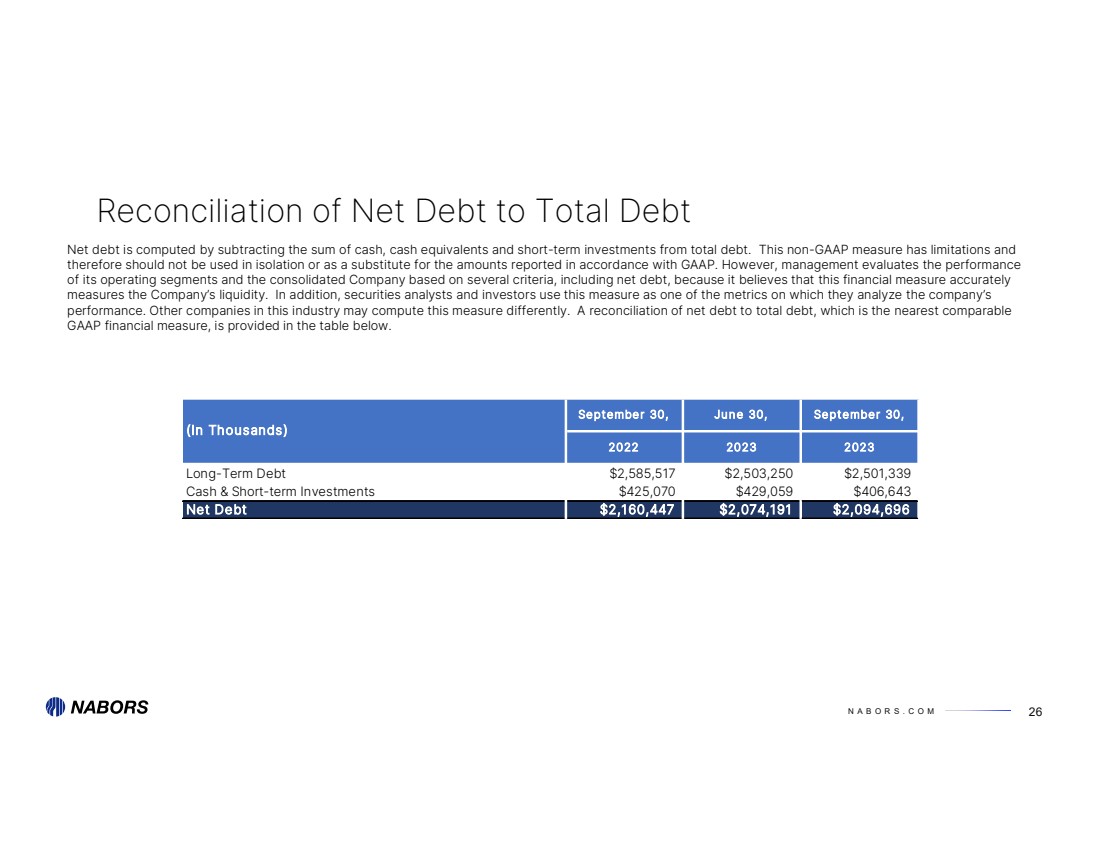
September 30, June 30, September 30,
2022 2023 2023
Long-Term Debt $2,585,517 $2,503,250 $2,501,339
Cash & Short-term Investments $425,070 $429,059 $406,643
Net Debt $2,160,447 $2,074,191 $2,094,696
(In Thousands)
26
Reconciliation of Net Debt to Total Debt
Net debt is computed by subtracting the sum of cash, cash equivalents and short-term investments from total debt. This non-GAAP measure has limitations and
therefore should not be used in isolation or as a substitute for the amounts reported in accordance with GAAP. However, management evaluates the performance
of its operating segments and the consolidated Company based on several criteria, including net debt, because it believes that this financial measure accurately
measures the Company’s liquidity. In addition, securities analysts and investors use this measure as one of the metrics on which they analyze the company’s
performance. Other companies in this industry may compute this measure differently. A reconciliation of net debt to total debt, which is the nearest comparable
GAAP financial measure, is provided in the table below. |
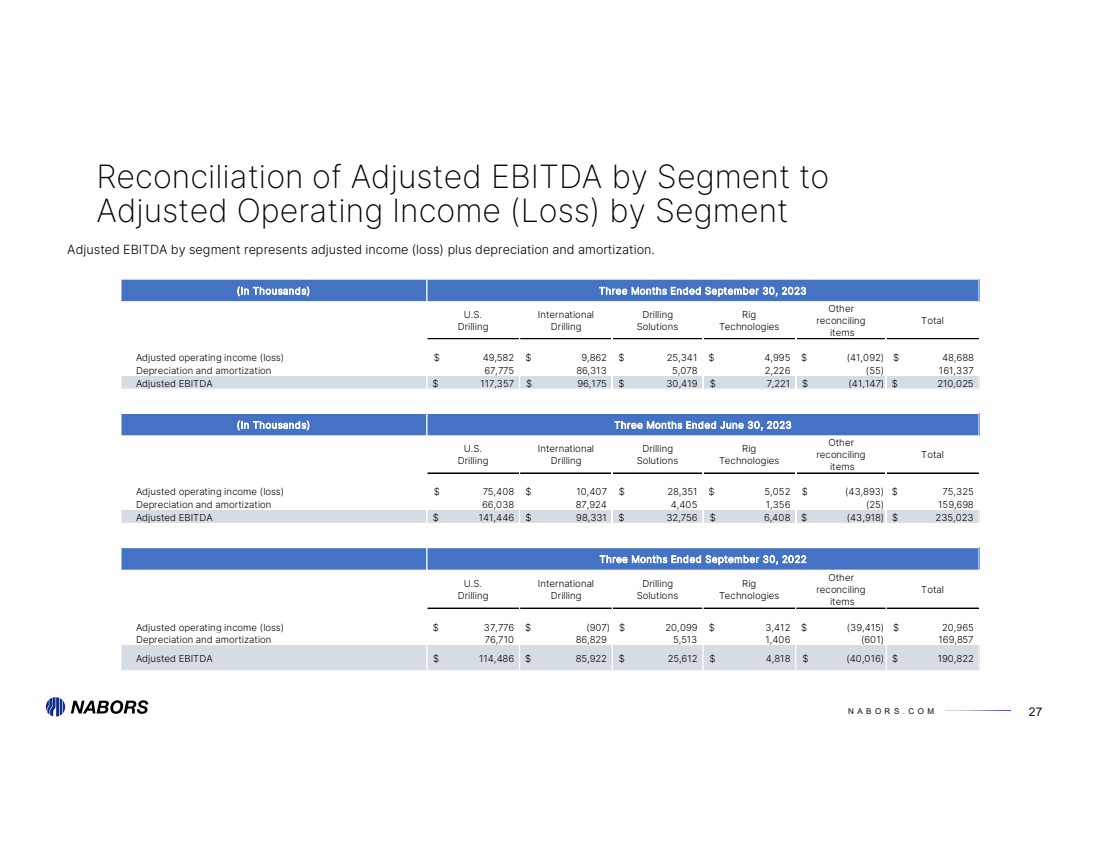
| N A B O R S . C O M
(In Thousands) Three Months Ended September 30, 2023
U.S.
Drilling
International
Drilling
Drilling
Solutions
Rig
Technologies
Other
reconciling
items
Total
Adjusted operating income (loss) 49,582 $ 9,862 $ 25,341 $ 4,995 $ (41,092) $ 48,688 $
Depreciation and amortization 67,775 86,313 5,078 2,226 (55) 161,337 Adjusted EBITDA 117,357 $ 96,175 $ 30,419 $ 7,221 $ (41,147) $ 210,025 $
(In Thousands) Three Months Ended June 30, 2023
U.S.
Drilling
International
Drilling
Drilling
Solutions
Rig
Technologies
Other
reconciling
items
Total
Adjusted operating income (loss) 75,408 $ 10,407 $ 28,351 $ 5,052 $ (43,893) $ 75,325 $
Depreciation and amortization 66,038 87,924 4,405 1,356 (25) 159,698 Adjusted EBITDA 141,446 $ 98,331 $ 32,756 $ 6,408 $ (43,918) $ 235,023 $
Three Months Ended September 30, 2022
U.S.
Drilling
International
Drilling
Drilling
Solutions
Rig
Technologies
Other
reconciling
items
Total
Adjusted operating income (loss) 37,776 $ (907) $ 20,099 $ 3,412 $ (39,415) $ 20,965 $
Depreciation and amortization 76,710 86,829 5,513 1,406 (601) 169,857 Adjusted EBITDA 114,486 $ 85,922 $ 25,612 $ 4,818 $ (40,016) $ 190,822 $
27
Reconciliation of Adjusted EBITDA by Segment to
Adjusted Operating Income (Loss) by Segment
Adjusted EBITDA by segment represents adjusted income (loss) plus depreciation and amortization. |
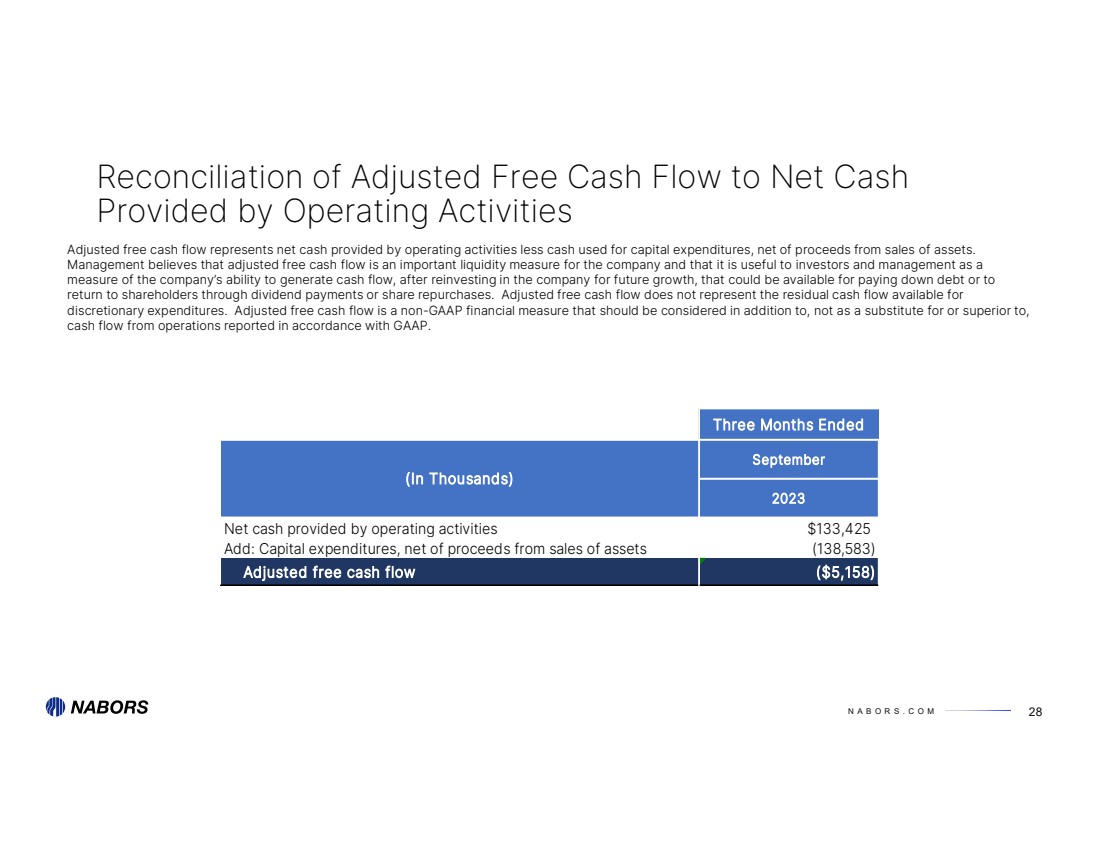
| N A B O R S . C O M
Three Months Ended
September
2023
Net cash provided by operating activities $133,425
Add: Capital expenditures, net of proceeds from sales of assets (138,583)
Adjusted free cash flow ($5,158)
(In Thousands)
28
Reconciliation of Adjusted Free Cash Flow to Net Cash
Provided by Operating Activities
Adjusted free cash flow represents net cash provided by operating activities less cash used for capital expenditures, net of proceeds from sales of assets.
Management believes that adjusted free cash flow is an important liquidity measure for the company and that it is useful to investors and management as a
measure of the company’s ability to generate cash flow, after reinvesting in the company for future growth, that could be available for paying down debt or to
return to shareholders through dividend payments or share repurchases. Adjusted free cash flow does not represent the residual cash flow available for
discretionary expenditures. Adjusted free cash flow is a non-GAAP financial measure that should be considered in addition to, not as a substitute for or superior to,
cash flow from operations reported in accordance with GAAP. |
| NABORS INDUSTRIES LTD.
NABORS.COM
NABORS CORPORATE SERVICES
515 W. Greens Road
Suite 1200
Houston, TX 77067-4525
@ n a b o r s g l o b a l
Contact Us:
William C. Conroy, CFA
VP - Corporate Development and
Investor Relations
William.Conroy@nabors.com
Kara K. Peak
Director - Corporate Development
and Investor Relations
Kara.Peak@nabors.com |
| X |
- DefinitionBoolean flag that is true when the XBRL content amends previously-filed or accepted submission.
| Name: |
dei_AmendmentFlag |
| Namespace Prefix: |
dei_ |
| Data Type: |
xbrli:booleanItemType |
| Balance Type: |
na |
| Period Type: |
duration |
|
| X |
- DefinitionFor the EDGAR submission types of Form 8-K: the date of the report, the date of the earliest event reported; for the EDGAR submission types of Form N-1A: the filing date; for all other submission types: the end of the reporting or transition period. The format of the date is YYYY-MM-DD.
| Name: |
dei_DocumentPeriodEndDate |
| Namespace Prefix: |
dei_ |
| Data Type: |
xbrli:dateItemType |
| Balance Type: |
na |
| Period Type: |
duration |
|
| X |
- DefinitionThe type of document being provided (such as 10-K, 10-Q, 485BPOS, etc). The document type is limited to the same value as the supporting SEC submission type, or the word 'Other'.
| Name: |
dei_DocumentType |
| Namespace Prefix: |
dei_ |
| Data Type: |
dei:submissionTypeItemType |
| Balance Type: |
na |
| Period Type: |
duration |
|
| X |
- DefinitionAddress Line 1 such as Attn, Building Name, Street Name
| Name: |
dei_EntityAddressAddressLine1 |
| Namespace Prefix: |
dei_ |
| Data Type: |
xbrli:normalizedStringItemType |
| Balance Type: |
na |
| Period Type: |
duration |
|
| X |
- DefinitionAddress Line 2 such as Street or Suite number
| Name: |
dei_EntityAddressAddressLine2 |
| Namespace Prefix: |
dei_ |
| Data Type: |
xbrli:normalizedStringItemType |
| Balance Type: |
na |
| Period Type: |
duration |
|
| X |
- DefinitionAddress Line 3 such as an Office Park
| Name: |
dei_EntityAddressAddressLine3 |
| Namespace Prefix: |
dei_ |
| Data Type: |
xbrli:normalizedStringItemType |
| Balance Type: |
na |
| Period Type: |
duration |
|
| X |
- Definition
+ References
+ Details
| Name: |
dei_EntityAddressCityOrTown |
| Namespace Prefix: |
dei_ |
| Data Type: |
xbrli:normalizedStringItemType |
| Balance Type: |
na |
| Period Type: |
duration |
|
| X |
- DefinitionISO 3166-1 alpha-2 country code.
| Name: |
dei_EntityAddressCountry |
| Namespace Prefix: |
dei_ |
| Data Type: |
dei:countryCodeItemType |
| Balance Type: |
na |
| Period Type: |
duration |
|
| X |
- DefinitionCode for the postal or zip code
| Name: |
dei_EntityAddressPostalZipCode |
| Namespace Prefix: |
dei_ |
| Data Type: |
xbrli:normalizedStringItemType |
| Balance Type: |
na |
| Period Type: |
duration |
|
| X |
- DefinitionA unique 10-digit SEC-issued value to identify entities that have filed disclosures with the SEC. It is commonly abbreviated as CIK. Reference 1: http://www.xbrl.org/2003/role/presentationRef
-Publisher SEC
-Name Exchange Act
-Number 240
-Section 12
-Subsection b-2
| Name: |
dei_EntityCentralIndexKey |
| Namespace Prefix: |
dei_ |
| Data Type: |
dei:centralIndexKeyItemType |
| Balance Type: |
na |
| Period Type: |
duration |
|
| X |
- DefinitionIndicate if registrant meets the emerging growth company criteria. Reference 1: http://www.xbrl.org/2003/role/presentationRef
-Publisher SEC
-Name Exchange Act
-Number 240
-Section 12
-Subsection b-2
| Name: |
dei_EntityEmergingGrowthCompany |
| Namespace Prefix: |
dei_ |
| Data Type: |
xbrli:booleanItemType |
| Balance Type: |
na |
| Period Type: |
duration |
|
| X |
- DefinitionCommission file number. The field allows up to 17 characters. The prefix may contain 1-3 digits, the sequence number may contain 1-8 digits, the optional suffix may contain 1-4 characters, and the fields are separated with a hyphen.
| Name: |
dei_EntityFileNumber |
| Namespace Prefix: |
dei_ |
| Data Type: |
dei:fileNumberItemType |
| Balance Type: |
na |
| Period Type: |
duration |
|
| X |
- DefinitionTwo-character EDGAR code representing the state or country of incorporation.
| Name: |
dei_EntityIncorporationStateCountryCode |
| Namespace Prefix: |
dei_ |
| Data Type: |
dei:edgarStateCountryItemType |
| Balance Type: |
na |
| Period Type: |
duration |
|
| X |
- DefinitionThe exact name of the entity filing the report as specified in its charter, which is required by forms filed with the SEC. Reference 1: http://www.xbrl.org/2003/role/presentationRef
-Publisher SEC
-Name Exchange Act
-Number 240
-Section 12
-Subsection b-2
| Name: |
dei_EntityRegistrantName |
| Namespace Prefix: |
dei_ |
| Data Type: |
xbrli:normalizedStringItemType |
| Balance Type: |
na |
| Period Type: |
duration |
|
| X |
- DefinitionThe Tax Identification Number (TIN), also known as an Employer Identification Number (EIN), is a unique 9-digit value assigned by the IRS. Reference 1: http://www.xbrl.org/2003/role/presentationRef
-Publisher SEC
-Name Exchange Act
-Number 240
-Section 12
-Subsection b-2
| Name: |
dei_EntityTaxIdentificationNumber |
| Namespace Prefix: |
dei_ |
| Data Type: |
dei:employerIdItemType |
| Balance Type: |
na |
| Period Type: |
duration |
|
| X |
- DefinitionLocal phone number for entity.
| Name: |
dei_LocalPhoneNumber |
| Namespace Prefix: |
dei_ |
| Data Type: |
xbrli:normalizedStringItemType |
| Balance Type: |
na |
| Period Type: |
duration |
|
| X |
- DefinitionBoolean flag that is true when the Form 8-K filing is intended to satisfy the filing obligation of the registrant as pre-commencement communications pursuant to Rule 13e-4(c) under the Exchange Act. Reference 1: http://www.xbrl.org/2003/role/presentationRef
-Publisher SEC
-Name Exchange Act
-Number 240
-Section 13e
-Subsection 4c
| Name: |
dei_PreCommencementIssuerTenderOffer |
| Namespace Prefix: |
dei_ |
| Data Type: |
xbrli:booleanItemType |
| Balance Type: |
na |
| Period Type: |
duration |
|
| X |
- DefinitionBoolean flag that is true when the Form 8-K filing is intended to satisfy the filing obligation of the registrant as pre-commencement communications pursuant to Rule 14d-2(b) under the Exchange Act. Reference 1: http://www.xbrl.org/2003/role/presentationRef
-Publisher SEC
-Name Exchange Act
-Number 240
-Section 14d
-Subsection 2b
| Name: |
dei_PreCommencementTenderOffer |
| Namespace Prefix: |
dei_ |
| Data Type: |
xbrli:booleanItemType |
| Balance Type: |
na |
| Period Type: |
duration |
|
| X |
- DefinitionTitle of a 12(b) registered security. Reference 1: http://www.xbrl.org/2003/role/presentationRef
-Publisher SEC
-Name Exchange Act
-Number 240
-Section 12
-Subsection b
| Name: |
dei_Security12bTitle |
| Namespace Prefix: |
dei_ |
| Data Type: |
dei:securityTitleItemType |
| Balance Type: |
na |
| Period Type: |
duration |
|
| X |
- DefinitionName of the Exchange on which a security is registered. Reference 1: http://www.xbrl.org/2003/role/presentationRef
-Publisher SEC
-Name Exchange Act
-Number 240
-Section 12
-Subsection d1-1
| Name: |
dei_SecurityExchangeName |
| Namespace Prefix: |
dei_ |
| Data Type: |
dei:edgarExchangeCodeItemType |
| Balance Type: |
na |
| Period Type: |
duration |
|
| X |
- DefinitionBoolean flag that is true when the Form 8-K filing is intended to satisfy the filing obligation of the registrant as soliciting material pursuant to Rule 14a-12 under the Exchange Act. Reference 1: http://www.xbrl.org/2003/role/presentationRef
-Publisher SEC
-Name Exchange Act
-Section 14a
-Number 240
-Subsection 12
| Name: |
dei_SolicitingMaterial |
| Namespace Prefix: |
dei_ |
| Data Type: |
xbrli:booleanItemType |
| Balance Type: |
na |
| Period Type: |
duration |
|
| X |
- DefinitionTrading symbol of an instrument as listed on an exchange.
| Name: |
dei_TradingSymbol |
| Namespace Prefix: |
dei_ |
| Data Type: |
dei:tradingSymbolItemType |
| Balance Type: |
na |
| Period Type: |
duration |
|
| X |
- DefinitionBoolean flag that is true when the Form 8-K filing is intended to satisfy the filing obligation of the registrant as written communications pursuant to Rule 425 under the Securities Act. Reference 1: http://www.xbrl.org/2003/role/presentationRef
-Publisher SEC
-Name Securities Act
-Number 230
-Section 425
| Name: |
dei_WrittenCommunications |
| Namespace Prefix: |
dei_ |
| Data Type: |
xbrli:booleanItemType |
| Balance Type: |
na |
| Period Type: |
duration |
|
Grafico Azioni Nabors Industries (NYSE:NBR)
Storico
Da Ago 2024 a Set 2024

Grafico Azioni Nabors Industries (NYSE:NBR)
Storico
Da Set 2023 a Set 2024
