Bitcoin & The Hunt For A Green October | BTCUSD September 27, 2022
27 Settembre 2022 - 10:59PM
NEWSBTC
In this episode of NewsBTC’s daily technical analysis videos, we
examine the reason for today’s volatility and rally rejection. We
also look ahead at the factors that could give Bitcoin price a
green October. Take a look at the video below: VIDEO: Bitcoin Price
Analysis (BTCUSD): September 27, 2022 This morning, Bitcoin
began with a large, more than 5% move to the upside, taking the top
cryptocurrency to back over $20,000. Before bulls could at all
breath a sigh of relief, bears swatted the rally back down a full
thousand plus dollars to just under $19,000. Related Reading:
Bitcoin Shows Resilience In Dollar-Driven Bloodbath | BTCUSD
September 26, 2022 Bears And Bulls Battle Over Control Of Momentum
The strong showing by both bears and bulls makes sense, given the
potential for a bullish crossover in daily momentum on the LMACD.
Crossovers in the past have been used as bait to liquidate
over-eager traders and it has happened once again. The severity of
the showdown is due to the same situation happening across several
timeframes. The 3-Day LMACD also shows momentum teetering between
bear and bull along the zero line. BTC compared to other asset
classes | Source: BTCUSD on TradingView.com Today’s Rejection
Resembles Crypto Winter Bottom On weekly timeframes, there is also
such a potential bullish crossover on the LMACD. Bears have
repeatedly defended this signal. Before the rejection today,
Bitcoin was back in the green and beyond the zero-line.
Interestingly, the current weekly candle also closely resembles the
corresponding candle that appeared at the bullish crossover at the
2018 bear market bottom. Once again, there is a long upside
wick coinciding with the crossover. The crossover was ultimately
confirmed despite being defended by bears, and a bottom of the last
major crypto winter was in. Several weekly indicators could suggest
the bottom is in | Source: BTCUSD on TradingView.com Related
Reading: Can Bitcoin Withstand Continued Dollar Strength? | BTCUSD
September 22, 2022 Why Bitcoin Could Close October In The Green
Finally, on monthly timeframes, although we are far away from any
type of a bull cross, bears must maintain momentum or risk allowing
bulls to take back control over crypto. With only three days
left in the monthly timeframe, and bullish crossovers on the daily,
3-day, and weekly, the hunt for a green October is on. Out of the
last twelve Octobers, Bitcoin closed only four of them red.
Currently, no monthly candles have closed below the former all-time
high set back in 2017, but this is what bears are salivating over.
If bulls can prevent a close below this level, they could send
bears back into hibernation for at least another three months. Even
if bulls close below the critical support level, the resulting
candle will look just like the monthly candle where the tides did
ultimately turn, and a new uptrend began. Is the Bitcoin forming an
Adam and Eve bottom? | Source: BTCUSD on TradingView.com Learn
crypto technical analysis yourself with the NewsBTC Trading Course.
Click here to access the free educational program. Follow
@TonySpilotroBTC on Twitter or join the TonyTradesBTC Telegram
for exclusive daily market insights and technical analysis
education. Please note: Content is educational and should not
be considered investment advice. Featured image from
iStockPhoto, Charts from TradingView.com
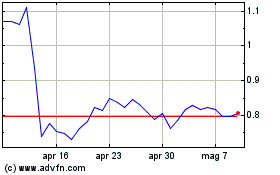
Grafico Azioni EOS (COIN:EOSUSD)
Storico
Da Mar 2024 a Apr 2024

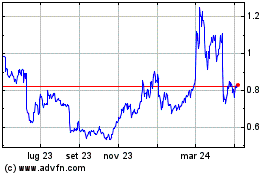
Grafico Azioni EOS (COIN:EOSUSD)
Storico
Da Apr 2023 a Apr 2024
