Bitcoin Demand Outweighs Supply As LTH Enter Active Distribution Phase
19 Novembre 2024 - 9:00PM
NEWSBTC
Bitcoin (BTC) has held steady above the $88,000 mark over the past
few days, showcasing resilience as the broader market anticipates
its next move. Price action remains robust, leaving investors
waiting for lower prices frustrated, as BTC shows no signs of
providing an easy entry point anytime soon. Related Reading:
Dogecoin Breaking Out Of Falling Wedge Pattern – Analyst Reveals
Target Key data from CryptoQuant reveals that long-term holders
(LTHs) are currently in an active distribution phase, signaling
increased selling activity from this group. Despite this, the
market has absorbed the additional supply without significant price
impact, highlighting the strong demand supporting BTC at these
levels. As Bitcoin consolidates just below its all-time highs,
traders and analysts are closely watching whether the current
momentum will lead to a breakout or if a retracement is on the
horizon. The balance between rising demand and LTH distribution
will likely determine BTC’s near-term trajectory. Can Bitcoin Set
New ATH This Week? Bitcoin is on the brink of breaking its all-time
high (ATH) again this week, sitting just 2% below the $93,483 level
set last Wednesday. Excitement is building as analysts and
investors closely watch BTC’s price action, anticipating whether it
will surge past this critical level or enter a prolonged
consolidation phase. While the bullish momentum remains strong, the
possibility of a sideways movement could keep the price range-bound
for an extended period before the next significant move. Data from
CryptoQuant analyst Axel Adler highlights that long-term holders
(LTHs) are currently in an active distribution phase. Despite this,
the increased supply has not significantly impacted Bitcoin’s
price, thanks to strong demand that continues to absorb selling
pressure. This dynamic reflects the robust market interest that is
supporting BTC near its record highs. Adler’s analysis also points
to the LTH Spending Binary Indicator, which signals peak spending
activity among LTHs. At the same time, the growing LTH supply
suggests that a portion of long-term holders remain confident in
BTC’s future price potential. These factors create a unique
environment where high demand offsets distribution, keeping the
bullish momentum intact. Related Reading: Last Chance To Buy
Ethereum? Analyst Expects $6,000 Once It Breaks 8-Month
Accumulation As Bitcoin flirts with its ATH, market participants
await confirmation of whether the price will push into uncharted
territory or pause for consolidation. The outcome will likely set
the tone for BTC’s trajectory in the coming weeks, with investors
betting on the continued upside in this resilient rally. BTC Price
Action: Key Levels To Hold Bitcoin is trading at $91,820,
following several days of sideways consolidation just below its
all-time high (ATH). Despite the pause, BTC has maintained its
position above the $87,000 support level since the last breakout,
signaling its importance as a crucial line for bulls to defend.
Holding this level is vital for sustaining upward momentum and
setting the stage for Bitcoin to push into uncharted territory.
However, a drop below $87,000 could shift market sentiment, likely
triggering a correction as BTC searches for fresh demand. The next
logical support zone lies around the $80,000 mark, with the
potential for a deeper pullback if selling pressure intensifies.
Such a retrace would provide an opportunity for sidelined buyers
but could temporarily stall BTC’s rally. Bitcoin’s price action
remains robust, bolstered by demand that continues to outpace
supply. This strong market interest has mitigated the impact of
profit-taking and selling activity, keeping the broader uptrend
intact. Related Reading: Solana Breaks Above Key Resistance
At $225 – ATH Next? As BTC consolidates near its ATH, traders
closely watch key levels to determine whether the next move will be
a breakout to new highs or a dip to test lower support zones.
Either outcome will likely shape Bitcoin’s trajectory in the coming
weeks. Featured image from Dall-E, chart from TradingView
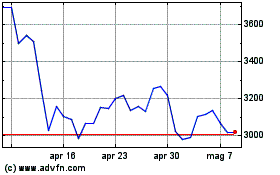
Grafico Azioni Ethereum (COIN:ETHUSD)
Storico
Da Ott 2024 a Nov 2024

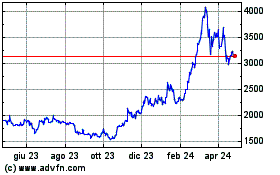
Grafico Azioni Ethereum (COIN:ETHUSD)
Storico
Da Nov 2023 a Nov 2024
