Uniswap Depreciates, Vital Levels To Keep An Eye On
20 Aprile 2023 - 1:00AM
NEWSBTC
The past few days saw a recovery in the Uniswap price, but it
appears that the bullish trend has reached exhaustion. UNI dropped
by 6% in the past 24 hours, causing its price to fall below its
descending line. Although Uniswap gained 0.7% on the weekly chart,
most of its gains were wiped out due to the recent drop in price.
Currently, the technical outlook for Uniswap indicates that the
bears are gaining strength, with demand for the altcoin dipping as
buyers lose confidence and accumulation decreases. Related Reading:
Coinbase Turns To Europe For Growth Amid Clampdown By US Regulators
For buyers to re-enter the market, UNI must surpass its immediate
resistance mark, and buyer strength must make a comeback. However,
if Bitcoin fails to remain above the $30,000 mark, it is likely
that other altcoins like UNI will also experience a dip. Even if
BTC surges again, UNI’s recovery may not be sustainable in the long
run. In addition, UNI’s trading volume has declined, suggesting an
increase in short-term selling on the one-day chart. Uniswap Price
Analysis: One-Day Chart At the time of writing, UNI was priced at
$5.95 with a key resistance level of $6. Breaking through this
resistance could potentially push UNI to reach $6.30, thereby
reversing the bearish thesis. Conversely, if UNI loses its current
price level, it may find support at $5.70. However, if it falls
below this level, it could drop to $5.30. The recent trading
session saw an increase in the number of sellers, which was
reflected by the red volume bars on the chart. Technical Analysis
Buyers are leaving the market owing to decreased demand. This has
caused Relative Strength Index (RSI) to dip below the half-line,
indicating that sellers currently outnumber buyers. A further drop
in price could lead to a complete return of bearish sentiment as
the price falls into a supply zone. Additionally, UNI’s price has
fallen below the 20-Simple Moving Average (SMA) line, indicating
that sellers are currently driving the price momentum in the
market. However, if buyers were to step in, UNI could potentially
rise above the 20-SMA line. The bears have taken over, as evidenced
by other technical indicators. Despite this, the Moving Average
Convergence Divergence (MACD) indicator displayed green histograms.
These are associated with buy signals. Related Reading: These Top 5
Cryptos Are Thriving Despite A Slippery Market However, the buy
signal’s strength has decreased. It indicated mounting bearish
pressure. Meanwhile, the Bollinger Bands, which measure price
volatility and fluctuation, have tightened, suggesting that UNI
could experience range-bound movement in the upcoming trading
sessions. Moving forward the broader market strength will be
crucial for the price of the altcoin. Featured Image From UnSplash,
Charts From TradingView.com
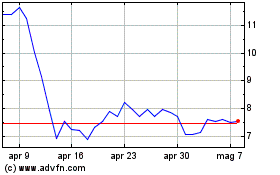
Grafico Azioni Uniswap (COIN:UNIUSD)
Storico
Da Mar 2024 a Apr 2024

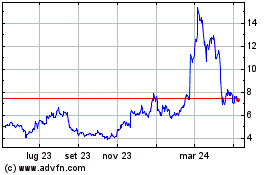
Grafico Azioni Uniswap (COIN:UNIUSD)
Storico
Da Apr 2023 a Apr 2024
