New mortgage volumes climbed to over 410k during Q2, the highest
ever volume recorded in a single quarter. This is a 60.2 per cent
increase compared to the same period in 2020, according to Equifax
Canada’s most recent consumer credit trends and insights report.
Soaring home prices have also increased the average loan amount for
new mortgages to over $355k, a 22.2 per cent increase from Q2 2020.
New mortgage growth has been strong across the country, but B.C.
saw an exceptional increase in new mortgage volume during the
second quarter with a year-over-year increase of 85.7 per cent.
Apart from a strong housing market, seasonality and refinancing
also played a big role in the new mortgage growth this quarter.
High mortgage growth and low interest rates have helped Home Equity
Lines of Credit (HELOCs) rebound. New HELOC volume increased by
56.7 per cent when compared to Q2 2020 — the highest it has been in
the last ten years.
Variable Rate Home Equity Lines of Credit and Mortgages
May be Cause for Concern
“The HELOC trend is worrisome as often the payments are tied to
a variable interest rate,” said Rebecca Oakes, AVP of Advanced
Analytics at Equifax Canada. “In 2018 when interest rates went up,
we saw a drop in credit card payments, especially among consumers
with a HELOC. It also led to higher bankruptcies among older
consumers with HELOCs.”
Another concerning trend Oakes points to is the amount of
mortgage debt being taken by consumers with lower credit scores.
These consumers form a small percentage of all new mortgages (10
per cent), but their average loan amount has increased at the same
rate as consumers with higher credit scores. With uncertain times
due to the pandemic still ahead, these consumers could find
themselves less equipped to manage future additional financial
stress. Adding to the concern, according to Oakes, is the rate of
inflation, up 3.7 per cent in the last 12 months, which is the
highest annual increase since May 2011.
“Prices for consumer goods have risen and if the inflation trend
continues, there is potential for an earlier-than-planned interest
rate increase to curb this,” said Oakes. “With many consumers now
heavily leveraged and the potential for increases on variable rate
mortgage and HELOCs, consumers may find themselves not in a
position to pay back their debt obligations if interest rates rise.
This can lead to higher insolvencies.”
Total Consumer Debt Climbs Higher
Driven by considerable mortgage growth, overall consumer debt
now stands at $2.15 trillion, up 3.0 per cent from last
quarter and up 7.5 per cent from Q2 2020. On an individual basis
the average consumer debt (excluding mortgages) is $20,640, a drop
of 1.6 per cent when compared to Q2 2020, but an increase of 1.0
per cent versus Q1. Lower average debt is consistent with all risk
segments except for consumers with higher credit scores. The
average non-mortgage debt per consumer is up by 1.0 per cent from
last year for this group, driven by increased demand for credit
cards and loans.
Adding to the overall increase in consumer debt, volumes for new
auto and installment loans are returning to pre-pandemic levels.
When compared to the lows of Q2 2020, they show a 47.2 per cent
(new auto) and 19.5 per cent (installment loan) increase in new
volume this quarter.
New credit card growth is also picking up pace, doubling the
volume seen a year ago when demand was at its lowest. Quarter over
quarter new card volume increased by 2.8 per cent, but has yet to
reach pre-pandemic levels. The average credit limit assigned to new
cards is also increasing, up 4.4 per cent when compared to the same
time period last year.
Delinquencies Continue to DeclineDespite
deferral programs ending, delinquency rates dropped from Q1 2021.
Government support and increased disposable income are still
helping consumers pay off their debts and improve their credit
score. The average Equifax credit score for consumers increased by
12 points in the last two years.
The 90+ day delinquency rates for both mortgage and non-mortgage
products continued to decrease this quarter, down by 32.6 per cent
and 28.6 per cent respectively, when compared to Q2 2020
“Lower delinquencies are a good thing, however, insolvency
volumes are higher this quarter than the lows of last year,” said
Oakes. “We may see surprise insolvencies occur where consumers with
no delinquency history on file and a decent credit score end up
filing without warning.”
Consumer proposals have outgrown personal bankruptcies as the
preferred debt relief solution over the last few years. A consumer
proposal is a legal agreement between a consumer and creditor,
where the creditor agrees to allow the consumer to pay off a
percentage of their debt at a reduced rate over a specific time
period without losing their assets. This trend was even more
visible after the drop in overall insolvencies in Q2 2020 when
consumer proposals started to rise, even when delinquencies were
low.
“The consumer credit market continues to recover from the
effects of the pandemic, with government support playing an
important role in improving Canadians’ credit health,” concluded
Oakes. “We’ll continue to monitor how increases in inflation and
decreases in government incentives impact consumer debt levels and
insolvencies over the coming months.”
Debt (excluding mortgages) & Delinquency
Rates
|
Age |
Average Debt (Q2 2021) |
Average Debt ChangeYear-over-Year(Q2 2021 vs. Q2 2020) |
Delinquency Rate(Q2 2021) |
Delinquency Rate ChangeYear-over-Year(Q2 2021 vs. Q2 2020) |
|
18-25 |
$8,401 |
-1.04% |
1.26% |
-26.84% |
|
26-35 |
$16,540 |
0.75% |
1.38% |
-24.58% |
|
36-45 |
$24,549 |
-0.57% |
1.08% |
-30.14% |
|
46-55 |
$30,887 |
-1.53% |
0.81% |
-31.50% |
|
56-65 |
$26,086 |
-2.98% |
0.72% |
-29.72% |
|
65+ |
$14,539 |
-2.46% |
0.83% |
-28.31% |
|
Canada |
$20,640 |
-1.59% |
0.95% |
-28.60% |
Major City Analysis – Debt (excluding
mortgages) & Delinquency Rates
|
City |
Average Debt(Q2 2021) |
Average Debt ChangeYear-over-Year(Q2 2021 vs. Q2 2020) |
Delinquency Rate(Q2 2021) |
Delinquency Rate ChangeYear-over-Year(Q2 2021 vs. Q2 2020) |
|
Calgary |
$25,346 |
-2.47% |
1.20% |
-24.34% |
|
Edmonton |
$24,633 |
-2.55% |
1.47% |
-20.16% |
|
Halifax |
$21,130 |
-3.38% |
1.11% |
-26.91% |
|
Montreal |
$15,695 |
0.88% |
0.83% |
-41.48% |
|
Ottawa |
$18,225 |
-2.44% |
0.86% |
-27.24% |
|
Toronto |
$19,337 |
0.76% |
1.16% |
-25.35% |
|
Vancouver |
$21,909 |
-0.46% |
0.73% |
-26.14% |
|
St. John's |
$23,983 |
-0.57% |
1.30% |
-22.44% |
|
Fort McMurray |
$38,014 |
-0.28% |
1.66% |
-21.34% |
Province Analysis - Debt (excluding mortgages)
& Delinquency Rates
|
Province |
Average Debt(Q2 2021) |
Average Debt ChangeYear-over-Year(Q2 2021 vs. Q2 2020) |
Delinquency Rate(Q2 2021) |
Delinquency Rate ChangeYear-over-Year(Q2 2021 vs. Q2 2020) |
|
Ontario |
$20,508 |
-1.25% |
0.91% |
-27.73% |
|
Quebec |
$17,927 |
-1.23% |
0.62% |
-43.89% |
|
Nova Scotia |
$20,954 |
-2.38% |
1.27% |
-27.08% |
|
New Brunswick |
$22,356 |
-2.71% |
1.39% |
-23.01% |
|
PEI |
$21,995 |
0.13% |
0.86% |
-28.98% |
|
Newfoundland |
$23,135 |
0.20% |
1.34% |
-23.95% |
|
Eastern Region |
$21,926 |
-1.76% |
1.30% |
-25.12% |
|
Alberta |
$25,524 |
-2.31% |
1.36% |
-21.14% |
|
Manitoba |
$16,938 |
-3.29% |
1.10% |
-28.11% |
|
Saskatchewan |
$22,716 |
-1.94% |
1.26% |
-23.15% |
|
British Columbia |
$21,308 |
-1.16% |
0.84% |
-25.32% |
|
Western Region |
$22,490 |
-1.91% |
1.11% |
-23.46% |
|
Canada |
$20,640 |
-1.59% |
0.95% |
-28.60% |
* Based on Equifax data for Q2 2021
About EquifaxAt Equifax (NYSE:
EFX), we believe knowledge drives progress. As a global data,
analytics, and technology company, we play an essential role in the
global economy by helping financial institutions, companies,
employees, and government agencies make critical decisions with
greater confidence. Our unique blend of differentiated data,
analytics, and cloud technology drives insights to power decisions
to move people forward. Headquartered in Atlanta and supported by
more than 11,000 employees worldwide, Equifax operates or has
investments in 25 countries in North America, Central and South
America, Europe, and the Asia Pacific region. For more information,
visit Equifax.ca and follow the company’s news on LinkedIn and
Twitter.
| Contact: |
| Andrew
Findlater |
Heather
Aggarwal |
| SELECT Public Relations |
Equifax Canada Media Relations |
| afindlater@selectpr.ca |
MediaRelationsCanada@equifax.com |
| (647) 444-1197 |
|
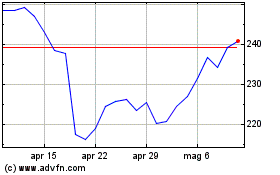
Grafico Azioni Equifax (NYSE:EFX)
Storico
Da Mar 2024 a Apr 2024

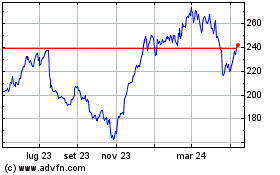
Grafico Azioni Equifax (NYSE:EFX)
Storico
Da Apr 2023 a Apr 2024
