BOND REPORT: Treasury Yields Look Set To Fall A 4th Session In A Row
15 Marzo 2018 - 1:11PM
Dow Jones News
By Mark DeCambre, MarketWatch
U.S. government bond prices were on track to rise for a fourth
straight session, driving yields lower, as fears about global trade
conflicts and subsiding concerns about rising inflation and an
overheated economy helped to support buying in Treasurys.
How are Treasurys performing?
The 10-year Treasury note yield edged down by 0.9 basis point to
2.806%, according to FactSet, while the 30-year bond rate shed 1.3
basis points to 3.045%. The two-year note yield ticked 0.2 basis
point lower at 2.258%.
All three maturities have seen yields fall, and prices rise, for
three consecutive sessions
Bond prices and yields move in the opposite direction.
What's driving trading in government paper?
Persistent concerns about a global trade war have elevated haven
buying in Treasurys, with those worries heightened after President
Donald Trump said Wednesday his administration would seek to trim
the U.S.'s trade deficit with China by $100 billion, a day after
saying he wants to impose up to $60 billion in tariffs on Chinese
goods
(http://www.marketwatch.com/story/trump-reportedly-eyes-60-billion-in-tariffs-on-china-goods-2018-03-13).
Wall Street jitters that a retaliation by Beijing, the world's
second-largest economy, and other countries, could derail the
U.S.'s economic expansion now in its 10th year.
On Wednesday, German Chancellor Angela Merkel's said she was
pessimistic over the eurozone's ability to negotiate an exemption
from the steel and aluminum import tariffs.
Meanwhile, inflation anxieties have been quelled, at least for
the moment, with recent reports on rising prices and Wednesday's
retail-sales report offering few signs that the economy is running
hot enough to merit more than the three rate increases from the
Federal Reserve than the market is pricing in.
In fact, consumer buying has been trending lower. Retail sales
fell 0.1% in February
(http://www.marketwatch.com/story/us-retail-sales-fall-for-third-month-in-a-row-2018-03-14)compared
with a 0.3% forecast from economists polled by MarketWatch. That
marks the third decline a row, a record last matched in 2012.
Rising Inflation is bearish for bonds because climbing prices
can erode the fixed value of a bond.
Market participants also digested news that Trump was replacing
his outgoing chief economic adviser, Gary Cohn, a key engineer to
many of the president's fiscal stimulus measures, with CNBC's Larry
Kudlow
(http://www.marketwatch.com/story/lawrence-kudlow-is-fan-and-critic-of-trumps-economic-positions-2018-03-14)
as National Economic Council director. Kudlow isn't supportive of
broad tariffs on international allies.
What data are ahead?
What are strategists saying?
"This weakness [in consumer spending] rather goes against the
prevailing narrative of multiple rate rises this year from the
Federal Reserve. If last week's weaker than expected wages data
pushed back the thinking on the prospect of four rate rises this
year, then yesterday's retail sales data rather calls into question
the possibility of three. This was reflected in US bond yields
slipping back, with the 10 year yield slipping as low as 2.8% at
one point," wrote Michael Hewson, chief market analyst at CMC
Markets UK, referring to last Friday's monthly jobs report for
February
(http://www.marketwatch.com/story/us-adds-313000-jobs-in-february-in-biggest-gain-in-a-year-and-a-half-2018-03-09)
that revealed a muted level of wage growth, which also helped to
calm inflation worries.
What other assets are in focus?
The German 10-year government bond yield fell to 0.578% from
0.592% late Wednesday. German bonds, also known as bunds, are often
viewed as a proxy for the health of the eurozone.
Meanwhile, the Dow Jones Industrial Average and the S&P 500
index aimed to halt a three-session skid
(http://www.marketwatch.com/story/dow-gathers-strength-for-a-rally-after-3-day-skid-2018-03-15),
suggesting that investors may be inclined to dip back into buying
assets perceived as risky, like stocks.
(END) Dow Jones Newswires
March 15, 2018 07:56 ET (11:56 GMT)
Copyright (c) 2018 Dow Jones & Company, Inc.
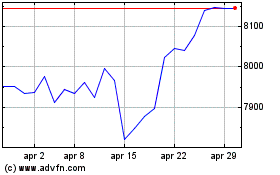
Grafico Indice FTSE 100
Da Mar 2024 a Apr 2024

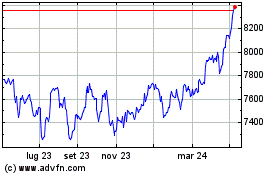
Grafico Indice FTSE 100
Da Apr 2023 a Apr 2024
