Ripple (XRP) Turned Sell On Rallies, BTC & ETH Dragging Market Lower
03 Gennaio 2020 - 5:28AM
NEWSBTC
Ripple is down more than 2% and it broke the $0.1880 support
against the US dollar. XRP price is now trading near the $0.1840
support area and it could correct higher. There is a key bearish
trend line forming with resistance near $0.1920 on the hourly chart
of the XRP/USD pair (data source from Kraken).... The post appeared
first on NewsBTC.
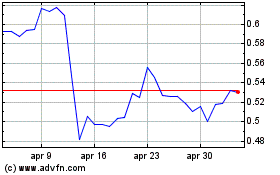
Grafico Azioni Ripple (COIN:XRPUSD)
Storico
Da Mar 2024 a Apr 2024

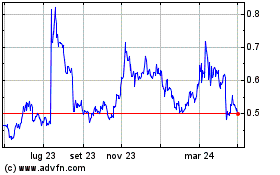
Grafico Azioni Ripple (COIN:XRPUSD)
Storico
Da Apr 2023 a Apr 2024
