Ethereum Bloodbath: Over $55 Million In Longs Liquidated As Price Plummets
31 Maggio 2024 - 2:00PM
NEWSBTC
The recent price action of Ethereum has not been so much of a
breeze. The second-largest cryptocurrency by market cap experienced
a surge that nearly reached its all-time high, only to be met with
a sharp reversal, leaving long traders licking their wounds.
Related Reading: Can DEX Boom Save Cardano? ADA Seeks Recovery As
Trading Activity Surges Bulls Take A Hit, But Sentiment Remains
Positive The past few days have seen a significant decline in
Ethereum’s price, dropping from $3,880 to around $3,735. This has
resulted in substantial liquidations for long traders, exceeding
$55 million in the last three days compared to only $16 million for
short positions. Despite the dip, technical indicators paint a
bullish picture. The price remains above the short moving average,
and the Relative Strength Index (RSI) sits comfortably above 60,
suggesting a strong underlying trend. The funding rate, which
reflects the cost of borrowing and lending cryptocurrency, provides
further evidence of bullish sentiment. It has remained positive,
currently at 0.014%, suggesting that buyers are still dominant and
expect the price to rise further. Open Interest Soars, Signaling
Sustained Investor Interest While the price has dipped, investor
interest in Ethereum remains robust. Open Interest, which reflects
the total amount of outstanding futures contracts, reached a peak
of $17 billion on May 28th, the highest level in over a year. This
indicates that despite the recent volatility, investors are still
heavily engaged with Ethereum and believe in its long-term
potential. Ethereum Price Forecast Meanwhile, Ethereum’s
current price prediction of $3,940 by June 30th suggests a
potential 2% increase. While the technical indicators remain
neutral, the high Fear & Greed Index of 73 indicates a
prevailing sense of greed among investors. This could fuel further
price movement in the short term. Looking at the recent
performance, Ethereum has experienced a moderate amount of
volatility with 57% green days over the past month. This suggests a
potential for continued upward momentum, especially considering the
significant price increase since the cycle low of $897. However,
it’s important to remember that the market is dynamic, and
corrections can occur even in bullish environments. Related
Reading: Political Memecoin Mania: Super Trump Token Explodes With
200% Surge Overall, the technical analysis paints a mixed picture
for Ethereum. While the neutral sentiment and recent price dip
might raise some concerns, the high Fear & Greed Index and
strong performance since the cycle low suggest potential for
further growth. Featured image from Pexels, chart from TradingView
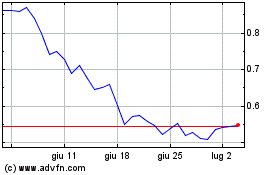
Grafico Azioni Mina (COIN:MINAUSD)
Storico
Da Mag 2024 a Giu 2024

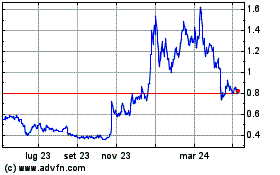
Grafico Azioni Mina (COIN:MINAUSD)
Storico
Da Giu 2023 a Giu 2024
