RNS Number:3229Z
Diageo PLC
22 February 2001

Part 2

DIAGEO CONSOLIDATED BALANCE SHEET 
 
                                                                              
                     31 December 2000    30 June 2000 31 December 1999
 
                            #       #       #       #       #       #         
                      million million million million million million         
         
  Fixed assets                                                                
  Intangible assets             5,419           5,289           4,975         
  Tangible assets               3,051           3,078           3,100         
  Investments                   1,578           1,496           1,442         
                                                                              
                               10,048           9,863           9,517         
                                                                              
  Current assets                                                              
  Stocks                2,208           2,139           2,153                 
  Debtors               3,728           3,071           3,732                 
  Cash at bank and      1,089           1,063           1,732                 
  in hand                                                                     
                        7,025           6,273           7,617                 
                                                                              
  Creditors - due                                                             
  within one year                                                             
  Borrowings           (3,336)          (3,066)          (4,095)              
  
  Other creditors      (3,592)          (3,275)          (3,758)              
  
          
                       (6,928)          (6,341)          (7,853)              
  
               
  Net current                      97             (68)           (236)        
 
  assets/(liabilities)                                                        

                                                                             
  Total assets less current    10,145           9,795           9,281         
  liabilities                                                                 
  Creditors - due                                                             
  after one year                                                              
  Borrowings           (3,626)          (3,716)          (3,553)              
  
  Other creditors        (127)            (100)            (150)              
   
                               (3,753)          (3,816)        (3,703)        

     
  Provisions for liabilities     (676)            (694)          (695)        
 
  and charges                                                                 
                                5,716            5,285          4,883         
                                                                              
  Capital and                                                                 
  reserves                                                                    
  Called up share                 986              990            989         
 
  capital                                                                     
  Reserves                      4,164            3,721          3,341         
  Shareholders'                 5,150            4,711          4,330         
  funds                                                                       
  Minority interests                                                          
  Equity                153             169             175                   
  Non-equity            413             405             378                   
                                  566             574             553         
 

                                5,716           5,285           4,883         
                                                                              
DIAGEO CONSOLIDATED CASH FLOW STATEMENT 


                                 Six months ended             Six months ended
                                 31 December 2000             31 December 1999
                           # million    # million    # million      # million 
  Net cash inflow from                       995                         929  
  operating activities                                                        
     
  Dividends received                          34                          40  
  from associates                                                             
  Interest paid                (204)                     (182)                
  (net)                                                                       
  Dividends paid to             (21)                      (16)                
  equity minority                                                             
  interests                                                                   
  Returns on                                (225)                       (198) 
  investments and                                                             
  servicing of                                                                
  finance                                                                     
  Taxation                                   (87)                        (78) 
  Purchase of                  (178)                     (252)                
  tangible fixed                                                              
  assets                                                                      
  Purchase of own               (67)                      (40)                
  shares (net)                                                                
  Sale of fixed                  21                        15                 
  assets                                                                      
  Capital                                   (224)                       (277) 
  expenditure and                                                             
  financial                                                                   
  investment                                                                  
  Free cash flow                             493                         416  
  Purchase of                   (97)                      (56)                
  subsidiaries                                                                
  Sale of                         -                       240                 
  subsidiaries and                                                            
  associates                                                                  
  Acquisitions and                           (97)                        184  
  disposals                                                                   
  Equity dividends                          (425)                       (398) 
  paid                                                                        
  Cash flow before                           (29)                        202  
  liquid resources                                                            
  and financing                                                               
  Management of                               56                        (244) 
  liquid resources                                                            
  Issue of share                 19                         6                 
  capital                                                                     
  Own shares                   (108)                      (54)                
  purchased for                                                               
  cancellation                                                                
  Increase in loans             189                       333                 
  Financing                                  100                         285  
  Increase in cash                           127                         243  
  in the period                                                               


MOVEMENTS IN NET BORROWINGS 


                                           Six months ended  Six months ended
                                           31 December 2000  31 December 1999 
                                                  # million         # million 
  Increase in cash in the                              127               243  
  period                                                                      
  Cash flow from increase in loans                    (189)             (333) 
  Change in liquid resources                           (56)              244  
  Change in net borrowings                            (118)              154  
  from cash flows                                                             
  Exchange adjustments                                 (55)              175  
  Non-cash items                                        16               (14) 
  (Increase)/decrease in net                          (157)              315  
  borrowings                                                                  
  Net borrowings at                                 (5,545)           (6,056) 
  beginning of the period                                                     
  Net borrowings at end of                          (5,702)           (5,741) 
  the period                                                                  

NOTES 
 
1.     Segmental analysis 

                                                                              
                                            2000                         1999 
                                       Operating                    Operating
                        Turnover          profit     Turnover          profit 
                       # million       # million    # million       # million 
  Class of                                                                    
  business:                                                                   
  Spirits and Wine         3,004             693       2,877             614  
  Beer                     1,060             141       1,195             161  
  
  Premium Drinks           4,064             834       4,072             775  
  Quick Service
  Restaurants                519              99         468             105  
  Packaged Food            2,259             302       2,056             271  
                                                                     
                           6,842           1,235       6,596           1,151  
  Geographical area                                                           
  by destination:                                                             
  Europe                   2,280             382       2,533             385  
  North America            3,334             582       3,000             539  
  Asia Pacific               536             114         449              80  
  Latin America              435              99         384              89  
  Rest of World              257              58         230              58  
                           6,842           1,235       6,596           1,151  
 
The above analysis of operating profit is before goodwill amortisation and
exceptional items. The geographical analysis is based on the location of the
third party customers.  
 
                                                                   
                                                 2000         1999 
                                            # million    # million 
              Net assets:                                          
              Spirits and Wine                 4,524        4,311  
              Beer                               783          874  
              Premium Drinks                   5,307        5,185  
              Quick Service Restaurants        1,370        1,194  
              Packaged Food                    3,883        3,415  

                                              10,560        9,794  
              Investments in associates        1,246        1,170  
              Tax, dividends and other          (388)        (340) 
              Net borrowings                  (5,702)      (5,741) 

                                               5,716        4,883  

              Europe                           3,911        3,753  
              North America                    5,921        5,301  
              Asia Pacific                       305          283  
              Latin America                      295          285  
              Rest of World                      128          172  
                                              10,560        9,794  
 
The weighted average exchange rates used in the translation of profit and
loss accounts were US dollar - #1=$1.46 (1999 - #1=$1.62) and euro - #1=1.65
(1999 - #1=1.55). Exchange rates used to translate assets and liabilities at
the balance sheet date were US dollar - #1=$1.49 (1999 - #1=$1.62) and euro -
#1=1.59 (1999 - #1=1.60). 

2.     Goodwill and exceptional items 


                                                   2000                  1999 
                     
                                           #          #          #          #
                                     million    million    million    million 
  Charged to:                                                                 
  Operating      Goodwill               (11)                   (7)            
  costs          amortisation                                                 
                 Merger                   -                   (45)            
                 integration                                                  
                 Guinness UDV            (8)                    -             
                 integration                                                  
                 Beer production         (5)                    -             
                 reorganisation                                               
                 Business               (25)                    -             
                 ownership                                                    
                 restructuring                                                
                 Burger King            (18)                  (34)            
                 items                                                        
                                                   (67)                  (86) 
  Disposal of                                                                 
  fixed assets   Gain/(loss) on                      6                    (2) 
                 sales                                                        
  Sale of        Spirits and Wine                    -                  (244) 
  businesses     brands                                                       
                                                   (61)                 (332) 
 
3.     Taxation 
 
The #287 million total taxation charge for the six months ended 31 December
2000 comprises UK tax of #1 million, foreign tax of #240 million and tax on
associates of #46 million. 
 
4.     Note of consolidated historical cost profits and losses 
 
There is no material difference between the reported profit shown in the
consolidated profit and loss account and the profit restated on an historical
cost basis. 
 
5.     Movements in consolidated shareholders' funds 

                                                                             
                                                           2000         1999 
                                                      # million    # million 
   Profit for the period                                   799          440  
   Dividends                                              (298)        (285) 
                                                           501          155  
   Exchange adjustments                                     27          (21) 
   Tax charge on exchange in reserves                        -           (4) 
   New share capital issued                                 19            6  
   Repurchase of own shares                               (108)         (54) 
   Goodwill on disposals of businesses                       -          222  
   Net movement in shareholders' funds                     439          304  
   Shareholders' funds at beginning of the period        4,711        4,026  
   Shareholders' funds at end of the period              5,150        4,330  
 
6.     Net borrowings 

                                                                              
                          31 December 2000    30 June 2000   31 December 1999 
                                 # million       # million          # million 
  Debt due within one              (3,336)         (3,066)            (4,095) 
  year and overdrafts                                                         
  Debt due after one               (3,626)         (3,716)            (3,553) 
  year                                                                        
  Net obligations                     (40)            (39)               (36) 
  under finance leases                                                        
                                   (7,002)         (6,821)            (7,684) 
                                    1,089           1,063              1,732  
  Interest rate and                   211             213                211  
  foreign currency                                                            
  swaps                                                                       
  Net borrowings                   (5,702)         (5,545)            (5,741) 
 
 
7.     Net cash inflow from operating activities 

                                                                           
                                                         2000         1999 
                                                    # million    # million 
      Operating profit                                 1,168        1,065  
      Exceptional operating costs                         56           79  
      Restructuring and integration payments             (87)         (91) 
      Depreciation and amortisation charge               197          187  
      Increase in working capital                       (331)        (315) 
      Other items                                         (8)           4  
      Net cash inflow from operating activities          995          929  
 
8.     Basis of preparation 
 
The interim financial information has been prepared on the basis of
accounting policies consistent with those applied in the accounts for the
year ended 30 June 2000. The information is unaudited but has been reviewed
by the auditors, KPMG Audit Plc, and their report is reproduced after these
notes. The information does not comprise the statutory accounts of the group.
The statutory accounts of Diageo plc for the year ended 30 June 2000 have
been filed with the registrar of companies. KPMG Audit Plc have reported on
these accounts; their report was unqualified and did not contain any
statement under section 237 of the Companies Act 1985. 
 
 
INDEPENDENT REVIEW REPORT TO DIAGEO plc 
Introduction 
 
We have been instructed by the company to review the interim financial
information set out on pages 13 to 18 and we have read the other information
contained in the interim report and considered whether it contains any
apparent misstatements or material inconsistencies with the financial
information. 
 
Directors' responsibilities 
 
The interim report, including the financial information contained therein, is
the responsibility of, and has been approved by, the directors. The Listing
Rules of the United Kingdom Listing Authority require that the accounting
policies and presentation applied to the interim figures should be consistent
with those applied in preparing annual accounts except where they are to be
changed in the next annual accounts in which case any changes, and the
reasons for them, are to be disclosed. 
 
Review work performed 
 
We conducted our review in accordance with guidance contained in Bulletin
1999/4: Review of Interim Financial Information issued by the Auditing
Practices Board. A review consists principally of making enquiries of group
management and applying analytical procedures to the financial information
and underlying financial data and, based thereon, assessing whether the
accounting policies and presentation have been consistently applied unless
otherwise disclosed. A review is substantially less in scope than an audit
performed in accordance with Auditing Standards and therefore provides a
lower level of assurance than an audit. Accordingly, we do not express an
audit opinion on the financial information. 
 
Review conclusion 
 
On the basis of our review we are not aware of any material modifications
that should be made to the financial information as presented for the six
months ended 31 December 2000. 
 
KPMG Audit Plc 
Chartered Accountants 
London, 21 February 2001 


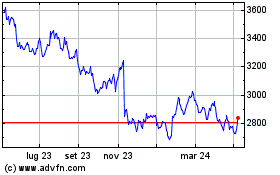
Grafico Azioni Diageo (LSE:DGE)
Storico
Da Giu 2024 a Lug 2024 Clicca qui per i Grafici di Diageo
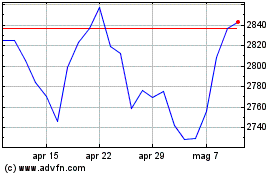
Grafico Azioni Diageo (LSE:DGE)
Storico
Da Lug 2023 a Lug 2024 Clicca qui per i Grafici di Diageo