Oaktree Specialty Lending Corp false 0001414932 0001414932 2023-11-14 2023-11-14
UNITED STATES
SECURITIES AND EXCHANGE COMMISSION
Washington, D.C. 20549
FORM 8-K
CURRENT REPORT
Pursuant to Section 13 or 15(d)
of The Securities Exchange Act of 1934
Date of Report (Date of earliest event reported): November 14, 2023
Oaktree Specialty Lending Corporation
(Exact name of registrant as specified in its charter)
|
|
|
|
|
| Delaware |
|
814-00755 |
|
26-1219283 |
| (State or other jurisdiction of incorporation) |
|
(Commission File Number) |
|
(IRS Employer
Identification No.) |
|
|
|
| 333 South Grand Avenue, 28th Floor Los Angeles, CA |
|
90071 |
| (Address of principal executive offices) |
|
(Zip Code) |
Registrant’s telephone number, including area code: (213) 830-6300
Not Applicable
(Former name or former address, if changed since last report)
Check the appropriate box below if the Form 8-K filing is intended to simultaneously satisfy the filing obligation of the registrant under any of the following provisions:
| |
☐ |
Written communications pursuant to Rule 425 under the Securities Act (17 CFR 230.425) |
| |
☐ |
Soliciting material pursuant to Rule 14a-12 under the Exchange Act (17 CFR 240.14a-12) |
| |
☐ |
Pre-commencement communications pursuant to Rule 14d-2(b) under the Exchange Act (17 CFR 240.14d-2(b)) |
| |
☐ |
Pre-commencement communications pursuant to Rule 13e-4(c) under the Exchange Act (17 CFR 240.13e-4(c)) |
Securities registered pursuant to Section 12(b) of the Act:
|
|
|
|
|
| Title of each class |
|
Trading
Symbol(s) |
|
Name of each exchange on which registered |
| Common stock, par value $0.01 per share |
|
OCSL |
|
The Nasdaq Stock Market LLC |
Indicate by check mark whether the registrant is an emerging growth company as defined in Rule 405 of the Securities Act of 1933 (17 CFR §230.405) or Rule 12b-2 of the Securities Exchange Act of 1934 (17 CFR §240.12b-2).
Emerging Growth Company ☐
If an emerging growth company, indicate by check mark if the registrant has elected not to use the extended transition period for complying with any new or revised financial accounting standards provided pursuant to Section 13(a) of the Exchange Act. ☐
Item 2.02. Results of Operations and Financial Condition.
On November 14, 2023, Oaktree Specialty Lending Corporation (the “Company”) issued a press release announcing its financial results for the fiscal quarter and year ended September 30, 2023. A copy of the press release is attached hereto as Exhibit 99.1.
On November 14, 2023, the Company will host a conference call to discuss its financial results for the fiscal quarter and year ended September 30, 2023. In connection therewith, the Company provided an investor presentation on its website at http://www.oaktreespecialtylending.com. A copy of the investor presentation is attached hereto as Exhibit 99.2.
The information disclosed under this Item 2.02, including Exhibits 99.1 and 99.2 hereto, is being “furnished” and is not deemed “filed” by the Company for purposes of Section 18 of the Securities Exchange Act of 1934, as amended (the “Exchange Act”), or otherwise subject to the liabilities of that Section, nor is it deemed incorporated by reference into any filing under the Securities Act of 1933, as amended, or the Exchange Act, except as shall be expressly set forth by specific reference in such filing.
Item 9.01. Financial Statements and Exhibits.
(d) Exhibits
SIGNATURE
Pursuant to the requirements of the Exchange Act, the registrant has duly caused this report to be signed on its behalf by the undersigned hereunto duly authorized.
|
|
|
|
|
|
|
|
|
|
|
OAKTREE SPECIALTY LENDING CORPORATION |
|
|
|
|
| Date: November 14, 2023 |
|
|
|
By: |
|
/s/ Christopher McKown |
|
|
|
|
|
|
Name: Christopher McKown Title: Chief Financial Officer and Treasurer |
Exhibit 99.1

Oaktree Specialty Lending Corporation Announces Fourth Fiscal Quarter and Full Year 2023
Financial Results and Declares Quarterly Distribution of $0.55 Per Share and Special
Distribution of $0.07 Per Share
LOS ANGELES, CA,
November 14, 2023 - Oaktree Specialty Lending Corporation (NASDAQ: OCSL) (“Oaktree Specialty Lending” or the “Company”), a specialty finance company, today announced its financial results for the fiscal quarter and year
ended September 30, 2023.
Financial Highlights for the Quarter and Year Ended September 30, 20231
| |
• |
|
Total investment income was $101.9 million ($1.32 per share) and $379.3 million ($5.26 per share) for the
fourth fiscal quarter and full year, as compared with $101.9 million ($1.32 per share) and $262.5 million ($4.32 per share) for the third fiscal quarter of 2023 and the full year of 2022. Adjusted total investment income was
$102.2 million ($1.32 per share) and $376.4 million ($5.22 per share) for fiscal quarter and full year ended September 30, 2023, as compared with $101.1 million ($1.31 per share) and $251.3 million ($4.14 per share) for the
third fiscal quarter of 2023 and the full year of 2022. The increase for the quarter was primarily driven by higher original issue discount (“OID”) acceleration from investment repayments, partially offset by lower fee income. The increase
for the full year was primarily driven by the impact of higher base rates on the Company’s floating rate debt portfolio and the growth of the investment portfolio from the assets acquired in the merger with Oaktree Strategic Income II, Inc.
(“OSI2”) (the “OSI2 Merger”). |
| |
• |
|
GAAP net investment income was $47.5 million ($0.62 per share) and $180.7 million ($2.51 per
share) for the fourth fiscal quarter and full year, as compared with $48.4 million ($0.63 per share) and $148.6 million ($2.45 per share) for the third fiscal quarter of 2023 and full year of 2022. The decrease for the quarter was
primarily driven by higher interest expense, partially offset by lower base management fees (net of waivers). The increase for the full year was primarily driven by higher adjusted total investment income, partially offset by higher interest
expense, incentive and base management fees, and other operating expenses. |
| |
• |
|
Adjusted net investment income was $47.8 million ($0.62 per share) and $177.8 million ($2.47
per share) for the fourth fiscal quarter and full year, as compared with $47.6 million ($0.62 per share) and $128.6 million ($2.12 per share) for the third fiscal quarter of 2023 and the full year of 2022. The increase for the full year
was primarily driven by higher adjusted total investment income, partially offset by higher interest expense, incentive and base management fees, and other operating expenses. |
| |
• |
|
Net asset value (“NAV”) per share was $19.63 as of September 30, 2023, up slightly as compared with
$19.58 as of June 30, 2023 and down from $20.38 as of September 30, 2022. The increase from June 30, 2023 was mainly the result of undistributed net investment income. The decline from September 30, 2022 primarily reflected
credit spread widening on debt investments that drove unrealized losses on certain investments and the impact of the December 2022 special distribution. |
| |
• |
|
Originated $87.5 million of new investment commitments and received $364.4 million of proceeds from
prepayments, exits, other paydowns and sales during the quarter ended September 30, 2023. The weighted average yield on new debt investments was 12.0%. |
| |
• |
|
Total debt outstanding was $1,660.0 million as of September 30, 2023. The total debt to equity ratio was
1.10x, and the net debt to equity ratio was 1.01x, after adjusting for cash and cash equivalents. |
| |
• |
|
The Company issued $300 million of unsecured notes during the quarter ended September 30,
2023 that mature on February 15, 2029 and bear interest at a rate of 7.100%. In connection with the issuance of the 2027 Notes, the Company entered into an interest rate swap agreement under which the Company receives a fixed interest rate of
7.100% and pays a floating rate of the three-month SOFR plus 3.1255% on a notional amount of $300 million. |
| |
• |
|
Liquidity as of September 30, 2023 was composed of $136.5 million of unrestricted cash and cash
equivalents and $907.5 million of undrawn capacity under the Company’s credit facilities (subject to borrowing base and other limitations). Unfunded investment commitments were $232.7 million, or $205.6 million excluding unfunded
commitments to the Company’s joint ventures. Of the $205.6 million, approximately $154.2 million can be drawn immediately with the remaining amount subject to certain milestones that must be met by portfolio companies or other
restrictions. |
| 1 |
The Company completed a 1-for-3 reverse
stock split on January 20, 2023, effective as of the commencement of trading on January 23, 2023. All share amounts and per share information included in this press release reflect the reverse stock split on a retroactive basis
|
1
| |
• |
|
A quarterly cash distribution was declared of $0.55 per share. The distribution is payable in cash on
December 29, 2023 to stockholders of record on December 15, 2023. |
| |
• |
|
A special cash distributions was declared of $0.07 per share. The distribution is payable in cash on
December 29, 2023 to stockholders of record on December 15, 2023.. |
Armen Panossian, Chief Executive Officer and Chief Investment
Officer, said, “We delivered solid fourth quarter results, culminating a fiscal year defined by strong earnings growth and attractive new deployment activity. We produced record adjusted net investment income for the year, driven by higher base
rates that highlighted the power of our predominantly floating rate loan portfolio, as well as our ability to deploy capital at wider spreads. This enabled us to generate an ROE of over 12% for the year.”
“Additionally, our merger with Oaktree Strategic Income II, Inc. contributed to our record results. The transaction, which closed in January and proved accretive
to earnings, created greater scale and financial flexibility that we believe will drive continued positive investment performance. We also strengthened our capital structure in August through the issuance of $300 million of notes due 2029,
creating additional flexibility and increased investment capacity that positions OCSL to prudently pursue new investment opportunities and favorable returns for our shareholders.”
Distribution Declaration
The Board of Directors declared quarterly and
special distributions of $0.55 per share and $0.07 per share, respectively. The distributions are payable in cash on December 29, 2023 to stockholders of record on December 15, 2023.
Distributions are paid primarily from distributable (taxable) income. To the extent taxable earnings for a fiscal taxable year fall below the total amount of
distributions for that fiscal year, a portion of those distributions may be deemed a return of capital to the Company’s stockholders.
2
Results of Operations
|
|
|
|
|
|
|
|
|
|
|
|
|
|
|
|
|
|
|
|
|
| |
|
|
|
|
|
|
|
|
|
| |
|
For the three months ended |
|
|
For the year ended |
|
| ($ in thousands, except per share data) |
|
September 30,
2023
(unaudited) |
|
|
June 30, 2023
(unaudited) |
|
|
September 30,
2022
(unaudited) |
|
|
September 30,
2023 |
|
|
September 30,
2022 |
|
| GAAP operating results: |
|
|
|
|
|
|
|
|
|
|
|
|
|
|
|
|
|
|
|
|
| Interest income |
|
$ |
94,732 |
|
|
$ |
95,310 |
|
|
$ |
61,719 |
|
|
$ |
348,765 |
|
|
$ |
228,916 |
|
| PIK interest income |
|
|
5,544 |
|
|
|
3,967 |
|
|
|
6,011 |
|
|
|
19,764 |
|
|
|
20,526 |
|
| Fee income |
|
|
572 |
|
|
|
1,573 |
|
|
|
1,539 |
|
|
|
6,546 |
|
|
|
6,631 |
|
| Dividend income |
|
|
1,057 |
|
|
|
1,050 |
|
|
|
875 |
|
|
|
4,211 |
|
|
|
6,447 |
|
|
|
|
|
|
|
|
|
|
|
|
|
|
|
|
|
|
|
|
|
|
| Total investment income |
|
|
101,905 |
|
|
|
101,900 |
|
|
|
70,144 |
|
|
|
379,286 |
|
|
|
262,520 |
|
| Net expenses |
|
|
54,407 |
|
|
|
53,487 |
|
|
|
34,286 |
|
|
|
198,511 |
|
|
|
110,591 |
|
| (Provision) benefit for taxes on net investment income |
|
|
— |
|
|
|
— |
|
|
|
— |
|
|
|
— |
|
|
|
(3,308 |
) |
| Excise tax |
|
|
— |
|
|
|
— |
|
|
|
— |
|
|
|
(78 |
) |
|
|
— |
|
|
|
|
|
|
|
|
|
|
|
|
|
|
|
|
|
|
|
|
|
|
| Net investment income |
|
|
47,498 |
|
|
|
48,413 |
|
|
|
35,858 |
|
|
|
180,697 |
|
|
|
148,621 |
|
|
|
|
|
|
|
|
|
|
|
|
|
|
|
|
|
|
|
|
|
|
| Net realized and unrealized gains (losses), net of taxes |
|
|
(1,546 |
) |
|
|
(11,728 |
) |
|
|
(22,650 |
) |
|
|
(63,366 |
) |
|
|
(119,398 |
) |
|
|
|
|
|
|
|
|
|
|
|
|
|
|
|
|
|
|
|
|
|
| Net increase (decrease) in net assets resulting from operations |
|
$ |
45,952 |
|
|
$ |
36,685 |
|
|
$ |
13,208 |
|
|
$ |
117,331 |
|
|
$ |
29,223 |
|
|
|
|
|
|
|
|
|
|
|
|
|
|
|
|
|
|
|
|
|
|
| Total investment income per common share |
|
$ |
1.32 |
|
|
$ |
1.32 |
|
|
$ |
1.15 |
|
|
$ |
5.26 |
|
|
$ |
4.32 |
|
| Net investment income per common share |
|
$ |
0.62 |
|
|
$ |
0.63 |
|
|
$ |
0.59 |
|
|
$ |
2.51 |
|
|
$ |
2.45 |
|
| Net realized and unrealized gains (losses), net of taxes per common share |
|
$ |
(0.02 |
) |
|
$ |
(0.15 |
) |
|
$ |
(0.37 |
) |
|
$ |
(0.88 |
) |
|
$ |
(1.97 |
) |
| Earnings (loss) per common share — basic and diluted |
|
$ |
0.60 |
|
|
$ |
0.48 |
|
|
$ |
0.22 |
|
|
$ |
1.63 |
|
|
$ |
0.48 |
|
| Non-GAAP Financial Measures1: |
|
|
|
|
|
|
|
|
|
|
|
|
|
|
|
|
|
|
|
|
| Adjusted total investment income |
|
$ |
102,157 |
|
|
$ |
101,058 |
|
|
$ |
67,971 |
|
|
$ |
376,389 |
|
|
$ |
251,303 |
|
| Adjusted net investment income |
|
$ |
47,750 |
|
|
$ |
47,571 |
|
|
$ |
33,685 |
|
|
$ |
177,800 |
|
|
$ |
128,613 |
|
| Adjusted net realized and unrealized gains (losses), net of taxes |
|
$ |
(1,668 |
) |
|
$ |
(11,116 |
) |
|
$ |
(20,477 |
) |
|
$ |
(40,175 |
) |
|
$ |
(108,183 |
) |
| Adjusted earnings (loss) |
|
$ |
46,082 |
|
|
$ |
36,455 |
|
|
$ |
13,208 |
|
|
$ |
137,625 |
|
|
$ |
29,221 |
|
| Adjusted total investment income per share |
|
$ |
1.32 |
|
|
$ |
1.31 |
|
|
$ |
1.11 |
|
|
$ |
5.22 |
|
|
$ |
4.14 |
|
| Adjusted net investment income per share |
|
$ |
0.62 |
|
|
$ |
0.62 |
|
|
$ |
0.55 |
|
|
$ |
2.47 |
|
|
$ |
2.12 |
|
| Adjusted net realized and unrealized gains (losses), net of taxes per Share |
|
$ |
(0.02 |
) |
|
$ |
(0.14 |
) |
|
$ |
(0.34 |
) |
|
$ |
(0.56 |
) |
|
$ |
(1.78 |
) |
| Adjusted earnings (loss) per share |
|
$ |
0.60 |
|
|
$ |
0.47 |
|
|
$ |
0.22 |
|
|
$ |
1.91 |
|
|
$ |
0.48 |
|
1 See Non-GAAP Financial Measures below for a description of the non-GAAP measures and the reconciliations from
the most comparable GAAP financial measures to the Company’s non-GAAP measures, including on a per share basis. The Company’s management uses these non-GAAP
financial measures internally to analyze and evaluate financial results and performance and believes that these non-GAAP financial measures are useful to investors as an additional tool to evaluate ongoing
results and trends for the Company and to review the Company’s performance without giving effect to non-cash income/gain/loss resulting from the merger of Oaktree Strategic Income Corporation
(“OCSI”) with and into the Company in March 2021 (the “OCSI Merger”) and the OSI2 Merger and, in the case of adjusted net investment income, without giving effect to capital gains incentive fees. The presentation of non-GAAP measures is not intended to be a substitute for financial results prepared in accordance with GAAP and should not be considered in isolation.
|
|
|
|
|
|
|
|
|
|
|
|
|
| |
|
|
|
| |
|
As of |
|
| ($ in thousands, except per share data and ratios) |
|
September 30, 2023 |
|
|
June 30, 2023
(unaudited) |
|
|
September 30, 2022 |
|
| Select balance sheet and other data: |
|
|
|
|
|
|
|
|
|
|
|
|
| Cash and cash equivalents |
|
$ |
136,450 |
|
|
$ |
59,704 |
|
|
$ |
23,528 |
|
| Investment portfolio at fair value |
|
|
2,892,420 |
|
|
|
3,135,619 |
|
|
|
2,494,111 |
|
| Total debt outstanding (net of unamortized financing costs) |
|
|
1,600,731 |
|
|
|
1,740,066 |
|
|
|
1,301,043 |
|
| Net assets |
|
|
1,515,764 |
|
|
|
1,509,441 |
|
|
|
1,245,563 |
|
| Net asset value per share |
|
|
19.63 |
|
|
|
19.58 |
|
|
|
20.38 |
|
| Total debt to equity ratio |
|
|
1.10x |
|
|
|
1.18x |
|
|
|
1.08x |
|
| Net debt to equity ratio |
|
|
1.01x |
|
|
|
1.14x |
|
|
|
1.06x |
|
Adjusted total investment income for the quarter ended September 30, 2023 was $102.2 million and included $95.0 million
of interest income from portfolio investments, $5.5 million of payment-in-kind (“PIK”) interest income, $0.6 million of fee income and
$1.1 million of dividend income. The $1.1 million sequential increase in adjusted total investment income was attributable to a $2.1 million increase in interest income mainly due to higher OID acceleration from exited investments,
partially offset by a $1.0 million decrease in fee income mainly driven by lower commitment and exit fees.
Adjusted total investment income for the full year
ended September 30, 2023 was $376.4 million and included $345.9 million of interest income from portfolio investments, $19.8 million of PIK interest income, $6.5 million of fee income and $4.2 million of dividend
income. The $125.1 million year-over-year increase was primarily driven by $127.4 million of higher interest income principally due to the growth in the size of the investment portfolio following the merger with OSI2 as well as the impact
of higher base rates on the Company’s floating rate debt portfolio. This was partially offset by $2.2 million of lower dividend income.
3
Net expenses for the quarter ended September 30, 2023 totaled $54.4 million, up $0.9 million from the
quarter ended June 30, 2023. The increase in net expenses was primarily driven by $1.5 million of higher interest expense due to the impact of rising interest rates on the Company’s floating rate liabilities. This was partially offset
by a $0.5 million decrease in base management fees during the quarter due to a decrease in the size of the investment portfolio.
Net expenses for full-year
ended September 30, 2023 totaled $198.5 million, up $87.9 million from the year ended September 30, 2022. The increase was primarily driven by $64.7 million of higher interest expense due to the impact of rising interest
rates on the Company’s floating rate liabilities and an increase in average borrowings outstanding. Further contributing to the increase were $9.2 million of higher part I incentive fees as a result of higher adjusted net investment income
during the year, an $8.8 million reversal of previously accrued capital gains incentive fees in the prior year, $2.8 million of higher management fees (net of waivers) as a result of a larger investment portfolio and a $2.4 million
increase professional fees and general and administrative expenses during the year.
Adjusted net investment income was $47.8 million ($0.62 per share) for the
quarter ended September 30, 2023, up slightly from $47.6 million ($0.62 per share) for the quarter ended June 30, 2023. The increase of $0.2 million primarily reflected $1.1 million of higher adjusted total investment
income, partially offset by $0.9 million of higher net expenses.
Adjusted net investment income was $177.8 million ($2.47 per share) for the full year
2023, up from $128.6 million ($2.12 per share) for the year ended September 30, 2022. The increase of $49.2 million primarily reflected $125.1 million of higher adjusted total investment income and a $3.3 million decrease in
the provision for income taxes on net investment income, partially offset by $64.7 million of higher interest expense, $9.2 million of higher part I incentive fees, $2.8 million of higher management fees (net of waivers) and a
$2.4 million increase in professional fees and general and administrative expenses during the year.
Adjusted net realized and unrealized losses, net of taxes,
was $1.7 million for the quarter ended September 30, 2023, primarily reflecting the impact of the provision for income taxes. Adjusted net realized and unrealized losses, net of taxes, was $40.2 million for the year ended
September 30, 2023, primarily reflecting realized and unrealized losses on certain debt and equity investments.
4
Portfolio and Investment Activity
|
|
|
|
|
|
|
|
|
|
|
|
|
| |
|
|
|
| |
|
As of |
|
|
|
|
|
| ($ in thousands) |
|
September 30, 2023
(unaudited) |
|
|
June 30, 2023
(unaudited) |
|
|
September 30, 2022
(unaudited) |
|
| Investments at fair value |
|
$ |
2,892,420 |
|
|
$ |
3,135,619 |
|
|
$ |
2,494,111 |
|
| Number of portfolio companies |
|
|
143 |
|
|
|
156 |
|
|
|
149 |
|
| Average portfolio company debt size |
|
$ |
19,800 |
|
|
$ |
19,800 |
|
|
$ |
16,500 |
|
|
|
|
|
|
|
|
|
|
|
|
|
|
| Asset class: |
|
|
|
|
|
|
|
|
|
|
|
|
| Senior secured debt |
|
|
86.5 |
% |
|
|
88.5 |
% |
|
|
86.9 |
% |
| Unsecured debt |
|
|
1.9 |
% |
|
|
1.7 |
% |
|
|
2.3 |
% |
| Equity |
|
|
5.0 |
% |
|
|
3.8 |
% |
|
|
4.2 |
% |
| JV interests |
|
|
6.6 |
% |
|
|
6.0 |
% |
|
|
6.7 |
% |
|
|
|
|
|
|
|
|
|
|
|
|
|
| Non-accrual debt investments: |
|
|
|
|
|
|
|
|
|
|
|
|
| Non-accrual investments at fair value |
|
$ |
48,743 |
|
|
$ |
91,152 |
|
|
$ |
— |
|
| Non-accrual investments as a percentage of debt investments at fair
value |
|
|
1.8 |
% |
|
|
3.1 |
% |
|
|
— |
% |
| Non-accrual investments as a percentage of debt investments at
cost |
|
|
2.4 |
% |
|
|
3.6 |
% |
|
|
— |
% |
| Number of investments on non-accrual |
|
|
4 |
|
|
|
5 |
|
|
|
— |
|
|
|
|
|
|
|
|
|
|
|
|
|
|
| Interest rate type: |
|
|
|
|
|
|
|
|
|
|
|
|
| Percentage floating-rate |
|
|
86.2 |
% |
|
|
86.0 |
% |
|
|
86.5 |
% |
| Percentage fixed-rate |
|
|
13.8 |
% |
|
|
14.0 |
% |
|
|
13.5 |
% |
|
|
|
|
|
|
|
|
|
|
|
|
|
| Yields: |
|
|
|
|
|
|
|
|
|
|
|
|
| Weighted average yield on debt investments1 |
|
|
12.7 |
% |
|
|
12.3 |
% |
|
|
10.6 |
% |
| Cash component of weighted average yield on debt investments |
|
|
11.2 |
% |
|
|
11.4 |
% |
|
|
9.3 |
% |
| Weighted average yield on total portfolio
investments2 |
|
|
12.0 |
% |
|
|
11.8 |
% |
|
|
10.2 |
% |
|
|
|
|
|
|
|
|
|
|
|
|
|
| Investment activity: |
|
|
|
|
|
|
|
|
|
|
|
|
| New investment commitments |
|
$ |
87,500 |
|
|
$ |
251,000 |
|
|
$ |
97,000 |
|
| New funded investment activity3 |
|
$ |
117,100 |
|
|
$ |
243,300 |
|
|
$ |
84,500 |
|
| Proceeds from prepayments, exits, other paydowns and sales |
|
$ |
364,400 |
|
|
$ |
261,000 |
|
|
$ |
146,100 |
|
| Net new investments4 |
|
$ |
(247,300 |
) |
|
$ |
(17,700 |
) |
|
$ |
(61,600 |
) |
| Number of new investment commitments in new portfolio companies |
|
|
3 |
|
|
|
6 |
|
|
|
6 |
|
| Number of new investment commitments in existing portfolio companies |
|
|
3 |
|
|
|
4 |
|
|
|
5 |
|
| Number of portfolio company exits |
|
|
16 |
|
|
|
16 |
|
|
|
8 |
|
| 1 |
Annual stated yield earned plus net annual amortization of OID or premium earned on accruing investments, including the
Company’s share of the return on debt investments in SLF JV I and Glick JV, and excluding any amortization or accretion of interest income resulting solely from the cost basis established by ASC 805 (see
Non-GAAP Financial Measures below) for the assets acquired in connection with the OCSI Merger and OSI2 Merger. |
| 2 |
Annual stated yield earned plus net annual amortization of OID or premium earned on accruing investments and dividend
income, including the Company’s share of the return on debt investments in SLF JV I and Glick JV, and excluding any amortization or accretion of interest income resulting solely from the cost basis established by ASC 805 for the assets acquired
in connection with the OCSI Merger and OSI2 Merger. |
| 3 |
New funded investment activity includes drawdowns on existing revolver and delayed draw term loan commitments.
|
| 4 |
Net new investments consists of new funded investment activity less proceeds from prepayments, exits, other paydowns and
sales. |
As of September 30, 2023, the fair value of the investment portfolio was $2.9 billion and was composed of investments in 143
companies. These included debt investments in 129 companies, equity investments in 42 companies, and the Company’s joint venture investments in SLF JV I LLC (“SLF JV I”) and OCSI Glick JV LLC (“Glick JV”). 30 of the equity
investments were in companies in which the Company also had a debt investment.
As of September 30, 2023, 94.0% of the Company’s portfolio at fair value
consisted of debt investments, including 76.4% of first lien loans, 10.1% of second lien loans and 7.5% of unsecured debt investments, including the debt investments in SLF JV I and Glick JV. This compared to 76.5% of first lien loans, 12.0% of
second lien loans and 6.8% of unsecured debt investments, including the debt investments in SLF JV I and Glick JV, as of June 30, 2023.
As of
September 30, 2023, there were four investments on non-accrual status, which represented 2.4% and 1.8% of the debt portfolio at cost and fair value, respectively. This is down from five investments on non-accrual status in the prior quarter, which represented 3.6% and 3.1% of the debt portfolio at cost and fair value, respectively.
5
SLF JV I
The
Company’s investments in SLF JV I totaled $141.5 million at fair value as of September 30, 2023, up 1% from $140.6 million as of June 30, 2023. The increase was primarily driven by SLF JV I’s use of leverage and
unrealized appreciation in the underlying investment portfolio.
As of September 30, 2023, SLF JV I had $376.1 million in assets, including senior secured
loans to 48 portfolio companies. This compared to $370.2 million in assets, including senior secured loans to 52 portfolio companies, as of June 30, 2023. As of September 30, 2023, no investments held by SLF JV I were on non-accrual status. SLF JV I generated cash interest income of $3.5 million for the Company during the quarter ended September 30, 2023, up from $3.4 million in the prior quarter. In addition, SLF JV
I generated dividend income of $1.1 million for the Company during the quarter ended September 30, 2023, flat as compared to the prior quarter. As of September 30, 2023, SLF JV I had $121.0 million of undrawn capacity (subject to
borrowing base and other limitations) on its $270 million senior revolving credit facility, and its debt to equity ratio was 1.2x.
Glick JV
The Company’s investments in Glick JV totaled $50.0 million at fair value as of September 30, 2023, up 1% from $49.6 million as of June 30,
2023. The increase was primarily driven by Glick JV I’s use of leverage and unrealized appreciation in the underlying investment portfolio.
As of
September 30, 2023, Glick JV had $141.2 million in assets, including senior secured loans to 38 portfolio companies. This compared to $126.8 million in assets, including senior secured loans to 37 portfolio companies, as of
June 30, 2023. As of September 30, 2023, no investments held by Glick JV were on non-accrual status. Glick JV generated cash interest income of $1.5 million during the quarter ended
September 30, 2023, up as compared to $1.4 million in the prior quarter. As of September 30, 2023, Glick JV had $27.0 million of undrawn capacity (subject to borrowing base and other limitations) on its $80 million senior
revolving credit facility, and its debt to equity ratio was 1.2x.
Liquidity and Capital Resources
As of September 30, 2023, the Company had total principal value of debt outstanding of $1,660.0 million, including $710.0 million of outstanding
borrowings under its revolving credit facilities, $300.0 million of the 3.500% Notes due 2025, $350.0 million of the 2.700% Notes due 2027 and $300.0 million of the 7.100% Notes due 2029. The funding mix was composed of 43% secured
and 57% unsecured borrowings as of September 30, 2023. The Company was in compliance with all financial covenants under its credit facilities as of September 30, 2023.
On August 15, 2023, the Company issued $300.0 million in aggregate principal amount of the 2029 Notes for net proceeds of $292.9 million after deducting
OID of $3.5 million, underwriting commissions and discounts of $3.0 million and offering costs of $0.6 million. Interest on the 2029 Notes is paid semi-annually on February 15 and August 15 at a rate of 7.100% per annum. In
connection with the issuance of the 2029 Notes, the Company entered into an interest rate swap agreement under which the Company receives a fixed interest rate of 7.100% and pays a floating rate of the three-month SOFR plus 3.1255% on a notional
amount of $300 million.
As of September 30, 2023, the Company had $136.5 million of unrestricted cash and cash equivalents and $907.5 million
of undrawn capacity on its credit facilities (subject to borrowing base and other limitations). As of September 30, 2023, unfunded investment commitments were $232.7 million, or $205.6 million excluding unfunded commitments to the
Company’s joint ventures. Of the $205.6 million, approximately $154.2 million could be drawn immediately with the remaining amount subject to certain milestones that must be met by portfolio companies. The Company has analyzed cash
and cash equivalents, availability under its credit facilities, the ability to rotate out of certain assets and amounts of unfunded commitments that could be drawn and believes its liquidity and capital resources are sufficient to take advantage of
market opportunities in the current economic climate.
As of September 30, 2023, the weighted average interest rate on debt outstanding, including the effect
of the interest rate swap agreement, was 7.0%, up from 6.6% as of June 30, 2023, primarily driven by the impact of higher interest rates on the Company’s floating rate liabilities and the issuance of the 2029 Notes.
The Company’s total debt to equity ratio was 1.10x and 1.18x as of September 30, 2023 and June 30, 2023, respectively. The Company’s net debt to
equity ratio was 1.01x and 1.14x as of September 30, 2023 and June 30, 2023, respectively.
6
Non-GAAP Financial Measures
On a supplemental basis, the Company is disclosing certain adjusted financial measures, each of which is calculated and presented on a basis of methodology other than
in accordance with GAAP (“non-GAAP”). The Company’s management uses these non-GAAP financial measures internally to analyze and evaluate financial results
and performance and believes that these non-GAAP financial measures are useful to investors as an additional tool to evaluate ongoing results and trends for the Company and to review the Company’s
performance without giving effect to non-cash income/gain/loss resulting from the OCSI Merger and the OSI2 Merger and in the case of adjusted net investment income, without giving effect to capital gains
incentive fees. The presentation of the below non-GAAP measures is not intended to be a substitute for financial results prepared in accordance with GAAP and should not be considered in isolation.
| |
• |
|
“Adjusted Total Investment Income” and “Adjusted Total Investment Income Per Share” –
represents total investment income excluding any amortization or accretion of interest income resulting solely from the cost basis established by ASC 805 (see below) for the assets acquired in connection with the OCSI Merger and the OSI2 Merger.
|
| |
• |
|
“Adjusted Net Investment Income” and “Adjusted Net Investment Income Per Share” –
represents net investment income, excluding (i) any amortization or accretion of interest income resulting solely from the cost basis established by ASC 805 (see below) for the assets acquired in connection with the OCSI Merger and the OSI2
Merger and (ii) capital gains incentive fees (“Part II incentive fees”). |
| |
• |
|
“Adjusted Net Realized and Unrealized Gains (Losses), Net of Taxes” and “Adjusted Net Realized and
Unrealized Gains (Losses), Net of Taxes Per Share” – represents net realized and unrealized gains (losses) net of taxes excluding any net realized and unrealized gains (losses) resulting solely from the cost basis established by ASC
805 (see below) for the assets acquired in connection with the OCSI Merger and the OSI2 Merger. |
| |
• |
|
“Adjusted Earnings (Loss)” and “Adjusted Earnings (Loss) Per Share” – represents the sum of
(i) Adjusted Net Investment Income and (ii) Adjusted Net Realized and Unrealized Gains (Losses), Net of Taxes and includes the impact of Part II incentive fees1, if any.
|
The OCSI Merger and the OSI2 Merger (the “Mergers”) were accounted for as asset acquisitions in accordance with the asset acquisition
method of accounting as detailed in ASC 805-50, Business Combinations—Related Issues (“ASC 805”). The consideration paid to each of the stockholders of OCSI and OSI2 were allocated to the
individual assets acquired and liabilities assumed based on the relative fair values of the net identifiable assets acquired other than “non-qualifying” assets, which established a new cost basis for
the acquired investments under ASC 805 that, in aggregate, was different than the historical cost basis of the acquired investments prior to the OCSI Merger or the OSI2 Merger, as applicable. Additionally, immediately following the completion of the
Mergers, the acquired investments were marked to their respective fair values under ASC 820, Fair Value Measurements, which resulted in unrealized appreciation/depreciation. The new cost basis established by ASC 805 on debt investments
acquired will accrete/amortize over the life of each respective debt investment through interest income, with a corresponding adjustment recorded to unrealized appreciation/depreciation on such investment acquired through its ultimate disposition.
The new cost basis established by ASC 805 on equity investments acquired will not accrete/amortize over the life of such investments through interest income and, assuming no subsequent change to the fair value of the equity investments acquired and
disposition of such equity investments at fair value, the Company will recognize a realized gain/loss with a corresponding reversal of the unrealized appreciation/depreciation on disposition of such equity investments acquired.
The Company’s management uses the non-GAAP financial measures described above internally to analyze and evaluate financial
results and performance and to compare its financial results with those of other business development companies that have not adjusted the cost basis of certain investments pursuant to ASC 805. The Company’s management believes “Adjusted
Total Investment Income”, “Adjusted Total Investment Income Per Share”, “Adjusted Net Investment Income” and “Adjusted Net Investment Income Per Share” are useful to investors as an additional tool to evaluate
ongoing results and trends for the Company without giving effect to the income resulting from the new cost basis of the investments acquired in the Mergers because these amounts do not impact the fees payable to Oaktree Fund Advisors, LLC (the
“Adviser”) under its second amended and restated advisory agreement (the “A&R Advisory Agreement”), and specifically as its relates to “Adjusted Net Investment Income” and “Adjusted Net Investment Income Per
Share”, without giving effect to Part II incentive fees. In addition, the Company’s management believes that “Adjusted Net Realized and Unrealized Gains (Losses), Net of Taxes”, “Adjusted Net Realized and Unrealized Gains
(Losses), Net of Taxes Per Share”, “Adjusted Earnings (Loss)” and “Adjusted Earnings (Loss) Per Share” are useful to investors as they exclude the non-cash income and gain/loss
resulting from the Mergers and are used by management to evaluate the economic earnings of its investment portfolio. Moreover,
1 Adjusted earnings (loss) includes accrued Part II incentive fees. As of and for the three months and year ended
September 30, 2023, there was no accrued Part II incentive fee liability. Part II incentive fees are contractually calculated and paid at the end of the fiscal year in accordance with the A&R Advisory Agreement, which differs from Part II
incentive fees accrued under GAAP. For the year ended September 30, 2023, no amounts were payable under the A&R Advisory Agreement.
7
these metrics more closely align the Company’s key financial measures with the calculation of incentive fees payable to the Adviser under with the A&R Advisory Agreement (i.e., excluding
amounts resulting solely from the lower cost basis of the acquired investments established by ASC 805 that would have been to the benefit of the Adviser absent such exclusion).
The following table provides a reconciliation of total investment income (the most comparable U.S. GAAP measure) to adjusted total investment income for the periods
presented:
|
|
|
|
|
|
|
|
|
|
|
|
|
|
|
|
|
|
|
|
|
|
|
|
|
|
|
|
|
|
|
|
|
|
|
|
|
|
|
|
|
| |
|
For the three months ended |
|
|
For the year ended |
|
| |
|
September 30, 2023
(unaudited) |
|
|
June 30, 2023
(unaudited) |
|
|
September 30, 2022
(unaudited) |
|
|
September 30, 2023 |
|
|
September 30, 2022 |
|
| ($ in thousands, except per share data) |
|
Amount |
|
|
Per Share |
|
|
Amount |
|
|
Per Share |
|
|
Amount |
|
|
Per Share |
|
|
Amount |
|
|
Per Share |
|
|
Amount |
|
|
Per Share |
|
| GAAP total investment income |
|
$ |
101,905 |
|
|
$ |
1.32 |
|
|
$ |
101,900 |
|
|
$ |
1.32 |
|
|
$ |
70,144 |
|
|
$ |
1.15 |
|
|
$ |
379,286 |
|
|
$ |
5.26 |
|
|
$ |
262,520 |
|
|
$ |
4.32 |
|
| Less: Interest income accretion related to merger accounting adjustments |
|
|
252 |
|
|
|
— |
|
|
|
(842) |
|
|
|
(0.01) |
|
|
|
(2,173) |
|
|
|
(0.04) |
|
|
|
(2,897) |
|
|
|
(0.04) |
|
|
|
(11,217) |
|
|
|
(0.18) |
|
|
|
|
|
|
|
|
|
|
|
|
|
|
|
|
|
|
|
|
|
|
|
|
|
|
|
|
|
|
|
|
|
|
|
|
|
|
|
|
|
|
| Adjusted total investment income |
|
$ |
102,157 |
|
|
$ |
1.32 |
|
|
$ |
101,058 |
|
|
$ |
1.31 |
|
|
$ |
67,971 |
|
|
$ |
1.11 |
|
|
$ |
376,389 |
|
|
$ |
5.22 |
|
|
$ |
251,303 |
|
|
$ |
4.14 |
|
|
|
|
|
|
|
|
|
|
|
|
|
|
|
|
|
|
|
|
|
|
|
|
|
|
|
|
|
|
|
|
|
|
|
|
|
|
|
|
|
|
The following table provides a reconciliation of net investment income (the most comparable U.S. GAAP measure) to adjusted net
investment income for the periods presented:
|
|
|
|
|
|
|
|
|
|
|
|
|
|
|
|
|
|
|
|
|
|
|
|
|
|
|
|
|
|
|
|
|
|
|
|
|
|
|
|
|
| |
|
For the three months ended |
|
|
For the year ended |
|
| |
|
September 30, 2023
(unaudited) |
|
|
June 30, 2023
(unaudited) |
|
|
September 30, 2022
(unaudited) |
|
|
September 30, 2023 |
|
|
September 30, 2022 |
|
| ($ in thousands, except per share data) |
|
Amount |
|
|
Per Share |
|
|
Amount |
|
|
Per Share |
|
|
Amount |
|
|
Per Share |
|
|
Amount |
|
|
Per Share |
|
|
Amount |
|
|
Per Share |
|
| GAAP net investment income |
|
$ |
47,498 |
|
|
$ |
0.62 |
|
|
$ |
48,413 |
|
|
$ |
0.63 |
|
|
$ |
35,858 |
|
|
$ |
0.59 |
|
|
$ |
180,697 |
|
|
$ |
2.51 |
|
|
$ |
148,621 |
|
|
$ |
2.45 |
|
| Less: Interest income accretion related to merger accounting adjustments |
|
|
252 |
|
|
|
— |
|
|
|
(842) |
|
|
|
(0.01) |
|
|
|
(2,173) |
|
|
|
(0.04) |
|
|
|
(2,897) |
|
|
|
(0.04) |
|
|
|
(11,217) |
|
|
|
(0.18) |
|
| Add: Part II incentive fee |
|
|
— |
|
|
|
— |
|
|
|
— |
|
|
|
— |
|
|
|
— |
|
|
|
— |
|
|
|
— |
|
|
|
— |
|
|
|
(8,791) |
|
|
|
(0.14) |
|
|
|
|
|
|
|
|
|
|
|
|
|
|
|
|
|
|
|
|
|
|
|
|
|
|
|
|
|
|
|
|
|
|
|
|
|
|
|
|
|
|
| Adjusted net investment income |
|
$ |
47,750 |
|
|
$ |
0.62 |
|
|
$ |
47,571 |
|
|
$ |
0.62 |
|
|
$ |
33,685 |
|
|
$ |
0.55 |
|
|
$ |
177,800 |
|
|
$ |
2.47 |
|
|
$ |
128,613 |
|
|
$ |
2.12 |
|
|
|
|
|
|
|
|
|
|
|
|
|
|
|
|
|
|
|
|
|
|
|
|
|
|
|
|
|
|
|
|
|
|
|
|
|
|
|
|
|
|
The following table provides a reconciliation of net realized and unrealized gains (losses), net of taxes (the most comparable U.S. GAAP
measure) to adjusted net realized and unrealized gains (losses), net of taxes for the periods presented:
|
|
|
|
|
|
|
|
|
|
|
|
|
|
|
|
|
|
|
|
|
|
|
|
|
|
|
|
|
|
|
|
|
|
|
|
|
|
|
|
|
| |
|
For the three months ended |
|
|
For the year ended |
|
| |
|
September 30, 2023
(unaudited) |
|
|
June 30, 2023
(unaudited) |
|
|
September 30, 2022
(unaudited) |
|
|
September 30, 2023 |
|
|
September 30, 2022 |
|
| ($ in thousands, except per share data) |
|
Amount |
|
|
Per Share |
|
|
Amount |
|
|
Per Share |
|
|
Amount |
|
|
Per Share |
|
|
Amount |
|
|
Per Share |
|
|
Amount |
|
|
Per Share |
|
| GAAP net realized and unrealized gains (losses), net of taxes |
|
$ |
(1,546) |
|
|
$ |
(0.02) |
|
|
$ |
(11,728) |
|
|
$ |
(0.15) |
|
|
$ |
(22,650) |
|
|
$ |
(0.37) |
|
|
$ |
(63,366) |
|
|
$ |
(0.88) |
|
|
$ |
(119,398) |
|
|
$ |
(1.97) |
|
| Less: Net realized and unrealized losses (gains) related to merger accounting adjustments |
|
|
(122) |
|
|
|
— |
|
|
|
612 |
|
|
|
0.01 |
|
|
|
2,173 |
|
|
|
0.04 |
|
|
|
23,191 |
|
|
|
0.32 |
|
|
|
11,215 |
|
|
|
0.18 |
|
|
|
|
|
|
|
|
|
|
|
|
|
|
|
|
|
|
|
|
|
|
|
|
|
|
|
|
|
|
|
|
|
|
|
|
|
|
|
|
|
|
| Adjusted net realized and unrealized gains (losses), net of taxes |
|
$ |
(1,668) |
|
|
$ |
(0.02) |
|
|
$ |
(11,116) |
|
|
$ |
(0.14) |
|
|
$ |
(20,477) |
|
|
$ |
(0.34) |
|
|
$ |
(40,175) |
|
|
$ |
(0.56) |
|
|
$ |
(108,183) |
|
|
$ |
(1.78) |
|
|
|
|
|
|
|
|
|
|
|
|
|
|
|
|
|
|
|
|
|
|
|
|
|
|
|
|
|
|
|
|
|
|
|
|
|
|
|
|
|
|
The following table provides a reconciliation of net increase (decrease) in net assets resulting from operations (the most comparable
U.S. GAAP measure) to adjusted earnings (loss) for the periods presented:
|
|
|
|
|
|
|
|
|
|
|
|
|
|
|
|
|
|
|
|
|
|
|
|
|
|
|
|
|
|
|
|
|
|
|
|
|
|
|
|
|
| |
|
For the three months ended |
|
|
For the year ended |
|
| |
|
September 30, 2023
(unaudited) |
|
|
June 30, 2023
(unaudited) |
|
|
September 30, 2022
(unaudited) |
|
|
September 30, 2023 |
|
|
September 30, 2022 |
|
| ($ in thousands, except per share data) |
|
Amount |
|
|
Per Share |
|
|
Amount |
|
|
Per Share |
|
|
Amount |
|
|
Per Share |
|
|
Amount |
|
|
Per Share |
|
|
Amount |
|
|
Per Share |
|
| Net increase (decrease) in net assets resulting from operations |
|
$ |
45,952 |
|
|
$ |
0.60 |
|
|
$ |
36,685 |
|
|
$ |
0.48 |
|
|
$ |
13,208 |
|
|
$ |
0.22 |
|
|
$ |
117,331 |
|
|
$ |
1.63 |
|
|
$ |
29,223 |
|
|
$ |
0.48 |
|
| Less: Interest income accretion related to merger accounting adjustments |
|
|
252 |
|
|
|
— |
|
|
|
(842) |
|
|
|
(0.01) |
|
|
|
(2,173) |
|
|
|
(0.04) |
|
|
|
(2,897) |
|
|
|
(0.04) |
|
|
|
(11,217) |
|
|
|
(0.18) |
|
| Less: Net realized and unrealized losses (gains) related to merger accounting adjustments |
|
|
(122) |
|
|
|
— |
|
|
|
612 |
|
|
|
0.01 |
|
|
|
2,173 |
|
|
|
0.04 |
|
|
|
23,191 |
|
|
|
0.32 |
|
|
|
11,215 |
|
|
|
0.18 |
|
|
|
|
|
|
|
|
|
|
|
|
|
|
|
|
|
|
|
|
|
|
|
|
|
|
|
|
|
|
|
|
|
|
|
|
|
|
|
|
|
|
| Adjusted earnings (loss) |
|
$ |
46,082 |
|
|
$ |
0.60 |
|
|
$ |
36,455 |
|
|
$ |
0.47 |
|
|
$ |
13,208 |
|
|
$ |
0.22 |
|
|
$ |
137,625 |
|
|
$ |
1.91 |
|
|
$ |
29,221 |
|
|
$ |
0.48 |
|
|
|
|
|
|
|
|
|
|
|
|
|
|
|
|
|
|
|
|
|
|
|
|
|
|
|
|
|
|
|
|
|
|
|
|
|
|
|
|
|
|
8
Conference Call Information
Oaktree Specialty Lending will host a conference call to discuss its fourth fiscal quarter and full year 2023 results at 11:00 a.m. Eastern Time / 8:00 a.m. Pacific
Time on November 14, 2023. The conference call may be accessed by dialing (877) 507-3275 (U.S. callers) or +1 (412) 317-5238
(non-U.S. callers). All callers will need to reference “Oaktree Specialty Lending” once connected with the operator. Alternatively, a live webcast of the conference call can be accessed through the
Investors section of Oaktree Specialty Lending’s website, www.oaktreespecialtylending.com. During the conference call, the Company
intends to refer to an investor presentation that will be available on the Investors section of its website.
For those individuals unable to listen to the
live broadcast of the conference call, a replay will be available on Oaktree Specialty Lending’s website, or by dialing (877) 344-7529 (U.S. callers) or +1 (412)
317-0088 (non-U.S. callers), access code 4395893, beginning approximately one hour after the broadcast.
About Oaktree Specialty Lending Corporation
Oaktree Specialty Lending
Corporation (NASDAQ:OCSL) is a specialty finance company dedicated to providing customized one-stop credit solutions to companies with limited access to public or syndicated capital markets. The Company’s
investment objective is to generate current income and capital appreciation by providing companies with flexible and innovative financing solutions including first and second lien loans, unsecured and mezzanine loans, and preferred equity. The
Company is regulated as a business development company under the Investment Company Act of 1940, as amended, and is externally managed by Oaktree Fund Advisors, LLC, an affiliate of Oaktree Capital Management, L.P. For additional information, please
visit Oaktree Specialty Lending’s website at www.oaktreespecialtylending.com.
Forward-Looking Statements
Some of the statements in this press release
constitute forward-looking statements because they relate to future events, future performance or financial condition. The forward-looking statements may include statements as to: future operating results of the Company and distribution projections;
business prospects of the Company and the prospects of its portfolio companies; and the impact of the investments that the Company expects to make. In addition, words such as “anticipate,” “believe,” “expect,”
“seek,” “plan,” “should,” “estimate,” “project” and “intend” indicate forward-looking statements, although not all forward-looking statements include these words. The forward-looking
statements contained in this press release involve risks and uncertainties. Certain factors could cause actual results and conditions to differ materially from those projected, including the uncertainties associated with (i) changes in the
economy, financial markets and political environment, including the impacts of inflation and rising interest rates; (ii) risks associated with possible disruption in the operations of the Company or the economy generally due to terrorism, war
or other geopolitical conflict (including the current conflicts in Ukraine and Israel), natural disasters, pandemics or cybersecurity incidents; (iii) future changes in laws or regulations (including the interpretation of these laws and
regulations by regulatory authorities); (iv) conditions in the Company’s operating areas, particularly with respect to business development companies or regulated investment companies; and (v) other considerations that may be disclosed
from time to time in the Company’s publicly disseminated documents and filings. The Company has based the forward-looking statements included in this press release on information available to it on the date of this press release, and the
Company assumes no obligation to update any such forward-looking statements. The Company undertakes no obligation to revise or update any forward-looking statements, whether as a result of new information, future events or otherwise, you are advised
to consult any additional disclosures that it may make directly to you or through reports that the Company in the future may file with the Securities and Exchange Commission, including annual reports on Form
10-K, quarterly reports on Form 10-Q and current reports on Form 8-K.
Contacts
Investor Relations:
Oaktree Specialty Lending Corporation
Michael Mosticchio
(212) 284-1900
ocsl-ir@oaktreecapital.com
Media Relations:
Financial Profiles, Inc.
Moira Conlon
(310) 478-2700
mediainquiries@oaktreecapital.com
9
Oaktree Specialty Lending Corporation
Consolidated Statements of Assets and Liabilities
(in thousands, except per share amounts)
|
|
|
|
|
|
|
|
|
|
|
|
|
| |
|
September 30,
2023 |
|
|
June 30, 2023
(unaudited) |
|
|
September 30,
2022 |
|
| ASSETS |
|
|
|
|
|
|
|
|
|
|
|
|
| Investments at fair value: |
|
|
|
|
|
|
|
|
|
|
|
|
| Control investments (cost September 30, 2023: $345,245; cost June 30, 2023: $285,236;
cost September 30, 2022: $260,305) |
|
$ |
297,091 |
|
|
$ |
238,196 |
|
|
$ |
214,165 |
|
| Affiliate investments (cost September 30, 2023: $24,898; cost June 30, 2023: $25,370;
cost September 30, 2022: $27,353) |
|
|
23,349 |
|
|
|
23,911 |
|
|
|
26,196 |
|
| Non-control/Non-affiliate investments (cost
September 30, 2023: $2,673,976; cost June 30, 2023: $2,985,679; cost September 30, 2022: $2,330,096) |
|
|
2,571,980 |
|
|
|
2,873,512 |
|
|
|
2,253,750 |
|
|
|
|
|
|
|
|
|
|
|
|
|
|
| Total investments at fair value (cost September 30, 2023: $3,044,119; cost June 30, 2023: $3,296,285;
cost September 30, 2022: $2,617,754) |
|
|
2,892,420 |
|
|
|
3,135,619 |
|
|
|
2,494,111 |
|
| Cash and cash equivalents |
|
|
136,450 |
|
|
|
59,704 |
|
|
|
23,528 |
|
| Restricted cash |
|
|
9,089 |
|
|
|
12,956 |
|
|
|
2,836 |
|
| Interest, dividends and fees receivable |
|
|
44,570 |
|
|
|
29,457 |
|
|
|
35,598 |
|
| Due from portfolio companies |
|
|
6,317 |
|
|
|
2,080 |
|
|
|
22,495 |
|
| Receivables from unsettled transactions |
|
|
55,441 |
|
|
|
39,261 |
|
|
|
4,692 |
|
| Due from broker |
|
|
54,260 |
|
|
|
39,990 |
|
|
|
45,530 |
|
| Deferred financing costs |
|
|
12,541 |
|
|
|
13,284 |
|
|
|
7,350 |
|
| Deferred offering costs |
|
|
160 |
|
|
|
186 |
|
|
|
32 |
|
| Deferred tax asset, net |
|
|
— |
|
|
|
2,695 |
|
|
|
1,687 |
|
| Derivative assets at fair value |
|
|
4,910 |
|
|
|
49 |
|
|
|
6,789 |
|
| Other assets |
|
|
1,681 |
|
|
|
693 |
|
|
|
1,665 |
|
|
|
|
|
|
|
|
|
|
|
|
|
|
| Total assets |
|
$ |
3,217,839 |
|
|
$ |
3,335,974 |
|
|
$ |
2,646,313 |
|
|
|
|
|
|
|
|
|
|
|
|
|
|
|
|
|
|
|
|
|
|
|
|
|
|
|
| LIABILITIES AND NET ASSETS |
|
|
|
|
|
|
|
|
|
|
|
|
| Liabilities: |
|
|
|
|
|
|
|
|
|
|
|
|
| Accounts payable, accrued expenses and other liabilities |
|
$ |
2,950 |
|
|
$ |
3,412 |
|
|
$ |
3,701 |
|
| Base management fee and incentive fee payable |
|
|
19,547 |
|
|
|
20,072 |
|
|
|
15,940 |
|
| Due to affiliate |
|
|
4,310 |
|
|
|
7,724 |
|
|
|
3,180 |
|
| Interest payable |
|
|
16,007 |
|
|
|
12,907 |
|
|
|
7,936 |
|
| Payables from unsettled transactions |
|
|
11,006 |
|
|
|
2,785 |
|
|
|
26,981 |
|
| Derivative liability at fair value |
|
|
47,519 |
|
|
|
39,567 |
|
|
|
41,969 |
|
| Deferred tax liability |
|
|
5 |
|
|
|
— |
|
|
|
— |
|
| Credit facilities payable |
|
|
710,000 |
|
|
|
1,135,000 |
|
|
|
700,000 |
|
| Unsecured notes payable (net of $7,076, $3,909 and $5,020 of unamortized financing costs as of September 30, 2023,
June 30, 2023 and September 30, 2022, respectively) |
|
|
890,731 |
|
|
|
605,066 |
|
|
|
601,043 |
|
|
|
|
|
|
|
|
|
|
|
|
|
|
| Total liabilities |
|
|
1,702,075 |
|
|
|
1,826,533 |
|
|
|
1,400,750 |
|
|
|
|
|
|
|
|
|
|
|
|
|
|
| Commitments and contingencies |
|
|
|
|
|
|
|
|
|
|
|
|
| Net assets: |
|
|
|
|
|
|
|
|
|
|
|
|
| Common stock, $0.01 par value per share, 250,000 shares authorized; 77,225, 77,080 and 61,125 shares issued and outstanding
as of September 30, 2023, June 30, 2023 and September 30, 2022, respectively |
|
|
772 |
|
|
|
771 |
|
|
|
611 |
|
| Additional paid-in-capital |
|
|
2,166,330 |
|
|
|
2,163,528 |
|
|
|
1,827,721 |
|
| Accumulated overdistributed earnings |
|
|
(651,338 |
) |
|
|
(654,858 |
) |
|
|
(582,769 |
) |
|
|
|
|
|
|
|
|
|
|
|
|
|
| Total net assets (equivalent to $19.63, $19.58 and $20.38 per common share as of September 30, 2023, June 30, 2023
and September 30, 2022, respectively) |
|
|
1,515,764 |
|
|
|
1,509,441 |
|
|
|
1,245,563 |
|
|
|
|
|
|
|
|
|
|
|
|
|
|
| Total liabilities and net assets |
|
$ |
3,217,839 |
|
|
$ |
3,335,974 |
|
|
$ |
2,646,313 |
|
|
|
|
|
|
|
|
|
|
|
|
|
|
10
Oaktree Specialty Lending Corporation
Consolidated Statements of Operations
(in
thousands, except per share amounts)
|
|
|
|
|
|
|
|
|
|
|
|
|
|
|
|
|
|
|
|
|
| |
|
Three months
ended
September 30,
2023
(unaudited) |
|
|
Three months
ended June 30,
2023
(unaudited) |
|
|
Three months
ended
September 30,
2022
(unaudited) |
|
|
Year ended
September 30,
2023 |
|
|
Year ended
September 30,
2022 |
|
| Interest income: |
|
|
|
|
|
|
|
|
|
|
|
|
|
|
|
|
|
|
|
|
| Control investments |
|
$ |
5,877 |
|
|
$ |
5,568 |
|
|
$ |
3,829 |
|
|
$ |
21,203 |
|
|
$ |
14,043 |
|
| Affiliate investments |
|
|
650 |
|
|
|
681 |
|
|
|
574 |
|
|
|
2,620 |
|
|
|
1,744 |
|
| Non-control/Non-affiliate investments |
|
|
86,346 |
|
|
|
88,069 |
|
|
|
57,021 |
|
|
|
320,862 |
|
|
|
212,677 |
|
| Interest on cash and cash equivalents |
|
|
1,859 |
|
|
|
992 |
|
|
|
295 |
|
|
|
4,080 |
|
|
|
452 |
|
|
|
|
|
|
|
|
|
|
|
|
|
|
|
|
|
|
|
|
|
|
| Total interest income |
|
|
94,732 |
|
|
|
95,310 |
|
|
|
61,719 |
|
|
|
348,765 |
|
|
|
228,916 |
|
|
|
|
|
|
|
|
|
|
|
|
|
|
|
|
|
|
|
|
|
|
| PIK interest income: |
|
|
|
|
|
|
|
|
|
|
|
|
|
|
|
|
|
|
|
|
| Control investments |
|
|
309 |
|
|
|
— |
|
|
|
— |
|
|
|
309 |
|
|
|
— |
|
| Non-control/Non-affiliate investments |
|
|
5,235 |
|
|
|
3,967 |
|
|
|
6,011 |
|
|
|
19,455 |
|
|
|
20,526 |
|
|
|
|
|
|
|
|
|
|
|
|
|
|
|
|
|
|
|
|
|
|
| Total PIK interest income |
|
|
5,544 |
|
|
|
3,967 |
|
|
|
6,011 |
|
|
|
19,764 |
|
|
|
20,526 |
|
|
|
|
|
|
|
|
|
|
|
|
|
|
|
|
|
|
|
|
|
|
| Fee income: |
|
|
|
|
|
|
|
|
|
|
|
|
|
|
|
|
|
|
|
|
| Control investments |
|
|
13 |
|
|
|
13 |
|
|
|
12 |
|
|
|
51 |
|
|
|
50 |
|
| Affiliate investments |
|
|
5 |
|
|
|
5 |
|
|
|
5 |
|
|
|
20 |
|
|
|
20 |
|
| Non-control/Non-affiliate investments |
|
|
554 |
|
|
|
1,555 |
|
|
|
1,522 |
|
|
|
6,475 |
|
|
|
6,561 |
|
|
|
|
|
|
|
|
|
|
|
|
|
|
|
|
|
|
|
|
|
|
| Total fee income |
|
|
572 |
|
|
|
1,573 |
|
|
|
1,539 |
|
|
|
6,546 |
|
|
|
6,631 |
|
|
|
|
|
|
|
|
|
|
|
|
|
|
|
|
|
|
|
|
|
|
| Dividend income: |
|
|
|
|
|
|
|
|
|
|
|
|
|
|
|
|
|
|
|
|
| Control investments |
|
|
1,050 |
|
|
|
1,050 |
|
|
|
875 |
|
|
|
4,200 |
|
|
|
6,366 |
|
| Non-control/Non-affiliate investments |
|
|
7 |
|
|
|
— |
|
|
|
— |
|
|
|
11 |
|
|
|
81 |
|
|
|
|
|
|
|
|
|
|
|
|
|
|
|
|
|
|
|
|
|
|
| Total dividend income |
|
|
1,057 |
|
|
|
1,050 |
|
|
|
875 |
|
|
|
4,211 |
|
|
|
6,447 |
|
|
|
|
|
|
|
|
|
|
|
|
|
|
|
|
|
|
|
|
|
|
| Total investment income |
|
|
101,905 |
|
|
|
101,900 |
|
|
|
70,144 |
|
|
|
379,286 |
|
|
|
262,520 |
|
|
|
|
|
|
|
|
|
|
|
|
|
|
|
|
|
|
|
|
|
|
| Expenses: |
|
|
|
|
|
|
|
|
|
|
|
|
|
|
|
|
|
|
|
|
| Base management fee |
|
|
11,516 |
|
|
|
11,983 |
|
|
|
9,703 |
|
|
|
44,899 |
|
|
|
39,556 |
|
| Part I incentive fee |
|
|
9,531 |
|
|
|
9,590 |
|
|
|
6,986 |
|
|
|
35,831 |
|
|
|
26,644 |
|
| Part II incentive fee |
|
|
— |
|
|
|
— |
|
|
|
— |
|
|
|
— |
|
|
|
(8,791 |
) |
| Professional fees |
|
|
1,282 |
|
|
|
1,387 |
|
|
|
1,389 |
|
|
|
6,244 |
|
|
|
4,418 |
|
| Directors fees |
|
|
160 |
|
|
|
160 |
|
|
|
160 |
|
|
|
640 |
|
|
|
603 |
|
| Interest expense |
|
|
32,326 |
|
|
|
30,793 |
|
|
|
15,751 |
|
|
|
111,642 |
|
|
|
46,929 |
|
| Administrator expense |
|
|
317 |
|
|
|
322 |
|
|
|
278 |
|
|
|
1,252 |
|
|
|
1,246 |
|
| General and administrative expenses |
|
|
775 |
|
|
|
752 |
|
|
|
769 |
|
|
|
3,528 |
|
|
|
2,986 |
|
|
|
|
|
|
|
|
|
|
|
|
|
|
|
|
|
|
|
|
|
|
| Total expenses |
|
|
55,907 |
|
|
|
54,987 |
|
|
|
35,036 |
|
|
|
204,036 |
|
|
|
113,591 |
|
| Fees waived |
|
|
(1,500 |
) |
|
|
(1,500 |
) |
|
|
(750 |
) |
|
|
(5,525 |
) |
|
|
(3,000 |
) |
|
|
|
|
|
|
|
|
|
|
|
|
|
|
|
|
|
|
|
|
|
| Net expenses |
|
|
54,407 |
|
|
|
53,487 |
|
|
|
34,286 |
|
|
|
198,511 |
|
|
|
110,591 |
|
|
|
|
|
|
|
|
|
|
|
|
|
|
|
|
|
|
|
|
|
|
| Net investment income before taxes |
|
|
47,498 |
|
|
|
48,413 |
|
|
|
35,858 |
|
|
|
180,775 |
|
|
|
151,929 |
|
| (Provision) benefit for taxes on net investment income |
|
|
— |
|
|
|
— |
|
|
|
— |
|
|
|
— |
|
|
|
(3,308 |
) |
| Excise tax |
|
|
— |
|
|
|
— |
|
|
|
— |
|
|
|
(78 |
) |
|
|
— |
|
|
|
|
|
|
|
|
|
|
|
|
|
|
|
|
|
|
|
|
|
|
| Net investment income |
|
|
47,498 |
|
|
|
48,413 |
|
|
|
35,858 |
|
|
|
180,697 |
|
|
|
148,621 |
|
|
|
|
|
|
|
|
|
|
|
|
|
|
|
|
|
|
|
|
|
|
| Unrealized appreciation (depreciation): |
|
|
|
|
|
|
|
|
|
|
|
|
|
|
|
|
|
|
|
|
| Control investments |
|
|
(1,114 |
) |
|
|
734 |
|
|
|
(6,754 |
) |
|
|
(2,014 |
) |
|
|
(33,306 |
) |
| Affiliate investments |
|
|
(90 |
) |
|
|
149 |
|
|
|
33 |
|
|
|
(392 |
) |
|
|
(683 |
) |
| Non-control/Non-affiliate investments |
|
|
10,088 |
|
|
|
(6,497 |
) |
|
|
(16,803 |
) |
|
|
(26,208 |
) |
|
|
(107,136 |
) |
| Foreign currency forward contracts |
|
|
4,861 |
|
|
|
4,575 |
|
|
|
5,655 |
|
|
|
59 |
|
|
|
4,877 |
|
|
|
|
|
|
|
|
|
|
|
|
|
|
|
|
|
|
|
|
|
|
| Net unrealized appreciation (depreciation) |
|
|
13,745 |
|
|
|
(1,039 |
) |
|
|
(17,869 |
) |
|
|
(28,555 |
) |
|
|
(136,248 |
) |
|
|
|
|
|
|
|
|
|
|
|
|
|
|
|
|
|
|
|
|
|
| Realized gains (losses): |
|
|
|
|
|
|
|
|
|
|
|
|
|
|
|
|
|
|
|
|
| Control investments |
|
|
— |
|
|
|
— |
|
|
|
— |
|
|
|
— |
|
|
|
1,868 |
|
| Non-control/Non-affiliate investments |
|
|
(12,986 |
) |
|
|
(4,294 |
) |
|
|
(4,303 |
) |
|
|
(27,390 |
) |
|
|
1,585 |
|
| Foreign currency forward contracts |
|
|
(252 |
) |
|
|
(6,309 |
) |
|
|
1,547 |
|
|
|
(5,765 |
) |
|
|
13,726 |
|
|
|
|
|
|
|
|
|
|
|
|
|
|
|
|
|
|
|
|
|
|
| Net realized gains (losses) |
|
|
(13,238 |
) |
|
|
(10,603 |
) |
|
|
(2,756 |
) |
|
|
(33,155 |
) |
|
|
17,179 |
|
|
|
|
|
|
|
|
|
|
|
|
|
|
|
|
|
|
|
|
|
|
| (Provision) benefit for taxes on realized and unrealized gains (losses) |
|
|
(2,053 |
) |
|
|
(86 |
) |
|
|
(2,025 |
) |
|
|
(1,656 |
) |
|
|
(329 |
) |
|
|
|
|
|
|
|
|
|
|
|
|
|
|
|
|
|
|
|
|
|
| Net realized and unrealized gains (losses), net of taxes |
|
|
(1,546 |
) |
|
|
(11,728 |
) |
|
|
(22,650 |
) |
|
|
(63,366 |
) |
|
|
(119,398 |
) |
|
|
|
|
|
|
|
|
|
|
|
|
|
|
|
|
|
|
|
|
|
| Net increase (decrease) in net assets resulting from operations |
|
$ |
45,952 |
|
|
$ |
36,685 |
|
|
$ |
13,208 |
|
|
$ |
117,331 |
|
|
$ |
29,223 |
|
|
|
|
|
|
|
|
|
|
|
|
|
|
|
|
|
|
|
|
|
|
| Net investment income per common share — basic and diluted |
|
$ |
0.62 |
|
|
$ |
0.63 |
|
|
$ |
0.59 |
|
|
$ |
2.51 |
|
|
$ |
2.45 |
|
| Earnings (loss) per common share — basic and diluted |
|
$ |
0.60 |
|
|
$ |
0.48 |
|
|
$ |
0.22 |
|
|
$ |
1.63 |
|
|
$ |
0.48 |
|
| Weighted average common shares outstanding — basic and diluted |
|
|
77,130 |
|
|
|
77,080 |
|
|
|
61,125 |
|
|
|
72,119 |
|
|
|
60,727 |
|
11

Exhibit 99.2 fourth quarter 2023 earnings presentation november 14, 2023
nasdaq: ocsl

Forward Looking Statements & Legal Disclosures Some of the
statements in this presentation constitute forward-looking statements because they relate to future events or our future performance or financial condition. The forward- looking statements contained in this presentation may include statements as to:
our future operating results and distribution projections; the ability of Oaktree Fund Advisors, LLC (together with its affiliates, “Oaktree”) to reposition our portfolio and to implement Oaktree’s future plans with respect to our
business; the ability of Oaktree and its affiliates to attract and retain highly talented professionals; our business prospects and the prospects of our portfolio companies; the impact of the investments that we expect to make; the ability of our
portfolio companies to achieve their objectives; our expected financings and investments and additional leverage we may seek to incur in the future; the adequacy of our cash resources and working capital; the timing of cash flows, if any, from the
operations of our portfolio companies; and the cost or potential outcome of any litigation to which we may be a party. In addition, words such as “anticipate,” “believe,” “expect,” “seek,”
“plan,” “should,” “estimate,” “project” and “intend” indicate forward-looking statements, although not all forward-looking statements include these words. The forward-looking statements
contained in this presentation involve risks and uncertainties. Our actual results could differ materially from those implied or expressed in the forward-looking statements for any reason, including the factors set forth in “Risk
Factors” and elsewhere in our annual report on Form 10-K for the fiscal year ended September 30, 2023. Other factors that could cause actual results to differ materially include: changes in the economy, financial markets and political
environment; risks associated with possible disruption in our operations or the economy generally due to terrorism, war or other geopolitical conflict (including the current conflicts in Ukraine and Israel), natural disasters, pandemics or
cybersecurity incidents; future changes in laws or regulations (including the interpretation of these laws and regulations by regulatory authorities) and conditions in our operating areas, particularly with respect to business development companies
or regulated investment companies; and other considerations disclosed from time to time in our publicly disseminated documents and filings. We have based the forward-looking statements included in this presentation on information available to us on
the date of this presentation, and we assume no obligation to update any such forward-looking statements. Although we undertake no obligation to revise or update any forward-looking statements, whether as a result of new information, future events
or otherwise, you are advised to consult any additional disclosures that we may make directly to you or through reports that we in the future may file with the SEC, including annual reports on Form 10-K, quarterly reports on Form 10-Q and current
reports on Form 8-K. Calculation of Assets Under Management References to total assets under management or AUM represent assets managed by Oaktree and a proportionate amount of the AUM reported by DoubleLine Capital LP ( DoubleLine Capital ), in
which Oaktree owns a 20% minority interest. Oaktree's methodology for calculating AUM includes (i) the net asset value (“NAV”) of assets managed directly by Oaktree, (ii) the leverage on which management fees are charged, (iii) undrawn
capital that Oaktree is entitled to call from investors in Oaktree funds pursuant to their capital commitments, (iv) for collateralized loan obligation vehicles ( CLOs ), the aggregate par value of collateral assets and principal cash, (v) for
publicly-traded business development companies, gross assets (including assets acquired with leverage), net of cash, and (vi) Oaktree's pro rata portion (20%) of the AUM reported by DoubleLine Capital. This calculation of AUM is not based on the
definitions of AUM that may be set forth in agreements governing the investment funds, vehicles or accounts managed and is not calculated pursuant to regulatory definitions. Unless otherwise indicated, data provided herein are dated as of September
30, 2023. 1

Highlights for the Quarter Ended September 30, 2023 • $0.62 per
share, consistent with the quarter ended June 30, 2023 adjusted net 1 investment income • GAAP net investment income was $0.62 per share, as compared with $0.63 in the quarter ended June 30, 2023 • $19.63, up slightly as compared with
$19.58 as of June 30, 2023 net asset value per share • The increase was primarily driven by undistributed net investment income • Declared a cash distribution of $0.55 per share, which was well-covered by adjusted net investment income
of $0.62 per share dividends • Declared a special cash distribution of $0.07 per share to offset undistributed taxable income earned in 2023 • Both distributions will be payable on December 29, 2023 to stockholders of record as of
December 15, 2023 • $87 million of new investment commitments • 12.0% weighted average yield on new debt investments investment activity • $117 million of new investment fundings • Received $364 million of proceeds from
prepayments, exits, other paydowns and sales • $2.9 billion at fair value across 143 portfolio companies • 12.7% weighted average yield on debt investments, up from 12.3% as of June 30, 2023 primarily due to higher base rates investment
portfolio • 86% senior secured • 86% of debt portfolio was floating rate • 1.01x net debt to equity ratio, down from 1.14x as of June 30, 2023 on elevated repayment activity vs. investment fundings capital structure • $136
million of cash and $908 million of undrawn capacity on credit facilities & liquidity • Issued $300 million of 7.100% Notes due 2029; entered into interest rate swap agreement to pay SOFR + 3.1255% Note: The Company completed a 1-for-3
reverse stock split on January 20, 2023, effective as of the commencement of trading on January 23, 2023. All share amounts and per share information included in this presentation reflect the reverse stock split on a retroactive basis. 1 See page 19
for a description of this non-GAAP measure. 2
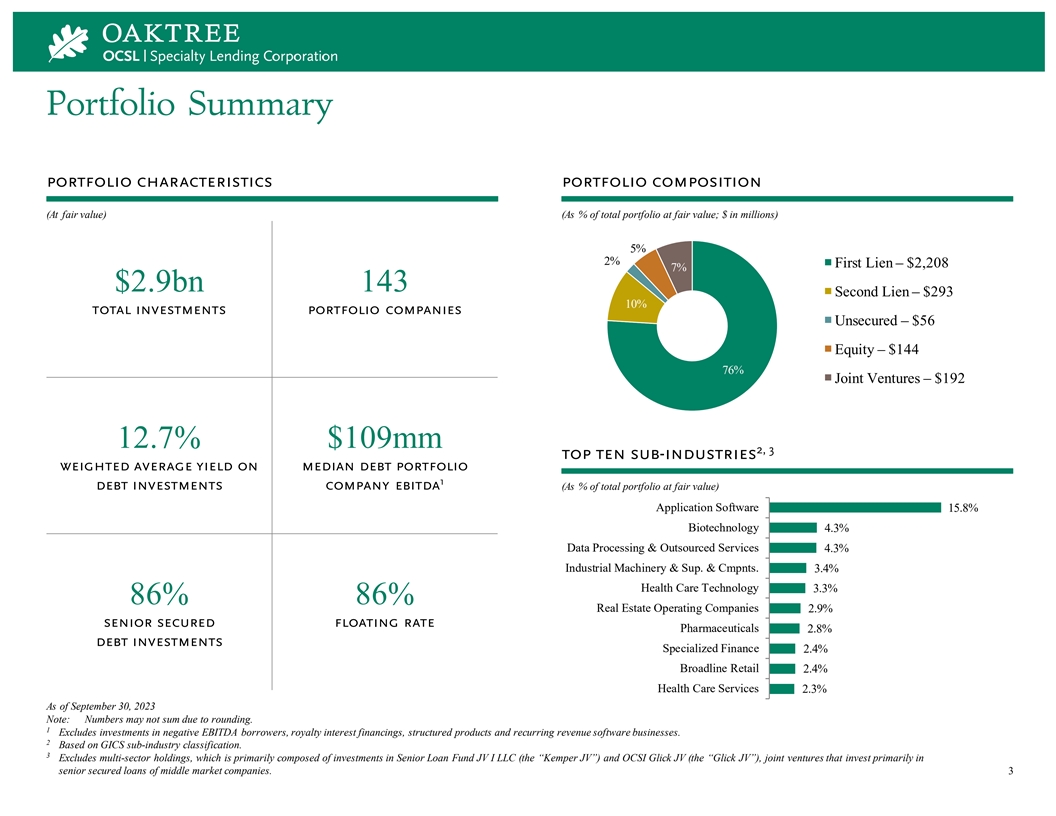
Portfolio Summary portfolio characteristics portfolio composition (At
fair value) (As % of total portfolio at fair value; $ in millions) 5% 2% First Lien – $2,208 7% $2.9bn 143 Second Lien – $293 10% total investments portfolio companies Unsecured – $56 Equity – $144 76% Joint Ventures –
$192 12.7% $109mm 2, 3 top ten sub-industries weighted average yield on median debt portfolio 1 debt investments company ebitda (As % of total portfolio at fair value) Application Software 15.8% Biotechnology 4.3% Data Processing & Outsourced
Services 4.3% Industrial Machinery & Sup. & Cmpnts. 3.4% Health Care Technology 3.3% 86% 86% Real Estate Operating Companies 2.9% senior secured floating rate Pharmaceuticals 2.8% debt investments Specialized Finance 2.4% Broadline Retail
2.4% Health Care Services 2.3% As of September 30, 2023 Note: Numbers may not sum due to rounding. 1 Excludes investments in negative EBITDA borrowers, royalty interest financings, structured products and recurring revenue software businesses. 2
Based on GICS sub-industry classification. 3 Excludes multi-sector holdings, which is primarily composed of investments in Senior Loan Fund JV I LLC (the “Kemper JV”) and OCSI Glick JV (the “Glick JV”), joint ventures that
invest primarily in senior secured loans of middle market companies. 3
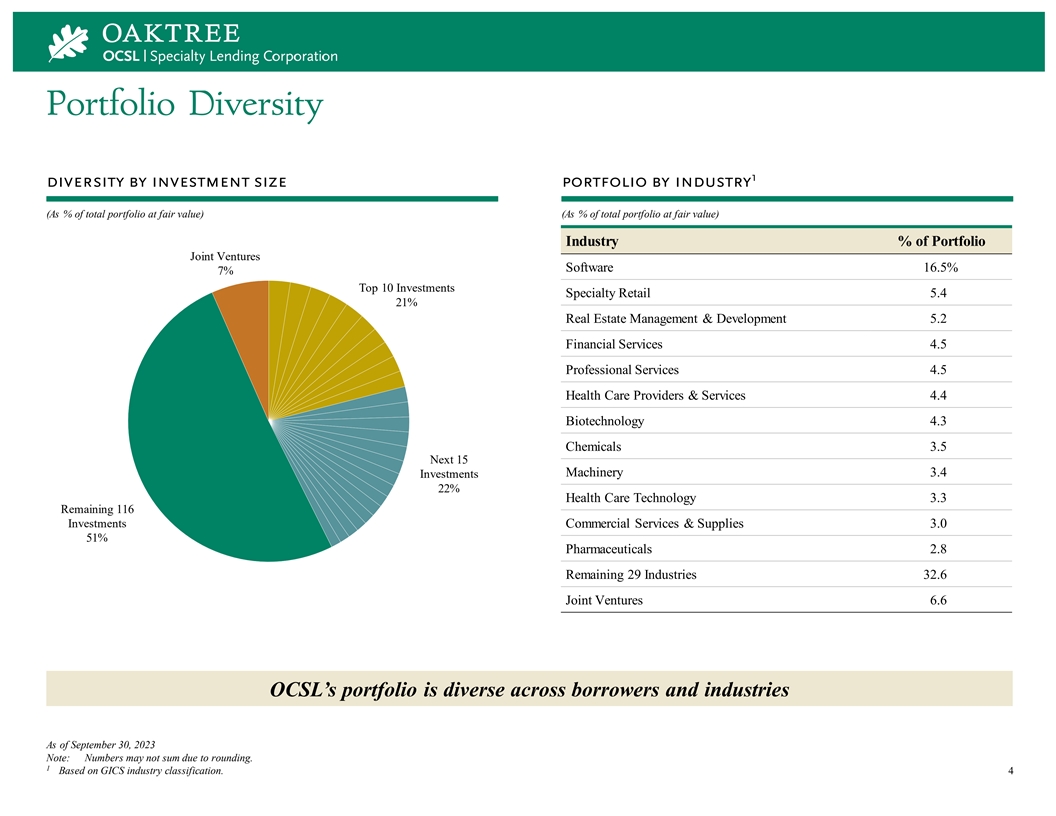
Portfolio Diversity 1 diversity by investment size portfolio by industry
(As % of total portfolio at fair value) (As % of total portfolio at fair value) Industry % of Portfolio Joint Ventures Software 16.5% 7% Top 10 Investments Specialty Retail 5.4 21% Real Estate Management & Development 5.2 Financial Services 4.5
Professional Services 4.5 Health Care Providers & Services 4.4 Biotechnology 4.3 Chemicals 3.5 Next 15 Machinery 3.4 Investments 22% Health Care Technology 3.3 Remaining 116 Investments Commercial Services & Supplies 3.0 51% Pharmaceuticals
2.8 Remaining 29 Industries 32.6 Joint Ventures 6.6 OCSL’s portfolio is diverse across borrowers and industries As of September 30, 2023 Note: Numbers may not sum due to rounding. 1 Based on GICS industry classification. 4
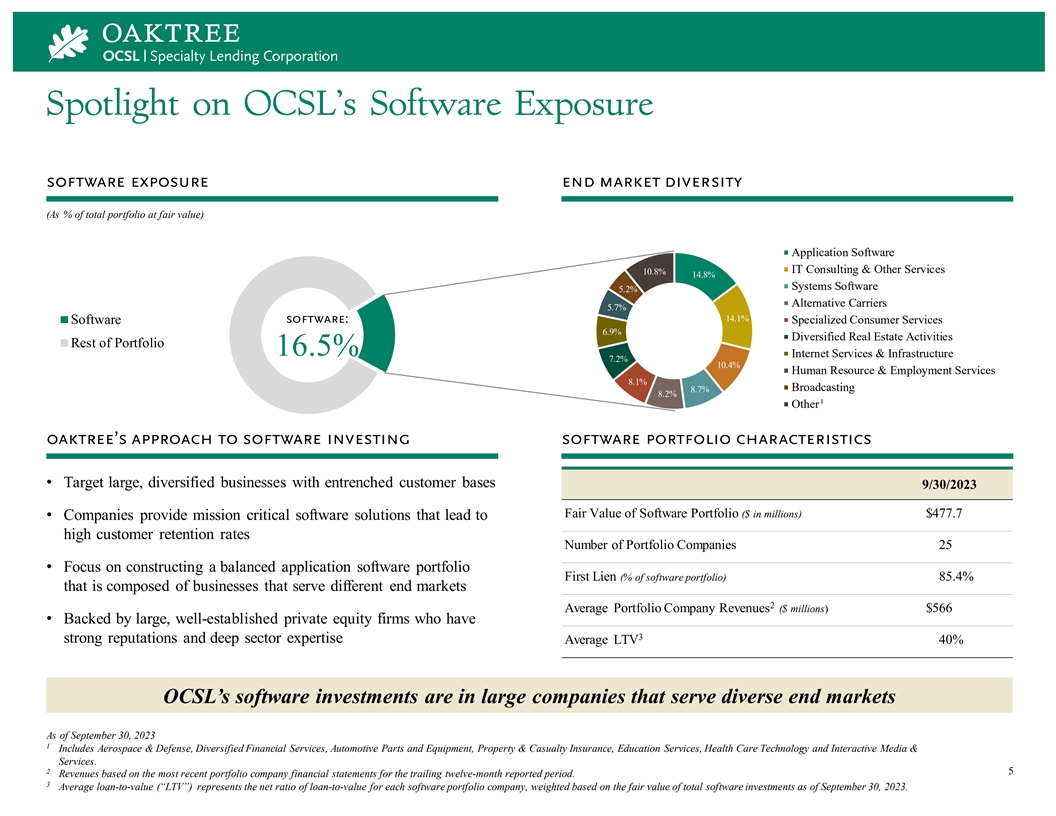
Spotlight on OCSL’s Software Exposure software exposure end market
diversity (As % of total portfolio at fair value) Application Software IT Consulting & Other Services 10.8% 14.8% Systems Software 5.2% Alternative Carriers 5.7% 14.1% software: Software Specialized Consumer Services 6.9% Diversified Real Estate
Activities Rest of Portfolio 16.5% Internet Services & Infrastructure 7.2% 10.4% Human Resource & Employment Services 8.1% 8.7% Broadcasting 8.2% 1 Other oaktree’s approach to software investing software portfolio characteristics
• Target large, diversified businesses with entrenched customer bases 9/30/2023 Fair Value of Software Portfolio ($ in millions) $477.7 • Companies provide mission critical software solutions that lead to high customer retention rates
Number of Portfolio Companies 25 • Focus on constructing a balanced application software portfolio First Lien (% of software portfolio) 85.4% that is composed of businesses that serve different end markets 2 Average Portfolio Company Revenues
($ millions) $566 • Backed by large, well-established private equity firms who have 3 strong reputations and deep sector expertise Average LTV 40% OCSL’s software investments are in large companies that serve diverse end markets As of
September 30, 2023 1 Includes Aerospace & Defense, Diversified Financial Services, Automotive Parts and Equipment, Property & Casualty Insurance, Education Services, Health Care Technology and Interactive Media & Services. 2 5 Revenues
based on the most recent portfolio company financial statements for the trailing twelve-month reported period. 3 Average loan-to-value (“LTV”) represents the net ratio of loan-to-value for each software portfolio company, weighted based
on the fair value of total software investments as of September 30, 2023.
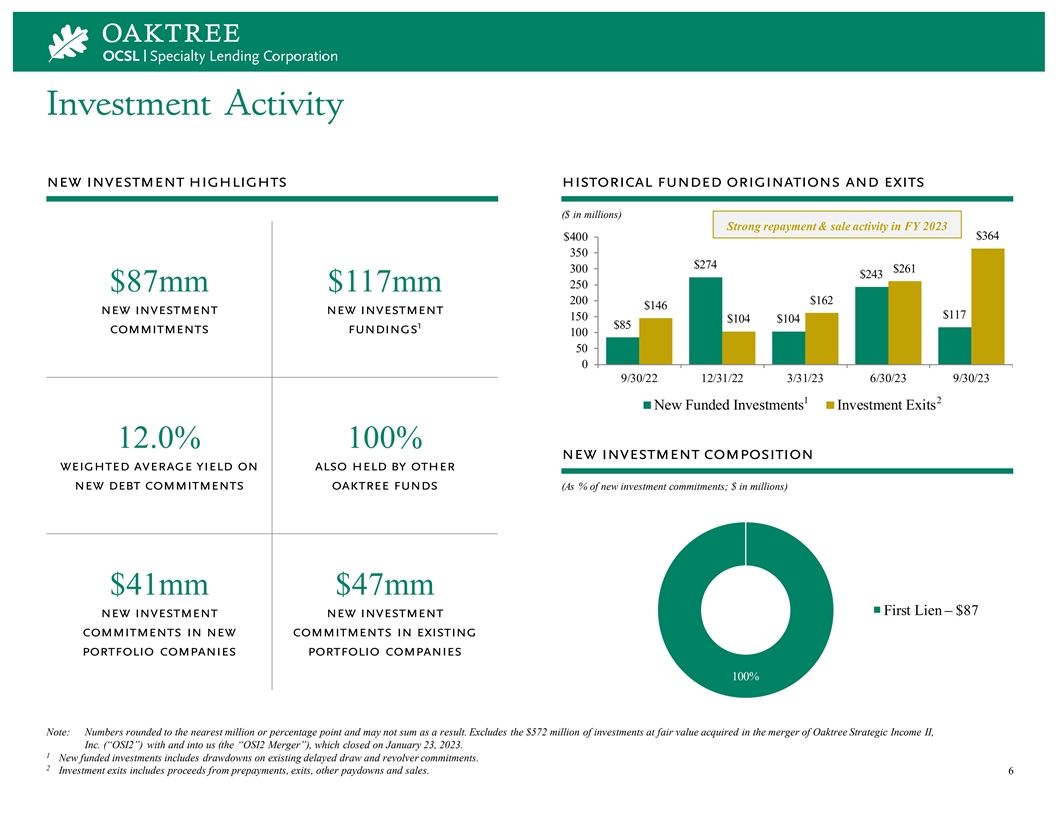
Investment Activity new investment highlights historical funded
originations and exits ($ in millions) Strong repayment & sale activity in FY 2023 $364 $400 350 $274 300 $261 $243 250 $87mm $117mm 200 $162 $146 new investment new investment $117 150 $104 $104 1 $85 commitments fundings 100 50 0 9/30/22
12/31/22 3/31/23 6/30/23 9/30/23 1 2 New Funded Investments Investment Exits 12.0% 100% new investment composition weighted average yield on also held by other new debt commitments oaktree funds (As % of new investment commitments; $ in millions)
$41mm $47mm First Lien – $87 new investment new investment commitments in new commitments in existing portfolio companies portfolio companies 100% Note: Numbers rounded to the nearest million or percentage point and may not sum as a result.
Excludes the $572 million of investments at fair value acquired in the merger of Oaktree Strategic Income II, Inc. (“OSI2”) with and into us (the “OSI2 Merger”), which closed on January 23, 2023. 1 New funded investments
includes drawdowns on existing delayed draw and revolver commitments. 2 Investment exits includes proceeds from prepayments, exits, other paydowns and sales. 6

Investment Activity (continued) new investment commitment detail ($ in
millions) Security Type Market Investment Number of Unsecured & Private Primary Secondary Avg. Secondary Fiscal Quarter Commitments Deals First Lien Second Lien Other Placement (Public) (Public) Purchase Price 2Q2020 $273 39 $210 $21 $42 $141
$58 $75 83% 3Q2020 261 18 177 8 76 154 71 35 74 4Q2020 148 10 123 25 0.5 90 57 2 96 1Q2021 286 21 196 90 -- 181 84 22 93 2Q2021 318 20 253 44 21 245 63 10 93 3Q2021 178 10 141 25 12 104 70 5 97 4Q2021 385 20 350 13 23 304 79 2 100 1Q2022 300 21 220
77 2 227 73 -- N/A 2Q2022 228 25 163 17 48 162 26 40 96 3Q2022 132 28 100 6 25 63 5 63 91 4Q2022 97 11 65 -- 32 71 22 4 92 1Q2023 250 25 214 10 26 188 49 14 82 2Q2023 124 9 124 -- -- 118 5 1 81 3Q2023 251 10 227 24 0.2 224 20 7 85 4Q2023 87 6 87 --
-- 76 12 -- N/A Note: Numbers may not sum due to rounding. Excludes any positions originated, purchased and sold within the same quarter and the assets acquired in the OSI2 Merger. 7

Financial Highlights As of ($ and number of shares in thousands, except
per share amounts) 9/30/2023 6/30/2023 3/31/2023 12/31/2022 9/30/2022 GAAP Net Investment Income per Share $0.62 $0.63 $0.63 $0.63 $0.59 1 Adjusted Net Investment Income per Share $0.62 $0.62 $0.62 $0.61 $0.55 Net Realized and Unrealized Gains
(Losses), Net of Taxes per Share $(0.02) $(0.15) $(0.33) $(0.42) $(0.37) 1 Adjusted Net Realized and Unrealized Gains (Losses), Net of Taxes per Share $(0.02) $(0.14) $(0.05) $(0.39) $(0.34) Earnings (Loss) per Share $0.60 $0.48 $0.29 $0.22 $0.22 1
Adjusted Earnings (Loss) per Share $0.60 $0.47 $0.57 $0.22 $0.22 Quarterly Distributions per Share $0.55 $0.55 $0.55 $0.54 $0.51 Special Distributions per Share -- -- -- $0.42 -- NAV per Share $19.63 $19.58 $19.66 $19.63 $20.83 Weighted Average
Shares Outstanding 77,130 77,080 73,203 61,142 61,125 Shares Outstanding, End of Period 77,225 77,080 77,080 61,220 61,125 Investment Portfolio (at Fair Value) $2,892,420 $3,135,619 $3,164,860 $2,642,870 $2,494,111 Cash and Cash Equivalents $136,450
$59,704 $43,750 $17,382 $23,528 Total Assets $3,217,839 $3,335,974 $3,318,507 $2,767,260 $2,646,313 2 Total Debt Outstanding $1,600,731 $1,740,066 $1,723,840 $1,463,624 $1,301,043 Net Assets $1,515,764 $1,509,441 $1,515,150 $1,201,989 $1,245,563
Total Debt to Equity Ratio 1.10x 1.18x 1.16x 1.26x 1.08x Net Debt to Equity Ratio 1.01x 1.14x 1.14x 1.24x 1.06x 3 Weighted Average Interest Rate on Debt Outstanding 7.0% 6.6% 6.2% 5.6% 4.4% Note: The Company completed a 1-for-3 reverse stock split
on January 20, 2023, effective as of the commencement of trading on January 23, 2023. All share amounts and per share information included in this presentation reflect the reverse stock split on a retroactive basis. 1 8 See page 19 for a description
of the non-GAAP measures. 2 Net of unamortized financing costs. 3 Includes effect of the interest rate swap agreement the Company entered into in connection with the issuance of the 2027 Notes.
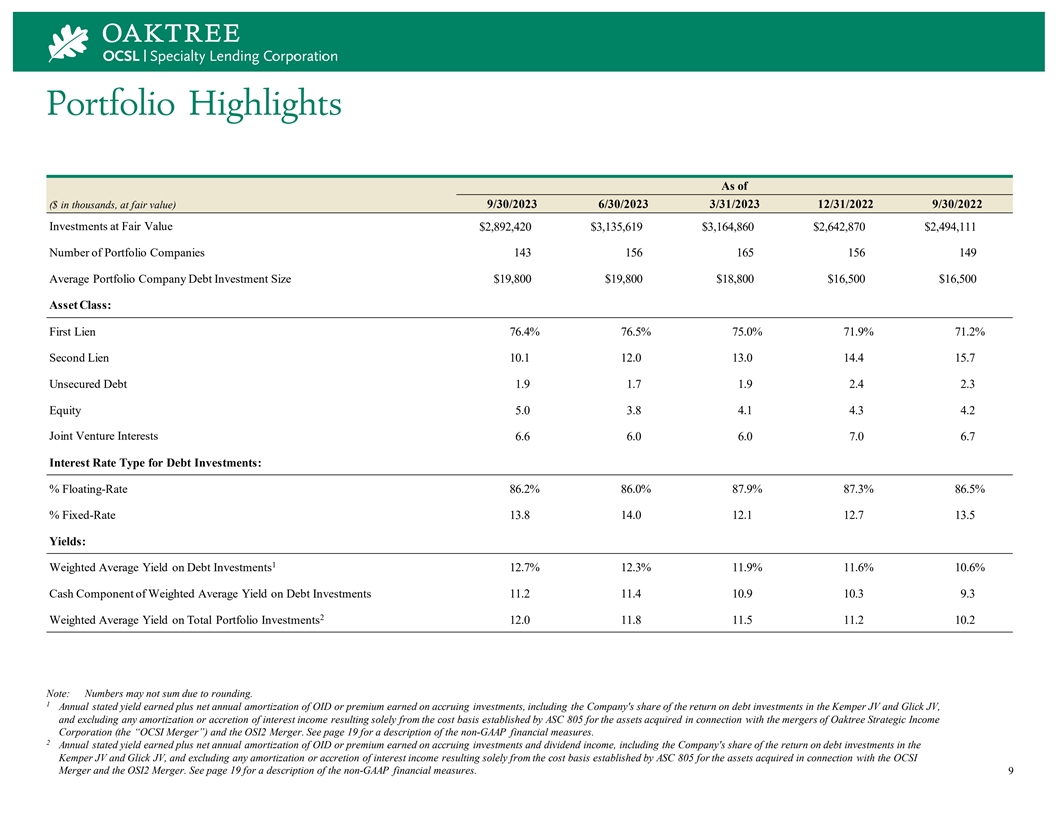
Portfolio Highlights As of ($ in thousands, at fair value) 9/30/2023
6/30/2023 3/31/2023 12/31/2022 9/30/2022 Investments at Fair Value $2,892,420 $3,135,619 $3,164,860 $2,642,870 $2,494,111 Number of Portfolio Companies 143 156 165 156 149 Average Portfolio Company Debt Investment Size $19,800 $19,800 $18,800
$16,500 $16,500 Asset Class: First Lien 76.4% 76.5% 75.0% 71.9% 71.2% Second Lien 10.1 12.0 13.0 14.4 15.7 Unsecured Debt 1.9 1.7 1.9 2.4 2.3 Equity 5.0 3.8 4.1 4.3 4.2 Joint Venture Interests 6.6 6.0 6.0 7.0 6.7 Interest Rate Type for Debt
Investments: % Floating-Rate 86.2% 86.0% 87.9% 87.3% 86.5% % Fixed-Rate 13.8 14.0 12.1 12.7 13.5 Yields: 1 Weighted Average Yield on Debt Investments 12.7% 12.3% 11.9% 11.6% 10.6% Cash Component of Weighted Average Yield on Debt Investments 11.2
11.4 10.9 10.3 9.3 2 Weighted Average Yield on Total Portfolio Investments 12.0 11.8 11.5 11.2 10.2 Note: Numbers may not sum due to rounding. 1 Annual stated yield earned plus net annual amortization of OID or premium earned on accruing
investments, including the Company's share of the return on debt investments in the Kemper JV and Glick JV, and excluding any amortization or accretion of interest income resulting solely from the cost basis established by ASC 805 for the assets
acquired in connection with the mergers of Oaktree Strategic Income Corporation (the “OCSI Merger”) and the OSI2 Merger. See page 19 for a description of the non-GAAP financial measures. 2 Annual stated yield earned plus net annual
amortization of OID or premium earned on accruing investments and dividend income, including the Company's share of the return on debt investments in the Kemper JV and Glick JV, and excluding any amortization or accretion of interest income
resulting solely from the cost basis established by ASC 805 for the assets acquired in connection with the OCSI Merger and the OSI2 Merger. See page 19 for a description of the non-GAAP financial measures. 9
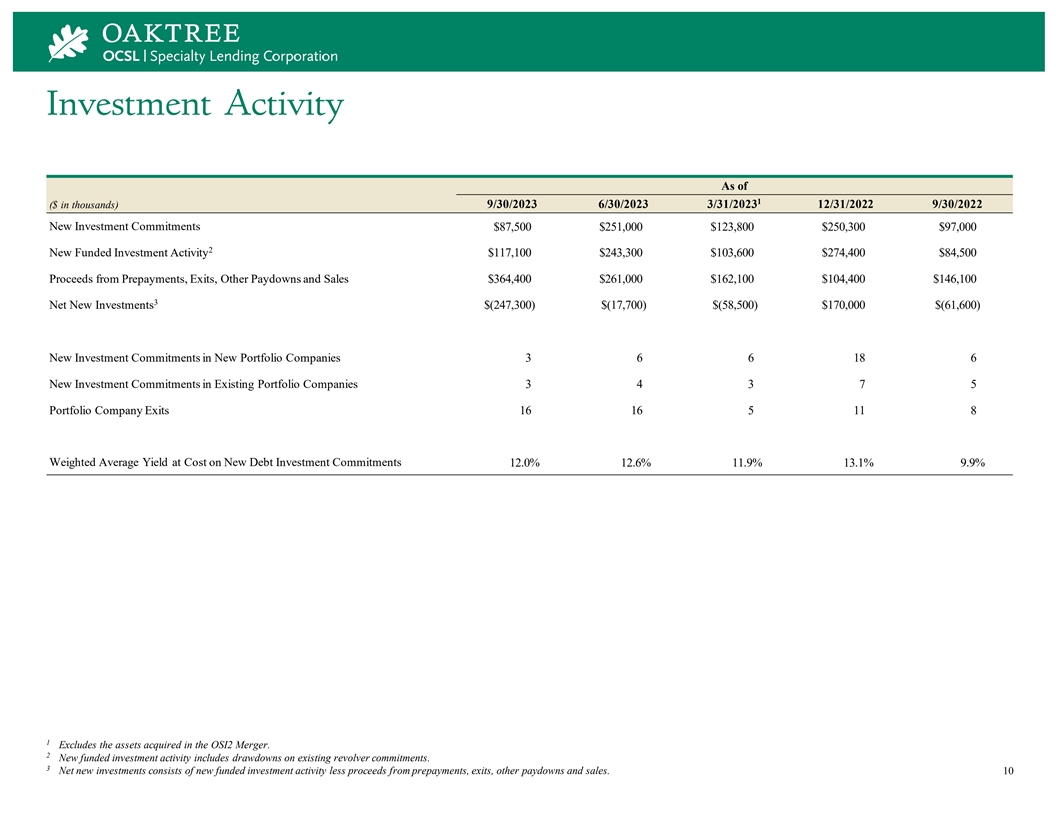
Investment Activity As of 1 ($ in thousands) 9/30/2023 6/30/2023
3/31/2023 12/31/2022 9/30/2022 New Investment Commitments $87,500 $251,000 $123,800 $250,300 $97,000 2 New Funded Investment Activity $117,100 $243,300 $103,600 $274,400 $84,500 Proceeds from Prepayments, Exits, Other Paydowns and Sales $364,400
$261,000 $162,100 $104,400 $146,100 3 Net New Investments $(247,300) $(17,700) $(58,500) $170,000 $(61,600) New Investment Commitments in New Portfolio Companies 3 6 6 18 6 New Investment Commitments in Existing Portfolio Companies 3 4 3 7 5
Portfolio Company Exits 16 16 5 11 8 Weighted Average Yield at Cost on New Debt Investment Commitments 12.0% 12.6% 11.9% 13.1% 9.9% 1 Excludes the assets acquired in the OSI2 Merger. 2 New funded investment activity includes drawdowns on existing
revolver commitments. 3 Net new investments consists of new funded investment activity less proceeds from prepayments, exits, other paydowns and sales. 10
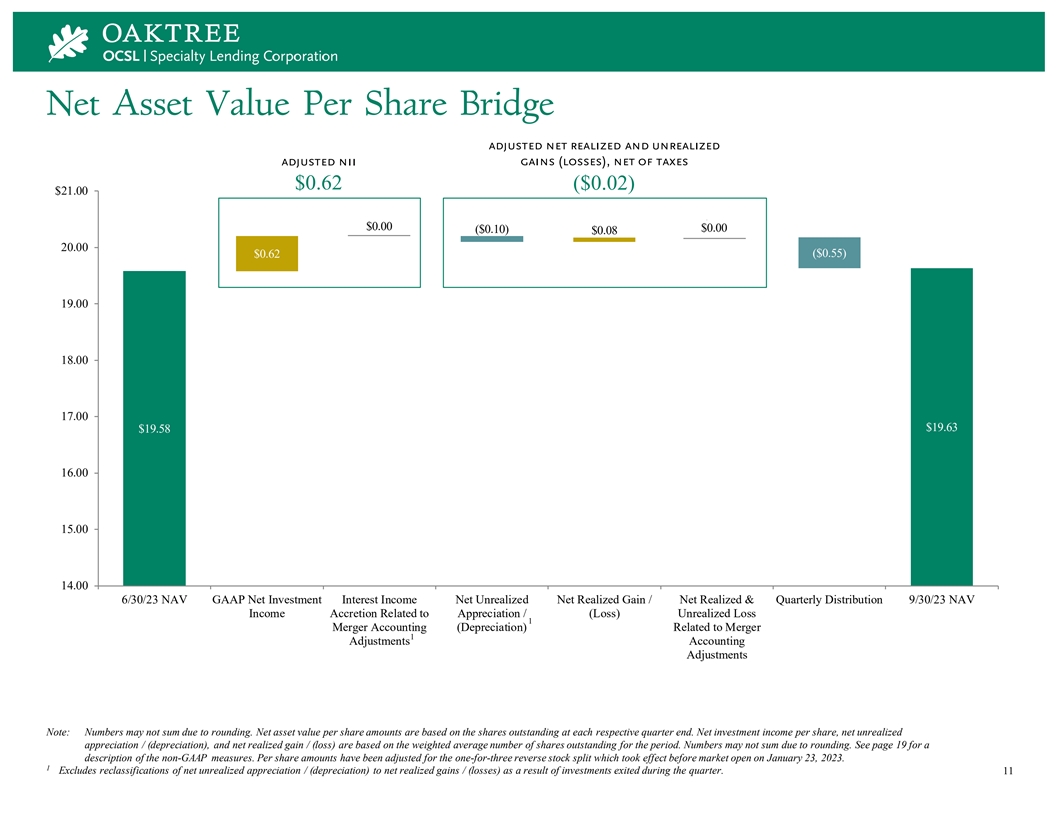
Net Asset Value Per Share Bridge adjusted net realized and unrealized
adjusted nii gains (losses), net of taxes $0.62 ($0.02) $21.00 $0.00 ($0. $0.00 00) $0.00 ($0.10) $0.08 20.00 ($0.55) $0.62 19.00 18.00 17.00 $19.63 $19.58 16.00 15.00 14.00 6/30/23 NAV GAAP Net Investment Interest Income Net Unrealized Net Realized
Gain / Net Realized & Quarterly Distribution 9/30/23 NAV Income Accretion Related to Appreciation / (Loss) Unrealized Loss 1 Merger Accounting (Depreciation) Related to Merger 1 Adjustments Accounting Adjustments Note: Numbers may not sum due to
rounding. Net asset value per share amounts are based on the shares outstanding at each respective quarter end. Net investment income per share, net unrealized appreciation / (depreciation), and net realized gain / (loss) are based on the weighted
average number of shares outstanding for the period. Numbers may not sum due to rounding. See page 19 for a description of the non-GAAP measures. Per share amounts have been adjusted for the one-for-three reverse stock split which took effect before
market open on January 23, 2023. 1 Excludes reclassifications of net unrealized appreciation / (depreciation) to net realized gains / (losses) as a result of investments exited during the quarter. 11
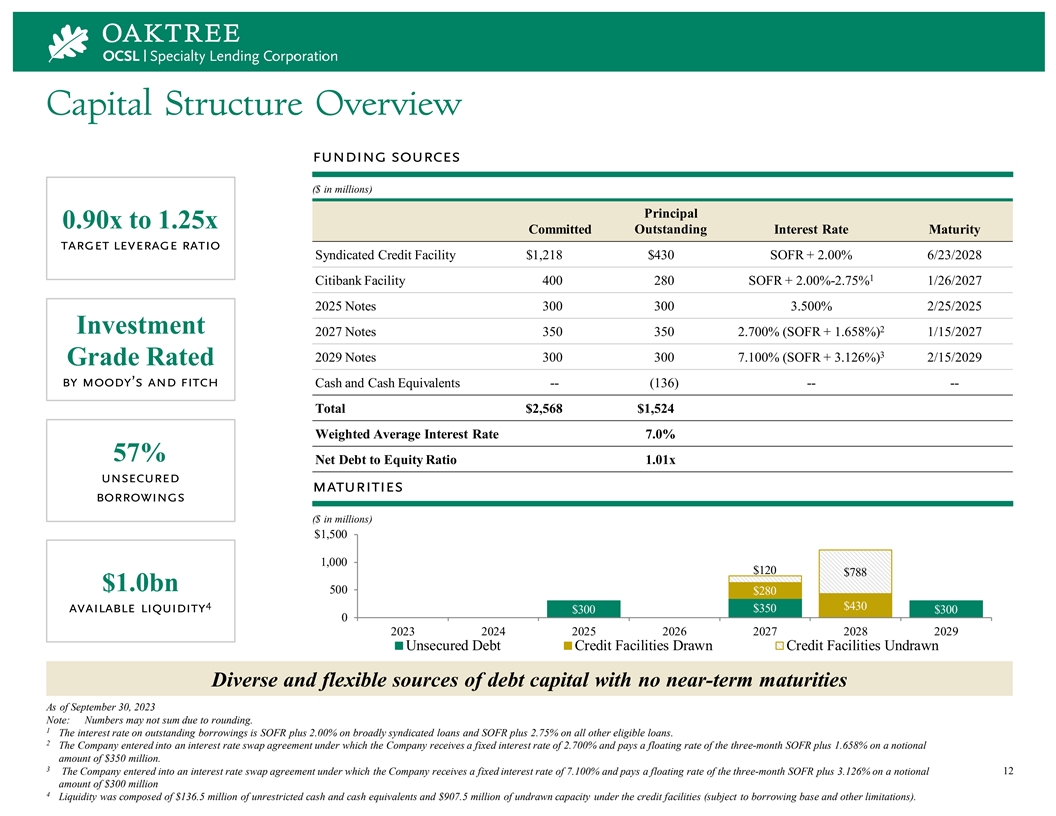
Capital Structure Overview funding sources ($ in millions) Principal
0.90x to 1.25x Committed Outstanding Interest Rate Maturity target leverage ratio Syndicated Credit Facility $1,218 $430 SOFR + 2.00% 6/23/2028 1 Citibank Facility 400 280 SOFR + 2.00%-2.75% 1/26/2027 2025 Notes 300 300 3.500% 2/25/2025 2 Investment
2027 Notes 350 350 2.700% (SOFR + 1.658%) 1/15/2027 3 2029 Notes 300 300 7.100% (SOFR + 3.126%) 2/15/2029 Grade Rated by moody’s and fitch Cash and Cash Equivalents -- (136) -- -- Total $2,568 $1,524 Weighted Average Interest Rate 7.0% 57% Net
Debt to Equity Ratio 1.01x unsecured maturities borrowings ($ in millions) $1,500 1,000 $120 $788 $1.0bn 500 $280 4 $430 available liquidity $350 $300 $300 0 2023 2024 2025 2026 2027 2028 2029 Unsecured Debt Credit Facilities Drawn Credit Facilities
Undrawn Diverse and flexible sources of debt capital with no near-term maturities As of September 30, 2023 Note: Numbers may not sum due to rounding. 1 The interest rate on outstanding borrowings is SOFR plus 2.00% on broadly syndicated loans and
SOFR plus 2.75% on all other eligible loans. 2 The Company entered into an interest rate swap agreement under which the Company receives a fixed interest rate of 2.700% and pays a floating rate of the three-month SOFR plus 1.658% on a notional
amount of $350 million. 3 The Company entered into an interest rate swap agreement under which the Company receives a fixed interest rate of 7.100% and pays a floating rate of the three-month SOFR plus 3.126% on a notional 12 amount of $300 million
4 Liquidity was composed of $136.5 million of unrestricted cash and cash equivalents and $907.5 million of undrawn capacity under the credit facilities (subject to borrowing base and other limitations).
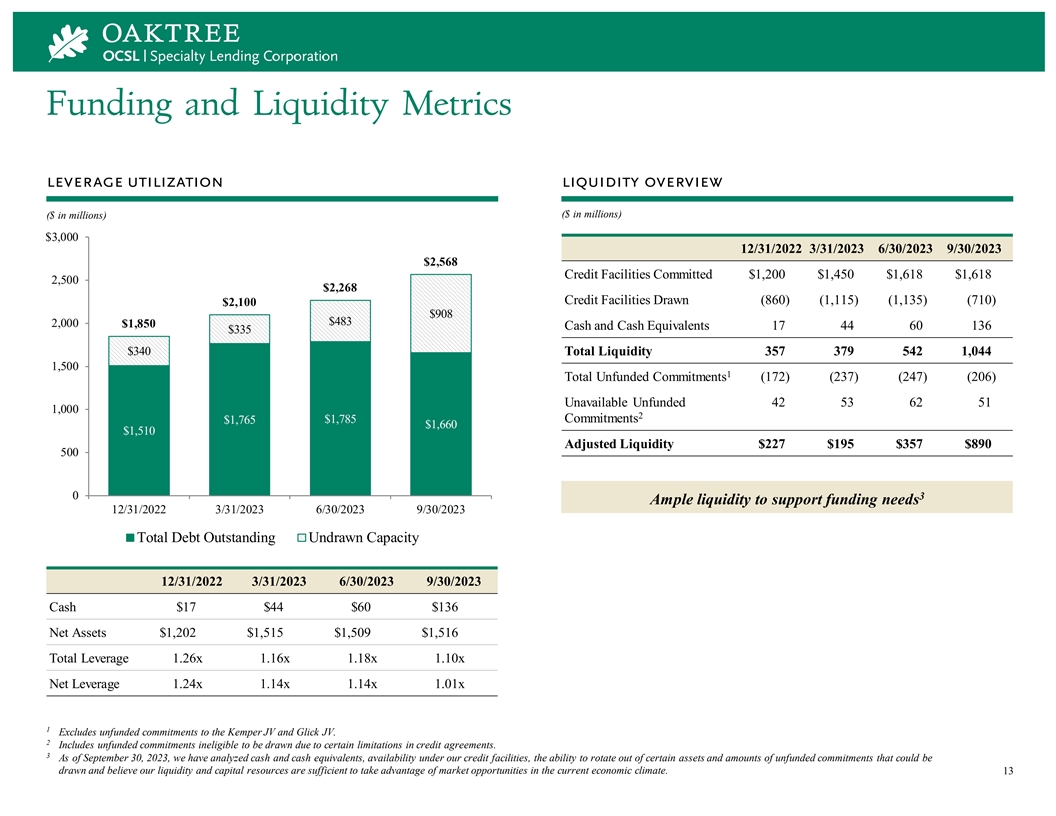
Funding and Liquidity Metrics leverage utilization liquidity overview
($ in millions) ($ in millions) $3,000 12/31/2022 3/31/2023 6/30/2023 9/30/2023 $2,568 Credit Facilities Committed $1,200 $1,450 $1,618 $1,618 2,500 $2,268 Credit Facilities Drawn (860) (1,115) (1,135) (710) $2,100 $908 $483 2,000 $1,850 Cash and
Cash Equivalents 17 44 60 136 $335 $340 Total Liquidity 357 379 542 1,044 1,500 1 Total Unfunded Commitments (172) (237) (247) (206) Unavailable Unfunded 42 53 62 51 1,000 2 $1,785 Commitments $1,765 $1,660 $1,510 Adjusted Liquidity $227 $195 $357
$890 500 0 3 Ample liquidity to support funding needs 12/31/2022 3/31/2023 6/30/2023 9/30/2023 Total Debt Outstanding Undrawn Capacity 12/31/2022 3/31/2023 6/30/2023 9/30/2023 Cash $17 $44 $60 $136 Net Assets $1,202 $1,515 $1,509 $1,516 Total
Leverage 1.26x 1.16x 1.18x 1.10x Net Leverage 1.24x 1.14x 1.14x 1.01x 1 Excludes unfunded commitments to the Kemper JV and Glick JV. 2 Includes unfunded commitments ineligible to be drawn due to certain limitations in credit agreements. 3 As of
September 30, 2023, we have analyzed cash and cash equivalents, availability under our credit facilities, the ability to rotate out of certain assets and amounts of unfunded commitments that could be drawn and believe our liquidity and capital
resources are sufficient to take advantage of market opportunities in the current economic climate. 13

Strategic Joint Ventures are Accretive to Earnings ocsl’s joint
ventures are income-enhancing vehicles that primarily invest in senior secured loans of middle market companies and other corporate debt securities Key Attributes of Joint Ventures: • Equity ownership: 87.5% OCSL and 12.5% joint venture
partner • Shared voting control: 50% OCSL and 50% joint venture partner kemper jv characteristics glick jv characteristics (At fair value) (At fair value) $142mm 4.9% $50mm 1.7% ocsl’s investments % of ocsl’s ocsl’s
investments % of ocsl’s in the kemper jv portfolio in the glick jv portfolio $5.4mm 15.2% $2.0mm 16.3% net investment return on ocsl’s net investment return on ocsl’s 1 3 2 3 income investment (annualized) income investment
(annualized) combined portfolio summary portfolio company wtd. avg. debt portfolio investment portfolio first lien leverage ratio count yield $446mm 96% 50 11.2% 1.2x As of September 30, 2023 1 Represents OCSL’s 87.5% share of the Kemper
JV’s net investment income (excluding subordinated note interest expense and deferred financing costs) earned during the quarter ended September 30, 2023. 14 2 Represents OCSL’s 87.5% share of the Glick JV’s net investment income
(excluding subordinated note interest expense and deferred financing costs) earned during the quarter ended September 30, 2023. 3 Calculated as OCSL’s share of each respective joint venture’s net investment income annualized, divided by
the fair value of OCSL’s investments in each joint venture as of June 30, 2023.

Compelling Performance Under Oaktree Management 1 nav and cumulative
distributions paid per share $30.00 25.00 $5.12 $5.60 $8.79 $4.65 $8.24 $7.69 $4.22 $6.09 $6.60 $7.14 $3.83 $3.47 $3.14 $2.25 $1.97 $1.68 $1.40 20.00 $0.42 $0.42 $0.42 $0.42 $2.82 $1.11 $0.54 $0.83 $0.26 $2.54 15.00 $22.03 $21.84 $21.78 $21.66
$21.27 $20.54 $20.67 $20.38 10.00 $19.79 $19.81 $19.82 $19.65 $19.63 $19.66 $19.58 $19.63 $19.47 $18.57 $18.26 $18.28 $17.84 $17.44 $17.61 $16.01 5.00 0.00 12/31/17 3/31/18 6/30/18 9/30/18 12/31/18 3/31/19 6/30/19 9/30/19 12/31/19 3/31/20 6/30/20
9/30/20 12/31/20 3/31/21 6/30/21 9/30/21 12/31/21 3/31/22 6/30/22 9/30/22 12/31/22 3/31/23 6/30/23 9/30/23 NAV Per Share Cumulative Special Distributions Paid Per Share Cumulative Quarterly Distributions Paid Per Share 2 OCSL has generated a 10.6%
annualized return on equity under Oaktree management Note: The Company completed a 1-for-3 reverse stock split on January 20, 2023, effective as of the commencement of trading on January 23, 2023. All share amounts and per share information included
in this presentation reflect the reverse stock split on a retroactive basis. 1 Cumulative distributions declared and paid from December 31, 2017 through September 30, 2023. 15 2 Annualized return on equity calculated as the change in net asset value
plus distributions paid from December 31, 2017 through September 30, 2023. Assumes dividends reinvested at NAV.
Appendix
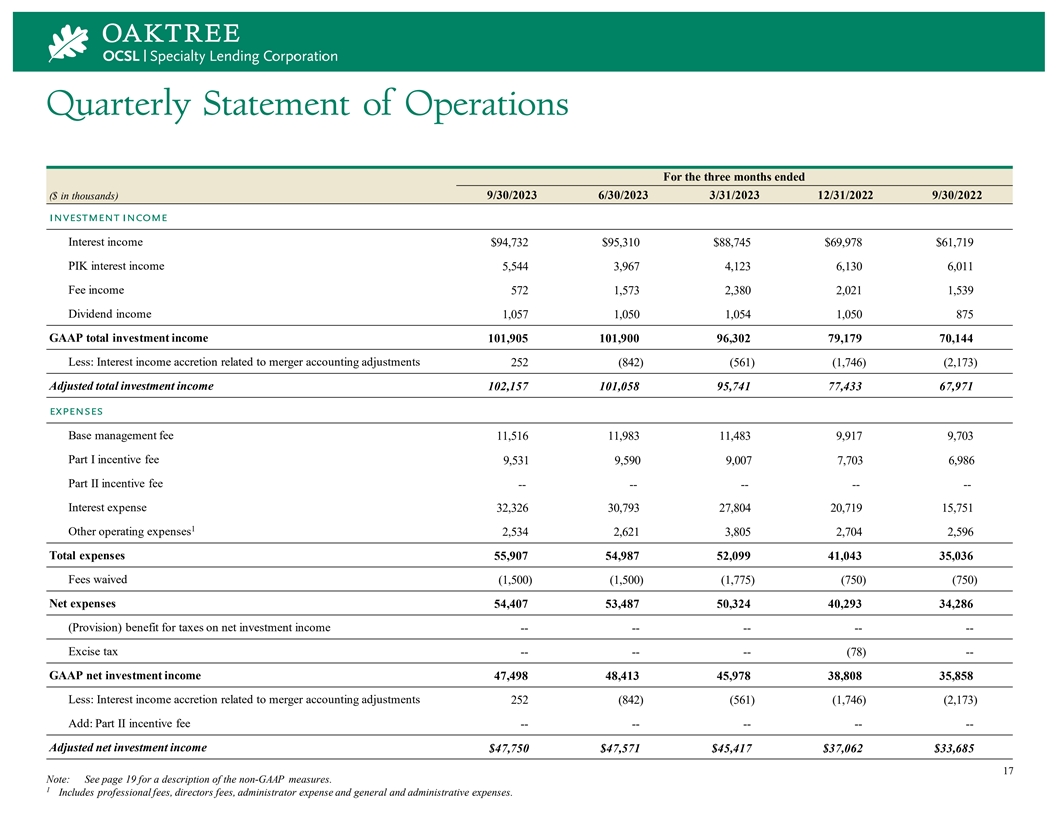
Quarterly Statement of Operations For the three months ended 9/30/2023
6/30/2023 3/31/2023 12/31/2022 9/30/2022 ($ in thousands) investment income Interest income $94,732 $95,310 $88,745 $69,978 $61,719 PIK interest income 5,544 3,967 4,123 6,130 6,011 Fee income 572 1,573 2,380 2,021 1,539 Dividend income 1,057 1,050
1,054 1,050 875 GAAP total investment income 101,905 101,900 96,302 79,179 70,144 Less: Interest income accretion related to merger accounting adjustments 252 (842) (561) (1,746) (2,173) Adjusted total investment income 102,157 101,058 95,741 77,433
67,971 expenses Base management fee 11,516 11,983 11,483 9,917 9,703 Part I incentive fee 9,531 9,590 9,007 7,703 6,986 Part II incentive fee -- -- -- -- -- Interest expense 32,326 30,793 27,804 20,719 15,751 1 Other operating expenses 2,534 2,621
3,805 2,704 2,596 Total expenses 55,907 54,987 52,099 41,043 35,036 Fees waived (1,500) (1,500) (1,775) (750) (750) Net expenses 54,407 53,487 50,324 40,293 34,286 (Provision) benefit for taxes on net investment income -- -- -- -- -- Excise tax --
-- -- (78) -- GAAP net investment income 47,498 48,413 45,978 38,808 35,858 Less: Interest income accretion related to merger accounting adjustments 252 (842) (561) (1,746) (2,173) Add: Part II incentive fee -- -- -- -- -- Adjusted net investment
income $47,750 $47,571 $45,417 $37,062 $33,685 17 Note: See page 19 for a description of the non-GAAP measures. 1 Includes professional fees, directors fees, administrator expense and general and administrative expenses.

Quarterly Statement of Operations (continued) For the three months
ended 9/30/2023 6/30/2023 3/31/2023 12/31/2022 9/30/2022 ($ in thousands, except per share amounts) net realized and unrealized gains (losses) Net unrealized appreciation (depreciation) $13,745 $(1,039) $(18,279) $(22,982) $(17,869) Net realized
gains (losses) (13,238) (10,603) (6,111) (3,203) (2,756) (Provision) benefit for taxes on realized and unrealized gains (losses) (2,053) (86) (66) 549 (2,025) GAAP net realized and unrealized gains (losses), net of taxes $(1,546) $(11,728) $(24,456)
$(25,636) $(22,650) Less: Net realized and unrealized losses (gains) related to merger accounting (122) 612 20,955 1,746 2,173 adjustments Adjusted net realized and unrealized gains (losses), net of taxes $(1,668) $(11,116) $(3,501) $(23,890)
$(20,477) GAAP net increase (decrease) in net assets resulting from operations $45,952 $36,685 $21,522 $13,172 $13,208 Less: Interest income accretion related to merger accounting adjustments 252 (842) (561) (1,746) (2,173) Less: Net realized and
unrealized losses (gains) related to merger accounting (122) 612 20,955 1,746 2,173 adjustments Adjusted earnings (loss) $46,082 $36,455 $41,916 $13,172 $13,208 per share data: GAAP total investment income $1.32 $1.32 $1.32 $1.30 $1.15 Adjusted
total investment income 1.32 1.31 1.31 1.27 1.11 GAAP net investment income 0.62 0.63 0.63 0.63 0.59 Adjusted net investment income 0.62 0.62 0.62 0.61 0.55 GAAP net realized and unrealized gains (losses), net of taxes (0.02) (0.15) (0.33) (0.42)
(0.37) Adjusted net realized and unrealized gains (losses), net of taxes (0.02) (0.14) (0.05) (0.39) (0.34) GAAP net increase/decrease in net assets resulting from operations 0.60 0.48 0.29 0.22 0.22 Adjusted earnings (loss) 0.60 0.47 0.57 0.22 0.22
Weighted average common shares outstanding 77,130 77,080 73,203 61,142 61,125 Shares outstanding, end of period 77,225 77,080 77,080 61,220 61,125 18 Note: See page 19 for a description of the non-GAAP measures. Per share amounts have been adjusted
for the one-for-three reverse stock split which took effect before market open on January 23, 2023.
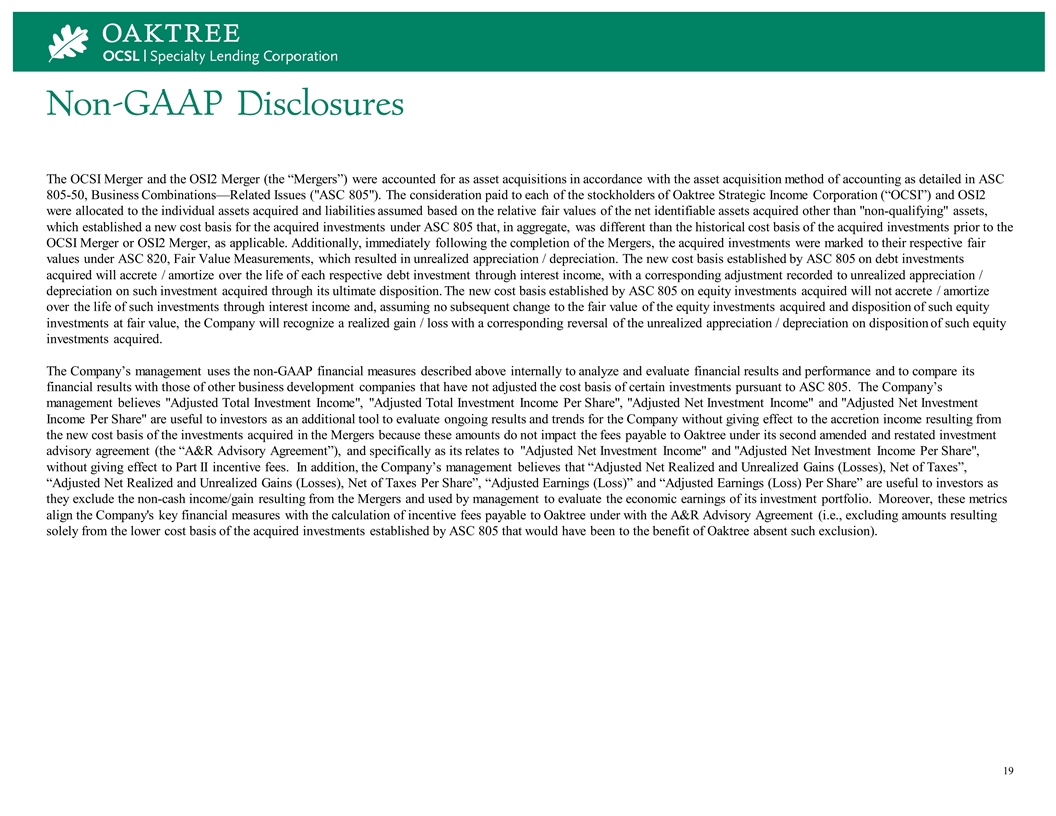
Non-GAAP Disclosures The OCSI Merger and the OSI2 Merger (the
“Mergers”) were accounted for as asset acquisitions in accordance with the asset acquisition method of accounting as detailed in ASC 805-50, Business Combinations—Related Issues ( ASC 805 ). The consideration paid to each of the
stockholders of Oaktree Strategic Income Corporation (“OCSI”) and OSI2 were allocated to the individual assets acquired and liabilities assumed based on the relative fair values of the net identifiable assets acquired other than
non-qualifying assets, which established a new cost basis for the acquired investments under ASC 805 that, in aggregate, was different than the historical cost basis of the acquired investments prior to the OCSI Merger or OSI2 Merger, as applicable.
Additionally, immediately following the completion of the Mergers, the acquired investments were marked to their respective fair values under ASC 820, Fair Value Measurements, which resulted in unrealized appreciation / depreciation. The new cost
basis established by ASC 805 on debt investments acquired will accrete / amortize over the life of each respective debt investment through interest income, with a corresponding adjustment recorded to unrealized appreciation / depreciation on such
investment acquired through its ultimate disposition. The new cost basis established by ASC 805 on equity investments acquired will not accrete / amortize over the life of such investments through interest income and, assuming no subsequent change
to the fair value of the equity investments acquired and disposition of such equity investments at fair value, the Company will recognize a realized gain / loss with a corresponding reversal of the unrealized appreciation / depreciation on
disposition of such equity investments acquired. The Company’s management uses the non-GAAP financial measures described above internally to analyze and evaluate financial results and performance and to compare its financial results with those
of other business development companies that have not adjusted the cost basis of certain investments pursuant to ASC 805. The Company’s management believes Adjusted Total Investment Income , Adjusted Total Investment Income Per Share ,
Adjusted Net Investment Income and Adjusted Net Investment Income Per Share are useful to investors as an additional tool to evaluate ongoing results and trends for the Company without giving effect to the accretion income resulting from the new
cost basis of the investments acquired in the Mergers because these amounts do not impact the fees payable to Oaktree under its second amended and restated investment advisory agreement (the “A&R Advisory Agreement”), and
specifically as its relates to Adjusted Net Investment Income and Adjusted Net Investment Income Per Share , without giving effect to Part II incentive fees. In addition, the Company’s management believes that “Adjusted Net Realized and
Unrealized Gains (Losses), Net of Taxes”, “Adjusted Net Realized and Unrealized Gains (Losses), Net of Taxes Per Share”, “Adjusted Earnings (Loss)” and “Adjusted Earnings (Loss) Per Share” are useful to
investors as they exclude the non-cash income/gain resulting from the Mergers and used by management to evaluate the economic earnings of its investment portfolio. Moreover, these metrics align the Company's key financial measures with the
calculation of incentive fees payable to Oaktree under with the A&R Advisory Agreement (i.e., excluding amounts resulting solely from the lower cost basis of the acquired investments established by ASC 805 that would have been to the benefit of
Oaktree absent such exclusion). 19

contact us: visit us: Investor Relations oaktreespecialtylending.com
Michael Mosticchio (212) 284-1900 ocsl-ir@oaktreecapital.com
v3.23.3
| X |
- DefinitionBoolean flag that is true when the XBRL content amends previously-filed or accepted submission.
| Name: |
dei_AmendmentFlag |
| Namespace Prefix: |
dei_ |
| Data Type: |
xbrli:booleanItemType |
| Balance Type: |
na |
| Period Type: |
duration |
|
| X |
- DefinitionFor the EDGAR submission types of Form 8-K: the date of the report, the date of the earliest event reported; for the EDGAR submission types of Form N-1A: the filing date; for all other submission types: the end of the reporting or transition period. The format of the date is YYYY-MM-DD.
| Name: |
dei_DocumentPeriodEndDate |
| Namespace Prefix: |
dei_ |
| Data Type: |
xbrli:dateItemType |
| Balance Type: |
na |
| Period Type: |
duration |
|
| X |
- DefinitionThe type of document being provided (such as 10-K, 10-Q, 485BPOS, etc). The document type is limited to the same value as the supporting SEC submission type, or the word 'Other'.
| Name: |
dei_DocumentType |
| Namespace Prefix: |
dei_ |
| Data Type: |
dei:submissionTypeItemType |
| Balance Type: |
na |
| Period Type: |
duration |
|
| X |
- DefinitionAddress Line 1 such as Attn, Building Name, Street Name
| Name: |
dei_EntityAddressAddressLine1 |
| Namespace Prefix: |
dei_ |
| Data Type: |
xbrli:normalizedStringItemType |
| Balance Type: |
na |
| Period Type: |
duration |
|
| X |
- DefinitionAddress Line 2 such as Street or Suite number
| Name: |
dei_EntityAddressAddressLine2 |
| Namespace Prefix: |
dei_ |
| Data Type: |
xbrli:normalizedStringItemType |
| Balance Type: |
na |
| Period Type: |
duration |
|
| X |
- Definition
+ References
+ Details
| Name: |
dei_EntityAddressCityOrTown |
| Namespace Prefix: |
dei_ |
| Data Type: |
xbrli:normalizedStringItemType |
| Balance Type: |
na |
| Period Type: |
duration |
|
| X |
- DefinitionCode for the postal or zip code
| Name: |
dei_EntityAddressPostalZipCode |
| Namespace Prefix: |
dei_ |
| Data Type: |
xbrli:normalizedStringItemType |
| Balance Type: |
na |
| Period Type: |
duration |
|
| X |
- DefinitionName of the state or province.
| Name: |
dei_EntityAddressStateOrProvince |
| Namespace Prefix: |
dei_ |
| Data Type: |
dei:stateOrProvinceItemType |
| Balance Type: |
na |
| Period Type: |
duration |
|
| X |
- DefinitionA unique 10-digit SEC-issued value to identify entities that have filed disclosures with the SEC. It is commonly abbreviated as CIK. Reference 1: http://www.xbrl.org/2003/role/presentationRef
-Publisher SEC
-Name Exchange Act
-Number 240
-Section 12
-Subsection b-2
| Name: |
dei_EntityCentralIndexKey |
| Namespace Prefix: |
dei_ |
| Data Type: |
dei:centralIndexKeyItemType |
| Balance Type: |
na |
| Period Type: |
duration |
|
| X |
- DefinitionIndicate if registrant meets the emerging growth company criteria. Reference 1: http://www.xbrl.org/2003/role/presentationRef
-Publisher SEC
-Name Exchange Act
-Number 240
-Section 12
-Subsection b-2
| Name: |
dei_EntityEmergingGrowthCompany |
| Namespace Prefix: |
dei_ |
| Data Type: |
xbrli:booleanItemType |
| Balance Type: |
na |
| Period Type: |
duration |
|
| X |
- DefinitionCommission file number. The field allows up to 17 characters. The prefix may contain 1-3 digits, the sequence number may contain 1-8 digits, the optional suffix may contain 1-4 characters, and the fields are separated with a hyphen.
| Name: |
dei_EntityFileNumber |
| Namespace Prefix: |
dei_ |
| Data Type: |
dei:fileNumberItemType |
| Balance Type: |
na |
| Period Type: |
duration |
|
| X |
- DefinitionTwo-character EDGAR code representing the state or country of incorporation.
| Name: |
dei_EntityIncorporationStateCountryCode |
| Namespace Prefix: |
dei_ |
| Data Type: |
dei:edgarStateCountryItemType |
| Balance Type: |
na |
| Period Type: |
duration |
|
| X |
- DefinitionThe exact name of the entity filing the report as specified in its charter, which is required by forms filed with the SEC. Reference 1: http://www.xbrl.org/2003/role/presentationRef
-Publisher SEC
-Name Exchange Act
-Number 240
-Section 12
-Subsection b-2
| Name: |
dei_EntityRegistrantName |
| Namespace Prefix: |
dei_ |
| Data Type: |
xbrli:normalizedStringItemType |
| Balance Type: |
na |
| Period Type: |
duration |
|
| X |
- DefinitionThe Tax Identification Number (TIN), also known as an Employer Identification Number (EIN), is a unique 9-digit value assigned by the IRS. Reference 1: http://www.xbrl.org/2003/role/presentationRef
-Publisher SEC
-Name Exchange Act
-Number 240
-Section 12
-Subsection b-2
| Name: |
dei_EntityTaxIdentificationNumber |
| Namespace Prefix: |
dei_ |
| Data Type: |
dei:employerIdItemType |
| Balance Type: |
na |
| Period Type: |
duration |
|
| X |
- DefinitionLocal phone number for entity.
| Name: |
dei_LocalPhoneNumber |
| Namespace Prefix: |
dei_ |
| Data Type: |
xbrli:normalizedStringItemType |
| Balance Type: |
na |
| Period Type: |
duration |
|
| X |
- DefinitionBoolean flag that is true when the Form 8-K filing is intended to satisfy the filing obligation of the registrant as pre-commencement communications pursuant to Rule 13e-4(c) under the Exchange Act. Reference 1: http://www.xbrl.org/2003/role/presentationRef
-Publisher SEC
-Name Exchange Act
-Number 240
-Section 13e
-Subsection 4c
| Name: |
dei_PreCommencementIssuerTenderOffer |
| Namespace Prefix: |
dei_ |
| Data Type: |
xbrli:booleanItemType |
| Balance Type: |
na |
| Period Type: |
duration |
|
| X |
- DefinitionBoolean flag that is true when the Form 8-K filing is intended to satisfy the filing obligation of the registrant as pre-commencement communications pursuant to Rule 14d-2(b) under the Exchange Act. Reference 1: http://www.xbrl.org/2003/role/presentationRef
-Publisher SEC
-Name Exchange Act
-Number 240
-Section 14d
-Subsection 2b
| Name: |
dei_PreCommencementTenderOffer |
| Namespace Prefix: |
dei_ |
| Data Type: |
xbrli:booleanItemType |
| Balance Type: |
na |
| Period Type: |
duration |
|
| X |
- DefinitionTitle of a 12(b) registered security. Reference 1: http://www.xbrl.org/2003/role/presentationRef
-Publisher SEC
-Name Exchange Act
-Number 240
-Section 12
-Subsection b
| Name: |
dei_Security12bTitle |
| Namespace Prefix: |
dei_ |
| Data Type: |
dei:securityTitleItemType |
| Balance Type: |
na |
| Period Type: |
duration |
|
| X |
- DefinitionName of the Exchange on which a security is registered. Reference 1: http://www.xbrl.org/2003/role/presentationRef
-Publisher SEC
-Name Exchange Act
-Number 240
-Section 12
-Subsection d1-1
| Name: |
dei_SecurityExchangeName |
| Namespace Prefix: |
dei_ |
| Data Type: |
dei:edgarExchangeCodeItemType |
| Balance Type: |
na |
| Period Type: |
duration |
|
| X |
- DefinitionBoolean flag that is true when the Form 8-K filing is intended to satisfy the filing obligation of the registrant as soliciting material pursuant to Rule 14a-12 under the Exchange Act. Reference 1: http://www.xbrl.org/2003/role/presentationRef
-Publisher SEC
-Name Exchange Act
-Section 14a
-Number 240
-Subsection 12
| Name: |
dei_SolicitingMaterial |
| Namespace Prefix: |
dei_ |
| Data Type: |
xbrli:booleanItemType |
| Balance Type: |
na |
| Period Type: |
duration |
|
| X |
- DefinitionTrading symbol of an instrument as listed on an exchange.
| Name: |
dei_TradingSymbol |
| Namespace Prefix: |
dei_ |
| Data Type: |
dei:tradingSymbolItemType |
| Balance Type: |
na |
| Period Type: |
duration |
|
| X |
- DefinitionBoolean flag that is true when the Form 8-K filing is intended to satisfy the filing obligation of the registrant as written communications pursuant to Rule 425 under the Securities Act. Reference 1: http://www.xbrl.org/2003/role/presentationRef
-Publisher SEC
-Name Securities Act
-Number 230
-Section 425
| Name: |
dei_WrittenCommunications |
| Namespace Prefix: |
dei_ |
| Data Type: |
xbrli:booleanItemType |
| Balance Type: |
na |
| Period Type: |
duration |
|
Grafico Azioni Oaktree Specialty Lending (NASDAQ:OCSL)
Storico
Da Mag 2024 a Giu 2024

Grafico Azioni Oaktree Specialty Lending (NASDAQ:OCSL)
Storico
Da Giu 2023 a Giu 2024
