Aptos Following SUI’s Lead? Analyst Says APT’s ‘Explosive Breakout’ Targets $20
20 Novembre 2024 - 1:00PM
NEWSBTC
Aptos (APT) recorded a 37.6% surge in the last two weeks,
reclaiming its Q1 levels. According to some market watchers, the
cryptocurrency’s recent performance follows SUI’s lead, which has
set the stage for a massive rally toward a new all-time high (ATH)
in the coming weeks. Related Reading: Bitcoin ‘Parabolic Phase Just
Begun’, Is BTC Hitting $100,000 This Week? Aptos To Follow SUI
Steps Aptos has recorded a remarkable performance amid the market’s
rally. Following the US presidential elections, the cryptocurrency
has climbed from the $7.8 mark to reclaim the $11 support zone for
the first time since late April. According to some crypto analysts,
APT’s chart displays a similar trajectory to SUI’s. Analyst Alex
Clay pointed out APT’s performance is “following SUI steps
perfectly,” suggesting that a breakout might be coming soon. Per
Clay’s post, Aptos’s chart displays the same price action as SUI,
starting with a decline from its 2023 highs followed by a rise
toward March’s highs. After Q1’s performance, the cryptocurrencies
retraced over 70%, making a higher low (HL) from last year’s bottom
and rising near March highs. However, SUI took the lead and is
currently in its “price discovery mode” after surpassing its March
ATH a month ago. In the last month, the token surpassed its
previous high several times, setting its latest ATH of $3.92 two
days ago. Based on this, the analyst suggests that investors should
“wait for APT to breakout and price discovery.” Another market
watcher previously noted that SUI and APT were moving in a
“catch-up trade” path for the last year. The trader explained that
the cryptocurrencies followed a similar path before SUI “decoupled”
twice. Following SUI’s takeoff, APT experienced an over 40-day
lagging period before resuming its run. At the time of the report,
Aptos was two weeks away from catching up on SUI, which now
coincided with the post-election run. An SUI-like breakout could
see APT surpass the $18 mark and soar toward a price discovery zone
above the $20 range. APT Eyes $20 Target Crypto analyst Quinten
highlighted APT’s recent performance, asserting that it is
“reclaiming its dominance, printing consistent higher highs and
higher lows.” He also noted that the token’s chart shows “strong
accumulation leading up to this explosive breakout.” Last week, the
token soared over 40% toward its monthly high of $13.3, a level not
seen in seven months. Since then, the cryptocurrency has moved
sideways, consolidating between the $11.5-$12.6 price range,
briefly losing the lower range when Bitcoin (BTC) retraced toward
$87,000. Related Reading: Crypto Analyst Warns of Potential Bitcoin
Market Shift as Exchange Reserves Decline The $11 mark was a
significant resistance throughout Q3, with APT being rejected from
this range several times. However, the token has successfully held
above this level for seven days. As a result, the analyst believes
the current momentum could send Aptos to a new ATH, as the “next
big psychological and technical target” is at the $20 mark. At the
time of writing, APT is trading at $11.79, a 2.2% decline in the
daily timeframe. Featured Image from Unsplash.com, Chart from
TradingView.com
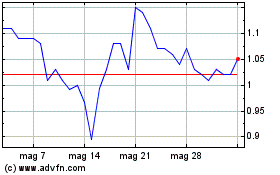
Grafico Azioni SUI Network (COIN:SUIUSD)
Storico
Da Mar 2025 a Apr 2025

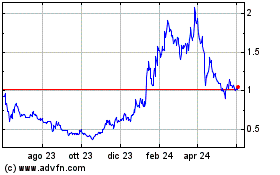
Grafico Azioni SUI Network (COIN:SUIUSD)
Storico
Da Apr 2024 a Apr 2025
