Pay vs Performance Disclosure - USD ($)
|
12 Months Ended |
Dec. 31, 2023 |
Dec. 31, 2022 |
Dec. 31, 2021 |
| Pay vs Performance Disclosure |
|
|
|
| Pay vs Performance Disclosure, Table |
| | | | | | | | | | | | | | | | | | | | | | | | | | | | | | | | | | | | | | | Value of Initial Fixed $100 | | | | | | | | | | | | | | | | | | | | | Investment Based on: | | | | | | | | | Summary | | | | | Average Summary | | Average | | | | Peer | | | | | | | | | Compensation | | Compensation | | Compensation | | Compensation | | Total | | Group Total | | | | | | | | | Table Total | | Actually Paid | | Table Total | | Actually Paid | | Shareholder | | Shareholder | | Net Income (7) | | PPNR (8) | Year | | for CEO (1) | | to CEO (2) | | for Non-CEO NEOs (3) | | to Non-CEO NEOs (4) | | Return (5) | | Return (6) | | (in thousands) | | (in thousands) | 2023 | | $ | 1,266,346 | | $ | 667,636 | | $ | 699,763 | | $ | 456,725 | | $ | 108.25 | | $ | 126.63 | | $ | 39,960 | | $ | 51,588 | 2022 | | | 1,779,841 | | | 1,930,993 | | | 874,577 | | | 910,271 | | | 142.03 | | | 118.42 | | | 53,392 | | | 79,736 | 2021 | | | 1,524,384 | | | 2,210,043 | | | 868,675 | | | 1,340,822 | | | 141.63 | | | 141.27 | | | 45,687 | | | 67,117 |
| (1) | Amount represents the total compensation of the Company's CEO, Jerry Baack, as reported in the Summary Compensation Table for each year indicated. Refer to the "Summary Compensation Table" above. |
| (2) | Amount represents the amount of CAP to Mr. Baack, as computed in accordance with Item 402(v) of Regulation S-K. In accordance with the requirements of Item 402(v) of Regulation S-K, the following adjustments were made to Mr. Baack’s total compensation for each year to determine the CAP: |
| | | | | | | | | | | | 2023 | | 2022 | | 2021 | Total Compensation from Summary Compensation Table | | $ | 1,266,346 | | $ | 1,779,841 | | $ | 1,524,384 | Adjustment for Grant Date Values in the Summary Compensation Table | | | (351,679) | | | (528,339) | | | (317,976) | Year-end Fair Value of Unvested Awards Granted in the Current Year | | | 304,984 | | | 661,830 | | | 323,090 | Year-over-year Difference of Year-end Fair Values for Unvested Awards Granted in Prior Years | | | (298,858) | | | 11,104 | | | 420,439 | Differences in Fair Values Between Prior Year-end Fair Values and Vest Date Fair Values for Awards Granted in Prior Years | | | (253,157) | | | 6,557 | | | 260,106 | Compensation Actually Paid (as calculated) | | $ | 667,636 | | $ | 1,930,993 | | $ | 2,210,043 |
| (3) | Amount represents the average of the total compensation of each of the Company's non-CEO NEOs as reported in the Summary Compensation Table for each year indicated. The individuals comprising the non-CEO NEOs for each year are listed below: |
| | | | | | | 2023 | | | 2022 | | | 2021 | Jeff Shellberg | | | Jeff Shellberg | | | Jeff Shellberg | Mary Jayne Crocker | | | Mary Jayne Crocker | | | Mary Jayne Crocker | Joseph Chybowski | | | Joseph Chybowski | | | | Nick Place | | | Nick Place | | | |
| (4) | Amount represents the average of the total CAP to other named non-CEO NEOs of the Company as reported in the Summary Compensation Table, as computed in accordance with Item 402(v) of Regulation S-K. In accordance with the requirements of Item 402(v) of Regulation S-K, the following adjustments were made to average total compensation for the non-CEO NEOs as a group for each year to determine the CAP: |
| | | | | | | | | | | | 2023 | | 2022 | | 2021 | Total Compensation from Summary Compensation Table | | $ | 699,763 | | $ | 874,577 | | $ | 868,675 | Adjustment for Grant Date Values in the Summary Compensation Table | | | (178,342) | | | (184,918) | | | (178,453) | Year-end Fair Value of Unvested Awards Granted in the Current Year | | | 154,662 | | | 231,641 | | | 181,323 | Year-over-year Difference of Year-end Fair Values for Unvested Awards Granted in Prior Years | | | (114,547) | | | 4,294 | | | 271,314 | Differences in Fair Values Between Prior Year-end Fair Values and Vest Date Fair Values for Awards Granted in Prior Years | | | (104,811) | | | (15,323) | | | 197,963 | Compensation Actually Paid (as calculated) | | $ | 456,725 | | $ | 910,271 | | $ | 1,340,822 |
| (5) | Amount represents the cumulative three-year total return to shareholders of the Company's common stock and assumes that the value of the investment was $100 on December 31, 2020 and that any subsequent dividends were reinvested. The stock price performance included in this column is not necessarily indicative of future stock price performance. |
| (6) | Reflects the cumulative total shareholder return of the Nasdaq Bank Index. This is the peer group used by the Company as reflected on Form 10-K of the Company's consolidated financial statements for the year ended December 31, 2023. |
| (7) | Net Income reflected represents GAAP Net Income as reported on Form 10-K of the Company's consolidated financial statements. |
| (8) | Pre-Provision Net Revenue (or “PPNR”) is the Company-Selected Measure. For further detail, see the “Compensation Discussion and Analysis” section in this proxy statement. PPNR is a non-GAAP financial measure. See “GAAP Reconciliation and Management Explanation of Non-GAAP Financial Measures” in the accompanying 2023 Form 10-K for further details. |
|
|
|
| Company Selected Measure Name |
Pre-Provision Net Revenue (or “PPNR”)
|
|
|
| Named Executive Officers, Footnote |
| (3) | Amount represents the average of the total compensation of each of the Company's non-CEO NEOs as reported in the Summary Compensation Table for each year indicated. The individuals comprising the non-CEO NEOs for each year are listed below: |
| | | | | | | 2023 | | | 2022 | | | 2021 | Jeff Shellberg | | | Jeff Shellberg | | | Jeff Shellberg | Mary Jayne Crocker | | | Mary Jayne Crocker | | | Mary Jayne Crocker | Joseph Chybowski | | | Joseph Chybowski | | | | Nick Place | | | Nick Place | | | |
|
|
|
| Peer Group Issuers, Footnote |
| (6) | Reflects the cumulative total shareholder return of the Nasdaq Bank Index. This is the peer group used by the Company as reflected on Form 10-K of the Company's consolidated financial statements for the year ended December 31, 2023. |
|
|
|
| PEO Total Compensation Amount |
$ 1,266,346
|
$ 1,779,841
|
$ 1,524,384
|
| PEO Actually Paid Compensation Amount |
$ 667,636
|
1,930,993
|
2,210,043
|
| Adjustment To PEO Compensation, Footnote |
| (2) | Amount represents the amount of CAP to Mr. Baack, as computed in accordance with Item 402(v) of Regulation S-K. In accordance with the requirements of Item 402(v) of Regulation S-K, the following adjustments were made to Mr. Baack’s total compensation for each year to determine the CAP: |
| | | | | | | | | | | | 2023 | | 2022 | | 2021 | Total Compensation from Summary Compensation Table | | $ | 1,266,346 | | $ | 1,779,841 | | $ | 1,524,384 | Adjustment for Grant Date Values in the Summary Compensation Table | | | (351,679) | | | (528,339) | | | (317,976) | Year-end Fair Value of Unvested Awards Granted in the Current Year | | | 304,984 | | | 661,830 | | | 323,090 | Year-over-year Difference of Year-end Fair Values for Unvested Awards Granted in Prior Years | | | (298,858) | | | 11,104 | | | 420,439 | Differences in Fair Values Between Prior Year-end Fair Values and Vest Date Fair Values for Awards Granted in Prior Years | | | (253,157) | | | 6,557 | | | 260,106 | Compensation Actually Paid (as calculated) | | $ | 667,636 | | $ | 1,930,993 | | $ | 2,210,043 |
|
|
|
| Non-PEO NEO Average Total Compensation Amount |
$ 699,763
|
874,577
|
868,675
|
| Non-PEO NEO Average Compensation Actually Paid Amount |
$ 456,725
|
910,271
|
1,340,822
|
| Adjustment to Non-PEO NEO Compensation Footnote |
| (4) | Amount represents the average of the total CAP to other named non-CEO NEOs of the Company as reported in the Summary Compensation Table, as computed in accordance with Item 402(v) of Regulation S-K. In accordance with the requirements of Item 402(v) of Regulation S-K, the following adjustments were made to average total compensation for the non-CEO NEOs as a group for each year to determine the CAP: |
| | | | | | | | | | | | 2023 | | 2022 | | 2021 | Total Compensation from Summary Compensation Table | | $ | 699,763 | | $ | 874,577 | | $ | 868,675 | Adjustment for Grant Date Values in the Summary Compensation Table | | | (178,342) | | | (184,918) | | | (178,453) | Year-end Fair Value of Unvested Awards Granted in the Current Year | | | 154,662 | | | 231,641 | | | 181,323 | Year-over-year Difference of Year-end Fair Values for Unvested Awards Granted in Prior Years | | | (114,547) | | | 4,294 | | | 271,314 | Differences in Fair Values Between Prior Year-end Fair Values and Vest Date Fair Values for Awards Granted in Prior Years | | | (104,811) | | | (15,323) | | | 197,963 | Compensation Actually Paid (as calculated) | | $ | 456,725 | | $ | 910,271 | | $ | 1,340,822 |
|
|
|
| Compensation Actually Paid vs. Total Shareholder Return |
CEO and Average Non-CEO NEO CAP vs Cumulative TSR and Cumulative TSR of the Peer Group 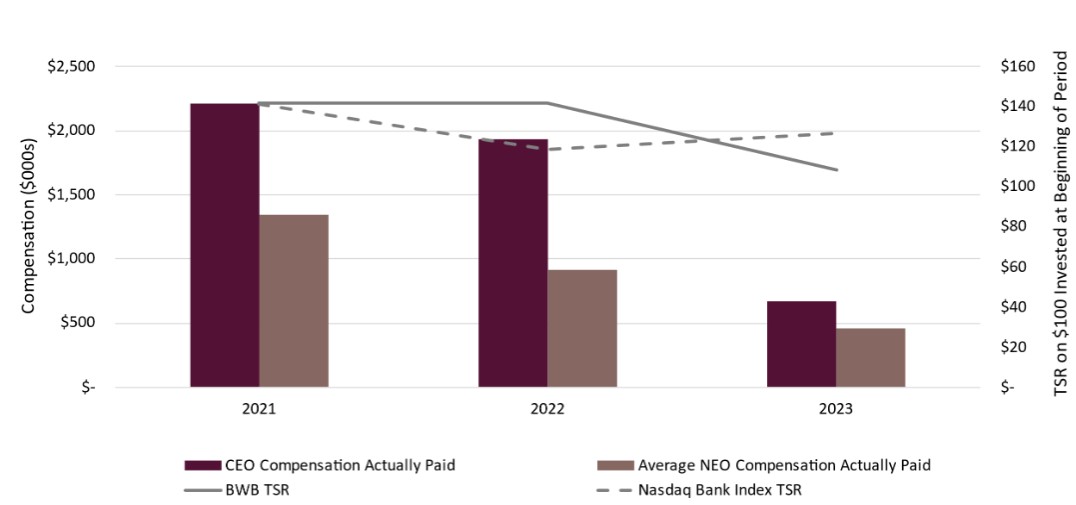
|
|
|
| Compensation Actually Paid vs. Net Income |
CEO and Average Non-CEO NEO CAP vs the Company’s Net Income 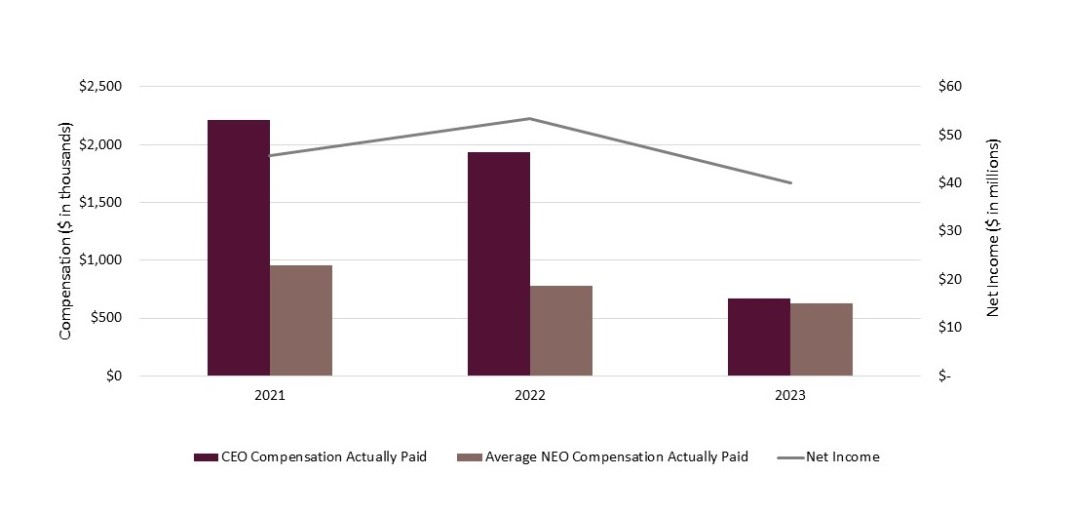
|
|
|
| Compensation Actually Paid vs. Company Selected Measure |
CEO and Average Non-CEO NEO CAP vs PPNR 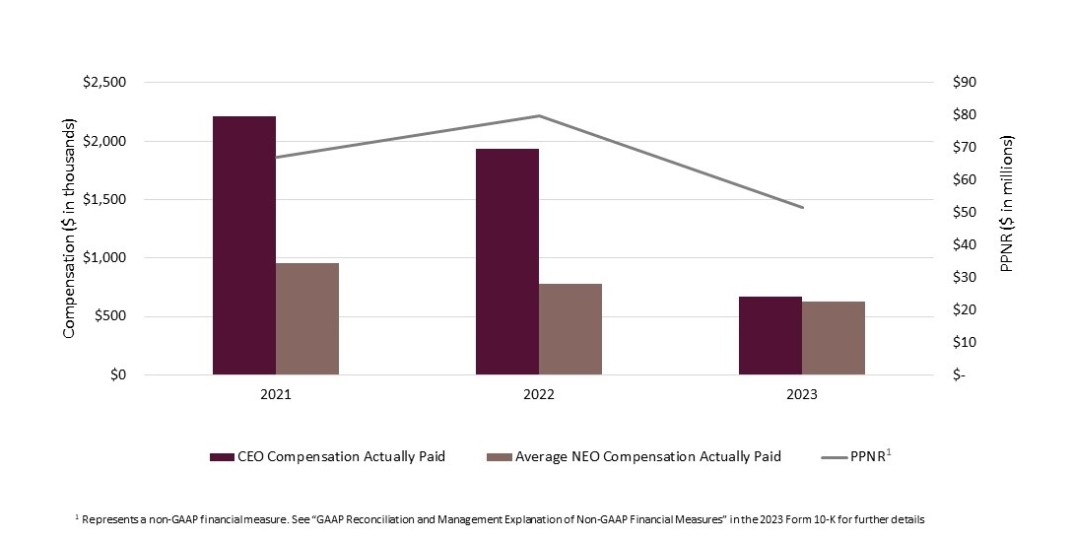
|
|
|
| Total Shareholder Return Amount |
$ 108.25
|
142.03
|
141.63
|
| Peer Group Total Shareholder Return Amount |
126.63
|
118.42
|
141.27
|
| Net Income (Loss) |
$ 39,960,000
|
$ 53,392,000
|
$ 45,687,000
|
| Company Selected Measure Amount |
51,588,000
|
79,736,000
|
67,117,000
|
| PEO Name |
Jerry Baack
|
|
|
| Measure:: 1 |
|
|
|
| Pay vs Performance Disclosure |
|
|
|
| Name |
Earnings per share
|
|
|
| Measure:: 2 |
|
|
|
| Pay vs Performance Disclosure |
|
|
|
| Name |
Return on average assets
|
|
|
| Measure:: 3 |
|
|
|
| Pay vs Performance Disclosure |
|
|
|
| Name |
PPNR
|
|
|
| Non-GAAP Measure Description |
| (8) | Pre-Provision Net Revenue (or “PPNR”) is the Company-Selected Measure. For further detail, see the “Compensation Discussion and Analysis” section in this proxy statement. PPNR is a non-GAAP financial measure. See “GAAP Reconciliation and Management Explanation of Non-GAAP Financial Measures” in the accompanying 2023 Form 10-K for further details. |
|
|
|
| Measure:: 4 |
|
|
|
| Pay vs Performance Disclosure |
|
|
|
| Name |
Return on average tangible common equity
|
|
|
| Measure:: 5 |
|
|
|
| Pay vs Performance Disclosure |
|
|
|
| Name |
Net charge-offs
|
|
|
| Measure:: 6 |
|
|
|
| Pay vs Performance Disclosure |
|
|
|
| Name |
Nonperforming assets
|
|
|
| Measure:: 7 |
|
|
|
| Pay vs Performance Disclosure |
|
|
|
| Name |
Tangible book value per share growth
|
|
|
| PEO | Adjustment for Grant Date Values in the Summary Compensation Table |
|
|
|
| Pay vs Performance Disclosure |
|
|
|
| Adjustment to Compensation, Amount |
$ (351,679)
|
$ (528,339)
|
$ (317,976)
|
| PEO | Year-end Fair Value of Unvested Awards Granted in the Current Year |
|
|
|
| Pay vs Performance Disclosure |
|
|
|
| Adjustment to Compensation, Amount |
304,984
|
661,830
|
323,090
|
| PEO | Year-over-year Difference of Year-end Fair Values for Unvested Awards Granted in Prior Years |
|
|
|
| Pay vs Performance Disclosure |
|
|
|
| Adjustment to Compensation, Amount |
(298,858)
|
11,104
|
420,439
|
| PEO | Differences in Fair Values Between Prior Year-end Fair Values and Vest Date Fair Values for Awards Granted in Prior Years |
|
|
|
| Pay vs Performance Disclosure |
|
|
|
| Adjustment to Compensation, Amount |
(253,157)
|
6,557
|
260,106
|
| Non-PEO NEO | Adjustment for Grant Date Values in the Summary Compensation Table |
|
|
|
| Pay vs Performance Disclosure |
|
|
|
| Adjustment to Compensation, Amount |
(178,342)
|
(184,918)
|
(178,453)
|
| Non-PEO NEO | Year-end Fair Value of Unvested Awards Granted in the Current Year |
|
|
|
| Pay vs Performance Disclosure |
|
|
|
| Adjustment to Compensation, Amount |
154,662
|
231,641
|
181,323
|
| Non-PEO NEO | Year-over-year Difference of Year-end Fair Values for Unvested Awards Granted in Prior Years |
|
|
|
| Pay vs Performance Disclosure |
|
|
|
| Adjustment to Compensation, Amount |
(114,547)
|
4,294
|
271,314
|
| Non-PEO NEO | Differences in Fair Values Between Prior Year-end Fair Values and Vest Date Fair Values for Awards Granted in Prior Years |
|
|
|
| Pay vs Performance Disclosure |
|
|
|
| Adjustment to Compensation, Amount |
$ (104,811)
|
$ (15,323)
|
$ 197,963
|
