Pay vs Performance Disclosure
|
1 Months Ended |
2 Months Ended |
11 Months Ended |
12 Months Ended |
Feb. 06, 2024 |
Feb. 14, 2022 |
Dec. 31, 2024 |
Dec. 31, 2022 |
Dec. 31, 2024
USD ($)
|
Dec. 31, 2023
USD ($)
|
Dec. 31, 2022
USD ($)
|
Dec. 31, 2021
USD ($)
|
Dec. 31, 2020
USD ($)
|
| Pay vs Performance Disclosure |
|
|
|
|
|
|
|
|
|
| Pay vs Performance Disclosure, Table |
|
|
|
|
Pay versus Performance (“PvP”) As required by Item 402(v) of Regulation S-K, we are providing the following information regarding the relationship between executive compensation and our financial performance for each of the last four completed calendar years. In determining the “Compensation Actually Paid” (“CAP”) to our NEOs, we are required to make various adjustments to amounts that have been previously reported in the Summary Compensation Table (“SCT”) in previous years, as the SEC’s valuation methods for this section differ from those required in the SCT. The PvP table below summarizes compensation values both previously reported in our SCT, as well as the adjusted values required in this section for the 2020, 2021, 2022, 2023 and 2024 calendar years. Note that for our NEOs other than our Chief Executive Officer (the “CEO”), compensation is reported as an average. The Human Capital & Compensation Committee does not utilize CAP as the basis for making compensation decisions, and it evaluates performance for purposes of incentive payouts using a more comprehensive set of metrics than required by the SEC for purposes of this disclosure. | | | | | | | | | | | | | | | | | | | (a) | | | (b) | | | (c) | | | (d) | | | (e) | | | (f) | | | (g) | 2024 | | | 24,154,267 | | | 5,080,283 | | | | | | 25,111,718 | | | 339,713 | | | | 2023 | | | | | | 10,747,653 | | | | | | | | | 2,413,620 | | | | 2022 | | | | | | 19,271,654 | | | 11,800,037 | | | | | | 15,327,178 | | | 8,911,848 | 2021 | | | | | | | | | 9,767,380 | | | | | | | | | 12,525,503 | 2020 | | | | | | | | | 7,731,147 | | | | | | | | | 4,403,472 | | | | | | | | | | | | | | | | | | | |
| | | | | | | | | | | | | | | | (a) | | | (h) | | | (i) | | | (j) | | | (k) | | | (l) | | | (m) | 2024 | | | 3,593,925 | | | 3,320,758 | | | 75 | | | 126 | | | 243 | | | 1.1% | 2023 | | | 3,333,676 | | | 2,283,835 | | | 71 | | | 127 | | | (2,567) | | | (1.4)% | 2022 | | | 5,369,203 | | | 3,743,462 | | | 88 | | | 110 | | | (1,871) | | | 9.3% | 2021 | | | 3,148,004 | | | 3,170,578 | | | 123 | | | 151 | | | 270 | | | 7.8% | 2020 | | | 2,060,046 | | | 1,286,913 | | | 87 | | | 117 | | | 363 | | | —% | | | | | | | | | | | | | | | | | | | |
(1)
| Mr. Fyrwald joined as our CEO on February 6, 2024. Mr. Clyburn ceased serving as our CEO and as a director of the Board as of February 6, 2024 and departed the company on March 31, 2024. Mr. Clyburn joined as our CEO and as a director of the Board on February 14, 2022. Mr. Andreas Fibig ceased serving as our CEO and as a director and Chair of the Board as of February 14, 2022 and departed the company on March 14, 2022. |
(2)
| Non-CEO NEOs for 2024 were: Mr. Glenn Richter, Mr. Yuvraj Arora, Mr. Simon Herriott and Ms. Jennifer Johnson. |
(3)
| Non-CEO NEOs for 2023 were: Mr. Glenn Richter, Mr. Yuvraj Arora, Mr. Simon Herriott and Ms. Jennifer Johnson. |
(4)
| Non-CEO NEOs for 2022 were: Mr. Glenn Richter, Mr. Nicolas Mirzayantz (Former President, Nourish), Ms. Deborah Borg (EVP, Chief People & Culture Officer), Mr. Ralf Finzel (EVP, Global Operations Officer) and Mr. Francisco Fortanet (Former EVP, Global Operations Officer). |
(5)
| Non-CEO NEOs for 2021 were: Mr. Glenn Richter, Mr. Nicolas Mirzayantz, Mr. Francisco Fortanet, Dr. Susana Suarez Gonzalez (Former EVP, Chief Human Resources, Communication and DE&I Officer), Mr. Rustom Jilla (Former CFO), Ms. Kathy Fortmann (Former President, Nourish) and Ms. Anne Chwat (Former General Counsel). |
(6)
| Non-CEO NEOs for 2020 were: Mr. Nicolas Mirzayantz, Mr. Rustom Jilla, Ms. Anne Chwat, Mr. Matthias Hanei (Former Division CEO, Taste) and Mr. Richard O’Leary (Former CFO). |
(7)
| The Peer Group used for this calculation was the S&P 500 Specialty Chemicals Index which is also reported on Form 10-K in the Performance Graph. |
(8)
| Net Income (Loss) reflected represents GAAP Net Income (Loss) as reported on Form 10-K in the Results of Operations Statement. The 2024 Net income of $243 million reflects a $64 million impairment of goodwill in the Pharma Solutions Disposal Group reporting unit. Excluding all one-time adjustments for 2024, the Adjusted Net Income was $307 million. |
(9)
| Currency Neutral Sales Growth is the company-selected performance measure, per the requirements of Item 402(v) of Regulation S-K and is discussed and reported in “Compensation Discussion and Analysis - 2024 Direct Compensation.” |
Mr. Fyrwald’s Compensation To determine the amounts in column (e) in the PvP table, the following amounts were deducted from and added to (as applicable) Mr. Fyrwald’s total compensation as reported in the SCT, in accordance with Item 402(v) of Regulation S-K. | | | | | | | | | | | | | | | | | | | 2024 | | | 24,154,267 | | | (19,182,546) | | | 20,139,997 | | | — | | | — | | | 25,111,718 | | | | | | | | | | | | | | | | | | | |
(1)
| Represents the year-over-year change in the fair value of equity awards to Mr. Fyrwald as summarized below: |
| | | | | | | | | | | | | | | | | | | | | | 2024 | | | 20,139,997 | | | — | | | — | | | — | | | — | | | — | | | 20,139,997 | | | | | | | | | | | | | | | | | | | | | | |
In the table above, the unvested equity values are computed in accordance with the methodology used for financial reporting purposes, and for unvested awards subject to performance-based vesting conditions, based on the probable outcome of such performance-based vesting conditions as of the last day of the year. Mr. Clyburn’s Compensation To determine the amounts in column (f) in the PvP table, the following amounts were deducted from and added to (as applicable) Mr. Clyburn’s total compensation as reported in the SCT, in accordance with Item 402(v) of Regulation S-K. | | | | | | | | | | | | | | | | | | | 2024 | | | 5,080,283 | | | (102,461) | | | (4,638,109) | | | — | | | — | | | 339,713 | 2023 | | | 10,747,653 | | | (8,249,977) | | | (84,056) | | | — | | | — | | | 2,413,620 | 2022 | | | 19,271,654 | | | (16,511,105) | | | 12,566,629 | | | — | | | — | | | 15,327,178 | | | | | | | | | | | | | | | | | | | |
(1)
| Represents the year-over-year change in the fair value of equity awards to Mr. Clyburn as summarized below: |
| | | | | | | | | | | | | | | | | | | | | | 2024 | | | — | | | (243,404) | | | — | | | (811,269) | | | (3,583,436) | | | — | | | (4,638,109) | 2023 | | | 5,726,355 | | | (4,755,629) | | | — | | | (51,800) | | | (1,002,982) | | | — | | | (84,056) | 2022 | | | 12,566,629 | | | — | | | — | | | — | | | — | | | — | | | 12,566,629 | | | | | | | | | | | | | | | | | | | | | | |
In the table above, the unvested equity values are computed in accordance with the methodology used for financial reporting purposes, and for unvested awards subject to performance-based vesting conditions, based on the probable outcome of such performance-based vesting conditions as of the last day of the year. Mr. Fibig’s Compensation To determine the amounts in column (g) in the PvP table, the following amounts were deducted from and added to (as applicable) Mr. Fibig’s total compensation as reported in the SCT, in accordance with Item 402(v) of Regulation S-K. | | | | | | | | | | | | | | | | | | | 2024 | | | — | | | — | | | — | | | — | | | — | | | — | 2023 | | | — | | | — | | | — | | | — | | | — | | | — | 2022 | | | 11,800,037 | | | — | | | (2,888,189) | | | — | | | — | | | 8,911,848 | 2021 | | | 9,767,380 | | | (5,723,445) | | | 8,481,568 | | | — | | | — | | | 12,525,503 | 2020 | | | 7,731,147 | | | (5,031,869) | | | 1,704,194 | | | — | | | — | | | 4,403,472 | | | | | | | | | | | | | | | | | | | |
(1)
| Represents the year-over-year change in the fair value of equity awards to Mr. Fibig as summarized below: |
| | | | | | | | | | | | | | | | | | | | | | 2024 | | | — | | | — | | | — | | | — | | | — | | | — | | | — | 2023 | | | — | | | — | | | — | | | — | | | — | | | — | | | — | 2022 | | | — | | | — | | | — | | | (2,888,189) | | | — | | | — | | | (2,888,189) | 2021 | | | 5,856,147 | | | 2,598,655 | | | 320,729 | | | 642,604 | | | (1,132,404) | | | 195,837 | | | 8,481,568 | 2020 | | | 3,862,811 | | | (1,093,545) | | | — | | | (471,361) | | | (771,141) | | | 177,430 | | | 1,704,194 | | | | | | | | | | | | | | | | | | | | | | |
In the table above, the unvested equity values are computed in accordance with the methodology used for financial reporting purposes, and for unvested awards subject to performance-based vesting conditions, based on the probable outcome of such performance-based vesting conditions as of the last day of the year. Average Non-CEO NEO Compensation To determine the amounts in column (i) in the PvP table, the following amounts were deducted from and added to (as applicable) our Non-CEO NEO’s average total compensation as reported in the SCT, in accordance with Item 402(v) of Regulation S-K. | | | | | | | | | | | | | | | | | | | 2024 | | | 3,593,925 | | | (1,675,005) | | | 1,401,837 | | | — | | | — | | | 3,320,758 | 2023 | | | 3,333,676 | | | (2,199,978) | | | 1,150,137 | | | — | | | — | | | 2,283,835 | 2022 | | | 5,369,203 | | | (3,085,500) | | | 1,459,759 | | | — | | | — | | | 3,743,462 | 2021 | | | 3,148,004 | | | (1,514,851) | | | 1,539,657 | | | (2,232) | | | — | | | 3,170,578 | 2020 | | | 2,060,046 | | | (1,056,088) | | | 349,261 | | | (66,306) | | | — | | | 1,286,913 | | | | | | | | | | | | | | | | | | | |
(1)
| Represents the average of the year-over-year change in the fair value of equity awards to our Non-CEO NEO’s as summarized below. |
(2)
| There is no service cost or prior service cost adjustment for pension benefits as the pension plan benefits applicable to NEOs were frozen for additional accruals as of December 31, 2007. |
| | | | | | | | | | | | | | | | | | | | | | 2024 | | | 1,515,496 | | | (163,396) | | | — | | | 108,657 | | | (61,319) | | | 2,399 | | | 1,401,837 | 2023 | | | 1,776,137 | | | (396,888) | | | — | | | (120,477) | | | (114,628) | | | 5,993 | | | 1,150,137 | 2022 | | | 2,192,872 | | | (220,228) | | | 91,429 | | | (337,314) | | | (282,833) | | | 15,833 | | | 1,459,759 | 2021 | | | 1,199,240 | | | 198,103 | | | 64,492 | | | 199,759 | | | (137,688) | | | 15,752 | | | 1,539,657 | 2020 | | | 733,010 | | | (154,763) | | | — | | | (150,632) | | | (110,451) | | | 32,097 | | | 349,261 | | | | | | | | | | | | | | | | | | | | | | |
In the table above, the unvested equity values are computed in accordance with the methodology used for financial reporting purposes, and for unvested awards subject to performance-based vesting conditions, based on the probable outcome of such performance-based vesting conditions as of the last day of the year.
|
|
|
|
|
| Company Selected Measure Name |
|
|
|
|
Currency Neutral Sales Growth
|
|
|
|
|
| Named Executive Officers, Footnote |
|
|
|
|
(1)
| Mr. Fyrwald joined as our CEO on February 6, 2024. Mr. Clyburn ceased serving as our CEO and as a director of the Board as of February 6, 2024 and departed the company on March 31, 2024. Mr. Clyburn joined as our CEO and as a director of the Board on February 14, 2022. Mr. Andreas Fibig ceased serving as our CEO and as a director and Chair of the Board as of February 14, 2022 and departed the company on March 14, 2022. |
(2)
| Non-CEO NEOs for 2024 were: Mr. Glenn Richter, Mr. Yuvraj Arora, Mr. Simon Herriott and Ms. Jennifer Johnson. |
(3)
| Non-CEO NEOs for 2023 were: Mr. Glenn Richter, Mr. Yuvraj Arora, Mr. Simon Herriott and Ms. Jennifer Johnson. |
(4)
| Non-CEO NEOs for 2022 were: Mr. Glenn Richter, Mr. Nicolas Mirzayantz (Former President, Nourish), Ms. Deborah Borg (EVP, Chief People & Culture Officer), Mr. Ralf Finzel (EVP, Global Operations Officer) and Mr. Francisco Fortanet (Former EVP, Global Operations Officer). |
(5)
| Non-CEO NEOs for 2021 were: Mr. Glenn Richter, Mr. Nicolas Mirzayantz, Mr. Francisco Fortanet, Dr. Susana Suarez Gonzalez (Former EVP, Chief Human Resources, Communication and DE&I Officer), Mr. Rustom Jilla (Former CFO), Ms. Kathy Fortmann (Former President, Nourish) and Ms. Anne Chwat (Former General Counsel). |
(6)
| Non-CEO NEOs for 2020 were: Mr. Nicolas Mirzayantz, Mr. Rustom Jilla, Ms. Anne Chwat, Mr. Matthias Hanei (Former Division CEO, Taste) and Mr. Richard O’Leary (Former CFO). |
|
|
|
|
|
| Peer Group Issuers, Footnote |
|
|
|
|
(7)
| The Peer Group used for this calculation was the S&P 500 Specialty Chemicals Index which is also reported on Form 10-K in the Performance Graph. |
|
|
|
|
|
| Adjustment To PEO Compensation, Footnote |
|
|
|
|
Mr. Fyrwald’s Compensation To determine the amounts in column (e) in the PvP table, the following amounts were deducted from and added to (as applicable) Mr. Fyrwald’s total compensation as reported in the SCT, in accordance with Item 402(v) of Regulation S-K. | | | | | | | | | | | | | | | | | | | 2024 | | | 24,154,267 | | | (19,182,546) | | | 20,139,997 | | | — | | | — | | | 25,111,718 | | | | | | | | | | | | | | | | | | | |
(1)
| Represents the year-over-year change in the fair value of equity awards to Mr. Fyrwald as summarized below: |
| | | | | | | | | | | | | | | | | | | | | | 2024 | | | 20,139,997 | | | — | | | — | | | — | | | — | | | — | | | 20,139,997 | | | | | | | | | | | | | | | | | | | | | | |
In the table above, the unvested equity values are computed in accordance with the methodology used for financial reporting purposes, and for unvested awards subject to performance-based vesting conditions, based on the probable outcome of such performance-based vesting conditions as of the last day of the year. Mr. Clyburn’s Compensation To determine the amounts in column (f) in the PvP table, the following amounts were deducted from and added to (as applicable) Mr. Clyburn’s total compensation as reported in the SCT, in accordance with Item 402(v) of Regulation S-K. | | | | | | | | | | | | | | | | | | | 2024 | | | 5,080,283 | | | (102,461) | | | (4,638,109) | | | — | | | — | | | 339,713 | 2023 | | | 10,747,653 | | | (8,249,977) | | | (84,056) | | | — | | | — | | | 2,413,620 | 2022 | | | 19,271,654 | | | (16,511,105) | | | 12,566,629 | | | — | | | — | | | 15,327,178 | | | | | | | | | | | | | | | | | | | |
(1)
| Represents the year-over-year change in the fair value of equity awards to Mr. Clyburn as summarized below: |
| | | | | | | | | | | | | | | | | | | | | | 2024 | | | — | | | (243,404) | | | — | | | (811,269) | | | (3,583,436) | | | — | | | (4,638,109) | 2023 | | | 5,726,355 | | | (4,755,629) | | | — | | | (51,800) | | | (1,002,982) | | | — | | | (84,056) | 2022 | | | 12,566,629 | | | — | | | — | | | — | | | — | | | — | | | 12,566,629 | | | | | | | | | | | | | | | | | | | | | | |
In the table above, the unvested equity values are computed in accordance with the methodology used for financial reporting purposes, and for unvested awards subject to performance-based vesting conditions, based on the probable outcome of such performance-based vesting conditions as of the last day of the year. Mr. Fibig’s Compensation To determine the amounts in column (g) in the PvP table, the following amounts were deducted from and added to (as applicable) Mr. Fibig’s total compensation as reported in the SCT, in accordance with Item 402(v) of Regulation S-K. | | | | | | | | | | | | | | | | | | | 2024 | | | — | | | — | | | — | | | — | | | — | | | — | 2023 | | | — | | | — | | | — | | | — | | | — | | | — | 2022 | | | 11,800,037 | | | — | | | (2,888,189) | | | — | | | — | | | 8,911,848 | 2021 | | | 9,767,380 | | | (5,723,445) | | | 8,481,568 | | | — | | | — | | | 12,525,503 | 2020 | | | 7,731,147 | | | (5,031,869) | | | 1,704,194 | | | — | | | — | | | 4,403,472 | | | | | | | | | | | | | | | | | | | |
(1)
| Represents the year-over-year change in the fair value of equity awards to Mr. Fibig as summarized below: |
| | | | | | | | | | | | | | | | | | | | | | 2024 | | | — | | | — | | | — | | | — | | | — | | | — | | | — | 2023 | | | — | | | — | | | — | | | — | | | — | | | — | | | — | 2022 | | | — | | | — | | | — | | | (2,888,189) | | | — | | | — | | | (2,888,189) | 2021 | | | 5,856,147 | | | 2,598,655 | | | 320,729 | | | 642,604 | | | (1,132,404) | | | 195,837 | | | 8,481,568 | 2020 | | | 3,862,811 | | | (1,093,545) | | | — | | | (471,361) | | | (771,141) | | | 177,430 | | | 1,704,194 | | | | | | | | | | | | | | | | | | | | | | |
In the table above, the unvested equity values are computed in accordance with the methodology used for financial reporting purposes, and for unvested awards subject to performance-based vesting conditions, based on the probable outcome of such performance-based vesting conditions as of the last day of the year.
|
|
|
|
|
| Non-PEO NEO Average Total Compensation Amount |
|
|
|
|
$ 3,593,925
|
$ 3,333,676
|
$ 5,369,203
|
$ 3,148,004
|
$ 2,060,046
|
| Non-PEO NEO Average Compensation Actually Paid Amount |
|
|
|
|
$ 3,320,758
|
2,283,835
|
3,743,462
|
3,170,578
|
1,286,913
|
| Adjustment to Non-PEO NEO Compensation Footnote |
|
|
|
|
Average Non-CEO NEO Compensation To determine the amounts in column (i) in the PvP table, the following amounts were deducted from and added to (as applicable) our Non-CEO NEO’s average total compensation as reported in the SCT, in accordance with Item 402(v) of Regulation S-K. | | | | | | | | | | | | | | | | | | | 2024 | | | 3,593,925 | | | (1,675,005) | | | 1,401,837 | | | — | | | — | | | 3,320,758 | 2023 | | | 3,333,676 | | | (2,199,978) | | | 1,150,137 | | | — | | | — | | | 2,283,835 | 2022 | | | 5,369,203 | | | (3,085,500) | | | 1,459,759 | | | — | | | — | | | 3,743,462 | 2021 | | | 3,148,004 | | | (1,514,851) | | | 1,539,657 | | | (2,232) | | | — | | | 3,170,578 | 2020 | | | 2,060,046 | | | (1,056,088) | | | 349,261 | | | (66,306) | | | — | | | 1,286,913 | | | | | | | | | | | | | | | | | | | |
(1)
| Represents the average of the year-over-year change in the fair value of equity awards to our Non-CEO NEO’s as summarized below. |
(2)
| There is no service cost or prior service cost adjustment for pension benefits as the pension plan benefits applicable to NEOs were frozen for additional accruals as of December 31, 2007. |
| | | | | | | | | | | | | | | | | | | | | | 2024 | | | 1,515,496 | | | (163,396) | | | — | | | 108,657 | | | (61,319) | | | 2,399 | | | 1,401,837 | 2023 | | | 1,776,137 | | | (396,888) | | | — | | | (120,477) | | | (114,628) | | | 5,993 | | | 1,150,137 | 2022 | | | 2,192,872 | | | (220,228) | | | 91,429 | | | (337,314) | | | (282,833) | | | 15,833 | | | 1,459,759 | 2021 | | | 1,199,240 | | | 198,103 | | | 64,492 | | | 199,759 | | | (137,688) | | | 15,752 | | | 1,539,657 | 2020 | | | 733,010 | | | (154,763) | | | — | | | (150,632) | | | (110,451) | | | 32,097 | | | 349,261 | | | | | | | | | | | | | | | | | | | | | | |
In the table above, the unvested equity values are computed in accordance with the methodology used for financial reporting purposes, and for unvested awards subject to performance-based vesting conditions, based on the probable outcome of such performance-based vesting conditions as of the last day of the year.
|
|
|
|
|
| Compensation Actually Paid vs. Total Shareholder Return |
|
|
|
|
Compensation Actually Paid (“CAP”) vs. IFF 5-year Cumulative TSR vs. Peer Group 5-year Cumulative TSR 
|
|
|
|
|
| Compensation Actually Paid vs. Net Income |
|
|
|
|
Compensation Actually Paid (“CAP”) vs. Net-Income vs. Adjusted Net-Income 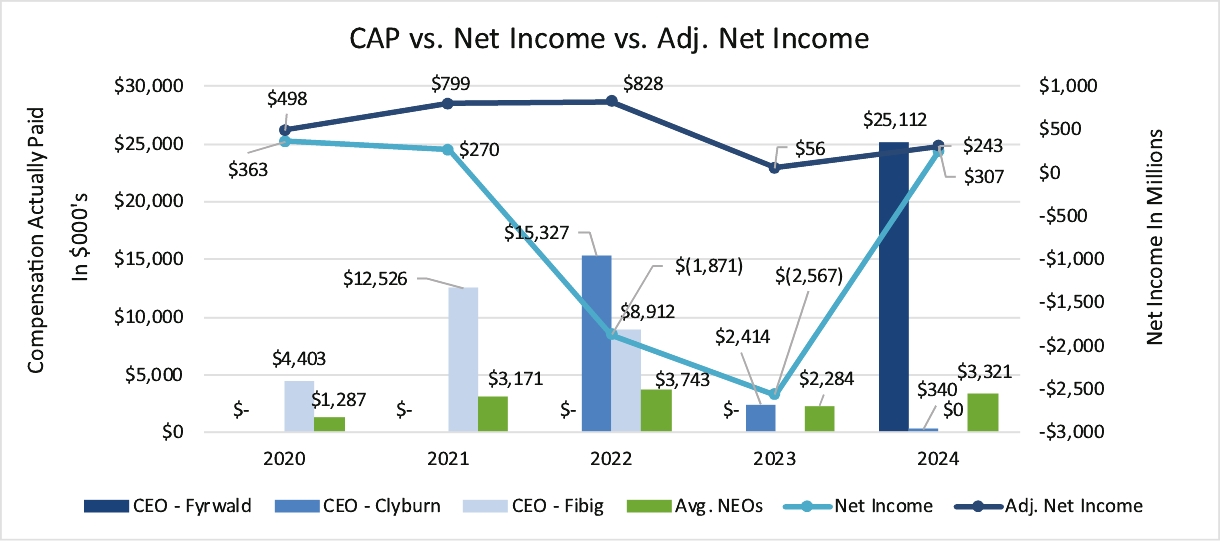 Adjusted Net Income is included in the chart above as supplemental information as it excludes one-time events that have low correlation to compensation actually paid. For 2024, the primary driver of the difference in adjusted net income and net income of $243 million is driven by a $64 million impairment of goodwill in the Pharma Solutions Disposal Group reflected in the adjusted net income for 2024.
|
|
|
|
|
| Compensation Actually Paid vs. Company Selected Measure |
|
|
|
|
Compensation Actually Paid (CAP) vs. Company Selected Measure (CSM): Currency Neutral Sales Growth 
|
|
|
|
|
| Total Shareholder Return Vs Peer Group |
|
|
|
|
Compensation Actually Paid (“CAP”) vs. IFF 5-year Cumulative TSR vs. Peer Group 5-year Cumulative TSR
|
|
|
|
|
| Tabular List, Table |
|
|
|
|
Company-Selected Measure and Other Financial Performance Measures The following financial performance measures are used to link compensation actually paid to NEOs for the most recently completed fiscal years to company performance. | | | | | | | Company-Selected Measure | | | Currency Neutral Sales Growth | | | Measure 2 | | | EBITDA | | | Measure 3 | | | Relative TSR | | | Measure 4 | | | ROIC Improvement | | | | | | | |
|
|
|
|
|
| Total Shareholder Return Amount |
|
|
|
|
$ 75
|
71
|
88
|
123
|
87
|
| Peer Group Total Shareholder Return Amount |
|
|
|
|
$ 126
|
$ 127
|
$ 110
|
$ 151
|
$ 117
|
| Company Selected Measure Amount |
|
|
|
|
0.011
|
(0.014)
|
0.093
|
0.078
|
0
|
| PEO Name |
Mr. Clyburn
|
Mr. Andreas Fibig
|
Mr. Fyrwald
|
Mr. Clyburn
|
|
Mr. Clyburn
|
|
Mr. Andreas Fibig
|
Mr. Andreas Fibig
|
| Equity Awards Adjustments, Footnote |
|
|
|
|
(1)
| Represents the year-over-year change in the fair value of equity awards to Mr. Fyrwald as summarized below: |
| | | | | | | | | | | | | | | | | | | | | | 2024 | | | 20,139,997 | | | — | | | — | | | — | | | — | | | — | | | 20,139,997 | | | | | | | | | | | | | | | | | | | | | | |
In the table above, the unvested equity values are computed in accordance with the methodology used for financial reporting purposes, and for unvested awards subject to performance-based vesting conditions, based on the probable outcome of such performance-based vesting conditions as of the last day of the year. (1)
| Represents the year-over-year change in the fair value of equity awards to Mr. Clyburn as summarized below: |
| | | | | | | | | | | | | | | | | | | | | | 2024 | | | — | | | (243,404) | | | — | | | (811,269) | | | (3,583,436) | | | — | | | (4,638,109) | 2023 | | | 5,726,355 | | | (4,755,629) | | | — | | | (51,800) | | | (1,002,982) | | | — | | | (84,056) | 2022 | | | 12,566,629 | | | — | | | — | | | — | | | — | | | — | | | 12,566,629 | | | | | | | | | | | | | | | | | | | | | | |
In the table above, the unvested equity values are computed in accordance with the methodology used for financial reporting purposes, and for unvested awards subject to performance-based vesting conditions, based on the probable outcome of such performance-based vesting conditions as of the last day of the year. (1)
| Represents the year-over-year change in the fair value of equity awards to Mr. Fibig as summarized below: |
| | | | | | | | | | | | | | | | | | | | | | 2024 | | | — | | | — | | | — | | | — | | | — | | | — | | | — | 2023 | | | — | | | — | | | — | | | — | | | — | | | — | | | — | 2022 | | | — | | | — | | | — | | | (2,888,189) | | | — | | | — | | | (2,888,189) | 2021 | | | 5,856,147 | | | 2,598,655 | | | 320,729 | | | 642,604 | | | (1,132,404) | | | 195,837 | | | 8,481,568 | 2020 | | | 3,862,811 | | | (1,093,545) | | | — | | | (471,361) | | | (771,141) | | | 177,430 | | | 1,704,194 | | | | | | | | | | | | | | | | | | | | | | |
In the table above, the unvested equity values are computed in accordance with the methodology used for financial reporting purposes, and for unvested awards subject to performance-based vesting conditions, based on the probable outcome of such performance-based vesting conditions as of the last day of the year. (2)
| There is no service cost or prior service cost adjustment for pension benefits as the pension plan benefits applicable to NEOs were frozen for additional accruals as of December 31, 2007. |
| | | | | | | | | | | | | | | | | | | | | | 2024 | | | 1,515,496 | | | (163,396) | | | — | | | 108,657 | | | (61,319) | | | 2,399 | | | 1,401,837 | 2023 | | | 1,776,137 | | | (396,888) | | | — | | | (120,477) | | | (114,628) | | | 5,993 | | | 1,150,137 | 2022 | | | 2,192,872 | | | (220,228) | | | 91,429 | | | (337,314) | | | (282,833) | | | 15,833 | | | 1,459,759 | 2021 | | | 1,199,240 | | | 198,103 | | | 64,492 | | | 199,759 | | | (137,688) | | | 15,752 | | | 1,539,657 | 2020 | | | 733,010 | | | (154,763) | | | — | | | (150,632) | | | (110,451) | | | 32,097 | | | 349,261 | | | | | | | | | | | | | | | | | | | | | | |
In the table above, the unvested equity values are computed in accordance with the methodology used for financial reporting purposes, and for unvested awards subject to performance-based vesting conditions, based on the probable outcome of such performance-based vesting conditions as of the last day of the year.
|
|
|
|
|
| Net Income (Loss) Available to Common Stockholders, Basic |
|
|
|
|
$ 243,000,000
|
$ (2,567,000,000)
|
$ (1,871,000,000)
|
$ 270,000,000
|
$ 363,000,000
|
| Goodwill, Impairment Loss |
|
|
|
|
64,000,000
|
|
|
|
|
| Adjusted Net Income (Loss) |
|
|
|
|
$ 307,000,000
|
|
|
|
|
| Measure:: 1 |
|
|
|
|
|
|
|
|
|
| Pay vs Performance Disclosure |
|
|
|
|
|
|
|
|
|
| Name |
|
|
|
|
Currency Neutral Sales Growth
|
|
|
|
|
| Measure:: 2 |
|
|
|
|
|
|
|
|
|
| Pay vs Performance Disclosure |
|
|
|
|
|
|
|
|
|
| Name |
|
|
|
|
EBITDA
|
|
|
|
|
| Measure:: 3 |
|
|
|
|
|
|
|
|
|
| Pay vs Performance Disclosure |
|
|
|
|
|
|
|
|
|
| Name |
|
|
|
|
Relative TSR
|
|
|
|
|
| Measure:: 4 |
|
|
|
|
|
|
|
|
|
| Pay vs Performance Disclosure |
|
|
|
|
|
|
|
|
|
| Name |
|
|
|
|
ROIC Improvement
|
|
|
|
|
| Mr. Erik Fyrwald [Member] |
|
|
|
|
|
|
|
|
|
| Pay vs Performance Disclosure |
|
|
|
|
|
|
|
|
|
| PEO Total Compensation Amount |
|
|
|
|
$ 24,154,267
|
|
|
|
|
| PEO Actually Paid Compensation Amount |
|
|
|
|
25,111,718
|
|
|
|
|
| Mr. Frank Clyburn [Member] |
|
|
|
|
|
|
|
|
|
| Pay vs Performance Disclosure |
|
|
|
|
|
|
|
|
|
| PEO Total Compensation Amount |
|
|
|
|
5,080,283
|
10,747,653
|
19,271,654
|
|
|
| PEO Actually Paid Compensation Amount |
|
|
|
|
339,713
|
2,413,620
|
15,327,178
|
|
|
| Mr. Andreas Fibig [Member] |
|
|
|
|
|
|
|
|
|
| Pay vs Performance Disclosure |
|
|
|
|
|
|
|
|
|
| PEO Total Compensation Amount |
|
|
|
|
0
|
0
|
11,800,037
|
9,767,380
|
7,731,147
|
| PEO Actually Paid Compensation Amount |
|
|
|
|
0
|
0
|
8,911,848
|
12,525,503
|
4,403,472
|
| PEO | Mr. Erik Fyrwald [Member] | Aggregate Change in Present Value of Accumulated Benefit for All Pension Plans Reported in Summary Compensation Table |
|
|
|
|
|
|
|
|
|
| Pay vs Performance Disclosure |
|
|
|
|
|
|
|
|
|
| Adjustment to Compensation, Amount |
|
|
|
|
0
|
|
|
|
|
| PEO | Mr. Erik Fyrwald [Member] | Pension Adjustments Service Cost |
|
|
|
|
|
|
|
|
|
| Pay vs Performance Disclosure |
|
|
|
|
|
|
|
|
|
| Adjustment to Compensation, Amount |
|
|
|
|
0
|
|
|
|
|
| PEO | Mr. Erik Fyrwald [Member] | Aggregate Grant Date Fair Value of Equity Award Amounts Reported in Summary Compensation Table |
|
|
|
|
|
|
|
|
|
| Pay vs Performance Disclosure |
|
|
|
|
|
|
|
|
|
| Adjustment to Compensation, Amount |
|
|
|
|
(19,182,546)
|
|
|
|
|
| PEO | Mr. Erik Fyrwald [Member] | Equity Awards Adjustments, Excluding Value Reported in Compensation Table |
|
|
|
|
|
|
|
|
|
| Pay vs Performance Disclosure |
|
|
|
|
|
|
|
|
|
| Adjustment to Compensation, Amount |
|
|
|
|
20,139,997
|
|
|
|
|
| PEO | Mr. Erik Fyrwald [Member] | Year-end Fair Value of Equity Awards Granted in Covered Year that are Outstanding and Unvested |
|
|
|
|
|
|
|
|
|
| Pay vs Performance Disclosure |
|
|
|
|
|
|
|
|
|
| Adjustment to Compensation, Amount |
|
|
|
|
20,139,997
|
|
|
|
|
| PEO | Mr. Erik Fyrwald [Member] | Year-over-Year Change in Fair Value of Equity Awards Granted in Prior Years That are Outstanding and Unvested |
|
|
|
|
|
|
|
|
|
| Pay vs Performance Disclosure |
|
|
|
|
|
|
|
|
|
| Adjustment to Compensation, Amount |
|
|
|
|
0
|
|
|
|
|
| PEO | Mr. Erik Fyrwald [Member] | Vesting Date Fair Value of Equity Awards Granted and Vested in Covered Year |
|
|
|
|
|
|
|
|
|
| Pay vs Performance Disclosure |
|
|
|
|
|
|
|
|
|
| Adjustment to Compensation, Amount |
|
|
|
|
0
|
|
|
|
|
| PEO | Mr. Erik Fyrwald [Member] | Change in Fair Value as of Vesting Date of Prior Year Equity Awards Vested in Covered Year |
|
|
|
|
|
|
|
|
|
| Pay vs Performance Disclosure |
|
|
|
|
|
|
|
|
|
| Adjustment to Compensation, Amount |
|
|
|
|
0
|
|
|
|
|
| PEO | Mr. Erik Fyrwald [Member] | Prior Year End Fair Value of Equity Awards Granted in Any Prior Year that Fail to Meet Applicable Vesting Conditions During Covered Year |
|
|
|
|
|
|
|
|
|
| Pay vs Performance Disclosure |
|
|
|
|
|
|
|
|
|
| Adjustment to Compensation, Amount |
|
|
|
|
0
|
|
|
|
|
| PEO | Mr. Erik Fyrwald [Member] | Dividends or Other Earnings Paid on Equity Awards not Otherwise Reflected in Total Compensation for Covered Year |
|
|
|
|
|
|
|
|
|
| Pay vs Performance Disclosure |
|
|
|
|
|
|
|
|
|
| Adjustment to Compensation, Amount |
|
|
|
|
0
|
|
|
|
|
| PEO | Mr. Frank Clyburn [Member] | Aggregate Change in Present Value of Accumulated Benefit for All Pension Plans Reported in Summary Compensation Table |
|
|
|
|
|
|
|
|
|
| Pay vs Performance Disclosure |
|
|
|
|
|
|
|
|
|
| Adjustment to Compensation, Amount |
|
|
|
|
0
|
0
|
0
|
|
|
| PEO | Mr. Frank Clyburn [Member] | Aggregate Pension Adjustments Service Cost |
|
|
|
|
|
|
|
|
|
| Pay vs Performance Disclosure |
|
|
|
|
|
|
|
|
|
| Adjustment to Compensation, Amount |
|
|
|
|
0
|
0
|
0
|
|
|
| PEO | Mr. Frank Clyburn [Member] | Aggregate Grant Date Fair Value of Equity Award Amounts Reported in Summary Compensation Table |
|
|
|
|
|
|
|
|
|
| Pay vs Performance Disclosure |
|
|
|
|
|
|
|
|
|
| Adjustment to Compensation, Amount |
|
|
|
|
(102,461)
|
(8,249,977)
|
(16,511,105)
|
|
|
| PEO | Mr. Frank Clyburn [Member] | Equity Awards Adjustments, Excluding Value Reported in Compensation Table |
|
|
|
|
|
|
|
|
|
| Pay vs Performance Disclosure |
|
|
|
|
|
|
|
|
|
| Adjustment to Compensation, Amount |
|
|
|
|
(4,638,109)
|
(84,056)
|
12,566,629
|
|
|
| PEO | Mr. Frank Clyburn [Member] | Year-end Fair Value of Equity Awards Granted in Covered Year that are Outstanding and Unvested |
|
|
|
|
|
|
|
|
|
| Pay vs Performance Disclosure |
|
|
|
|
|
|
|
|
|
| Adjustment to Compensation, Amount |
|
|
|
|
0
|
5,726,355
|
12,566,629
|
|
|
| PEO | Mr. Frank Clyburn [Member] | Year-over-Year Change in Fair Value of Equity Awards Granted in Prior Years That are Outstanding and Unvested |
|
|
|
|
|
|
|
|
|
| Pay vs Performance Disclosure |
|
|
|
|
|
|
|
|
|
| Adjustment to Compensation, Amount |
|
|
|
|
(243,404)
|
(4,755,629)
|
0
|
|
|
| PEO | Mr. Frank Clyburn [Member] | Vesting Date Fair Value of Equity Awards Granted and Vested in Covered Year |
|
|
|
|
|
|
|
|
|
| Pay vs Performance Disclosure |
|
|
|
|
|
|
|
|
|
| Adjustment to Compensation, Amount |
|
|
|
|
0
|
0
|
0
|
|
|
| PEO | Mr. Frank Clyburn [Member] | Change in Fair Value as of Vesting Date of Prior Year Equity Awards Vested in Covered Year |
|
|
|
|
|
|
|
|
|
| Pay vs Performance Disclosure |
|
|
|
|
|
|
|
|
|
| Adjustment to Compensation, Amount |
|
|
|
|
(811,269)
|
(51,800)
|
0
|
|
|
| PEO | Mr. Frank Clyburn [Member] | Prior Year End Fair Value of Equity Awards Granted in Any Prior Year that Fail to Meet Applicable Vesting Conditions During Covered Year |
|
|
|
|
|
|
|
|
|
| Pay vs Performance Disclosure |
|
|
|
|
|
|
|
|
|
| Adjustment to Compensation, Amount |
|
|
|
|
(3,583,436)
|
(1,002,982)
|
0
|
|
|
| PEO | Mr. Frank Clyburn [Member] | Dividends or Other Earnings Paid on Equity Awards not Otherwise Reflected in Total Compensation for Covered Year |
|
|
|
|
|
|
|
|
|
| Pay vs Performance Disclosure |
|
|
|
|
|
|
|
|
|
| Adjustment to Compensation, Amount |
|
|
|
|
0
|
0
|
0
|
|
|
| PEO | Mr. Andreas Fibig [Member] | Aggregate Change in Present Value of Accumulated Benefit for All Pension Plans Reported in Summary Compensation Table |
|
|
|
|
|
|
|
|
|
| Pay vs Performance Disclosure |
|
|
|
|
|
|
|
|
|
| Adjustment to Compensation, Amount |
|
|
|
|
0
|
0
|
0
|
0
|
0
|
| PEO | Mr. Andreas Fibig [Member] | Aggregate Pension Adjustments Service Cost |
|
|
|
|
|
|
|
|
|
| Pay vs Performance Disclosure |
|
|
|
|
|
|
|
|
|
| Adjustment to Compensation, Amount |
|
|
|
|
0
|
0
|
0
|
0
|
0
|
| PEO | Mr. Andreas Fibig [Member] | Aggregate Grant Date Fair Value of Equity Award Amounts Reported in Summary Compensation Table |
|
|
|
|
|
|
|
|
|
| Pay vs Performance Disclosure |
|
|
|
|
|
|
|
|
|
| Adjustment to Compensation, Amount |
|
|
|
|
0
|
0
|
0
|
(5,723,445)
|
(5,031,869)
|
| PEO | Mr. Andreas Fibig [Member] | Equity Awards Adjustments, Excluding Value Reported in Compensation Table |
|
|
|
|
|
|
|
|
|
| Pay vs Performance Disclosure |
|
|
|
|
|
|
|
|
|
| Adjustment to Compensation, Amount |
|
|
|
|
0
|
0
|
(2,888,189)
|
8,481,568
|
1,704,194
|
| PEO | Mr. Andreas Fibig [Member] | Year-end Fair Value of Equity Awards Granted in Covered Year that are Outstanding and Unvested |
|
|
|
|
|
|
|
|
|
| Pay vs Performance Disclosure |
|
|
|
|
|
|
|
|
|
| Adjustment to Compensation, Amount |
|
|
|
|
0
|
0
|
0
|
5,856,147
|
3,862,811
|
| PEO | Mr. Andreas Fibig [Member] | Year-over-Year Change in Fair Value of Equity Awards Granted in Prior Years That are Outstanding and Unvested |
|
|
|
|
|
|
|
|
|
| Pay vs Performance Disclosure |
|
|
|
|
|
|
|
|
|
| Adjustment to Compensation, Amount |
|
|
|
|
0
|
0
|
0
|
2,598,655
|
(1,093,545)
|
| PEO | Mr. Andreas Fibig [Member] | Vesting Date Fair Value of Equity Awards Granted and Vested in Covered Year |
|
|
|
|
|
|
|
|
|
| Pay vs Performance Disclosure |
|
|
|
|
|
|
|
|
|
| Adjustment to Compensation, Amount |
|
|
|
|
0
|
0
|
0
|
320,729
|
0
|
| PEO | Mr. Andreas Fibig [Member] | Change in Fair Value as of Vesting Date of Prior Year Equity Awards Vested in Covered Year |
|
|
|
|
|
|
|
|
|
| Pay vs Performance Disclosure |
|
|
|
|
|
|
|
|
|
| Adjustment to Compensation, Amount |
|
|
|
|
0
|
0
|
(2,888,189)
|
642,604
|
(471,361)
|
| PEO | Mr. Andreas Fibig [Member] | Prior Year End Fair Value of Equity Awards Granted in Any Prior Year that Fail to Meet Applicable Vesting Conditions During Covered Year |
|
|
|
|
|
|
|
|
|
| Pay vs Performance Disclosure |
|
|
|
|
|
|
|
|
|
| Adjustment to Compensation, Amount |
|
|
|
|
0
|
0
|
0
|
(1,132,404)
|
(771,141)
|
| PEO | Mr. Andreas Fibig [Member] | Dividends or Other Earnings Paid on Equity Awards not Otherwise Reflected in Total Compensation for Covered Year |
|
|
|
|
|
|
|
|
|
| Pay vs Performance Disclosure |
|
|
|
|
|
|
|
|
|
| Adjustment to Compensation, Amount |
|
|
|
|
0
|
0
|
0
|
195,837
|
177,430
|
| Non-PEO NEO | Aggregate Change in Present Value of Accumulated Benefit for All Pension Plans Reported in Summary Compensation Table |
|
|
|
|
|
|
|
|
|
| Pay vs Performance Disclosure |
|
|
|
|
|
|
|
|
|
| Adjustment to Compensation, Amount |
|
|
|
|
0
|
0
|
0
|
(2,232)
|
(66,306)
|
| Non-PEO NEO | Aggregate Pension Adjustments Service Cost |
|
|
|
|
|
|
|
|
|
| Pay vs Performance Disclosure |
|
|
|
|
|
|
|
|
|
| Adjustment to Compensation, Amount |
|
|
|
|
0
|
0
|
0
|
0
|
0
|
| Non-PEO NEO | Aggregate Grant Date Fair Value of Equity Award Amounts Reported in Summary Compensation Table |
|
|
|
|
|
|
|
|
|
| Pay vs Performance Disclosure |
|
|
|
|
|
|
|
|
|
| Adjustment to Compensation, Amount |
|
|
|
|
(1,675,005)
|
(2,199,978)
|
(3,085,500)
|
(1,514,851)
|
(1,056,088)
|
| Non-PEO NEO | Equity Awards Adjustments, Excluding Value Reported in Compensation Table |
|
|
|
|
|
|
|
|
|
| Pay vs Performance Disclosure |
|
|
|
|
|
|
|
|
|
| Adjustment to Compensation, Amount |
|
|
|
|
1,401,837
|
1,150,137
|
1,459,759
|
1,539,657
|
349,261
|
| Non-PEO NEO | Year-end Fair Value of Equity Awards Granted in Covered Year that are Outstanding and Unvested |
|
|
|
|
|
|
|
|
|
| Pay vs Performance Disclosure |
|
|
|
|
|
|
|
|
|
| Adjustment to Compensation, Amount |
|
|
|
|
1,515,496
|
1,776,137
|
2,192,872
|
1,199,240
|
733,010
|
| Non-PEO NEO | Year-over-Year Change in Fair Value of Equity Awards Granted in Prior Years That are Outstanding and Unvested |
|
|
|
|
|
|
|
|
|
| Pay vs Performance Disclosure |
|
|
|
|
|
|
|
|
|
| Adjustment to Compensation, Amount |
|
|
|
|
(163,396)
|
(396,888)
|
(220,228)
|
198,103
|
(154,763)
|
| Non-PEO NEO | Vesting Date Fair Value of Equity Awards Granted and Vested in Covered Year |
|
|
|
|
|
|
|
|
|
| Pay vs Performance Disclosure |
|
|
|
|
|
|
|
|
|
| Adjustment to Compensation, Amount |
|
|
|
|
0
|
0
|
91,429
|
64,492
|
0
|
| Non-PEO NEO | Change in Fair Value as of Vesting Date of Prior Year Equity Awards Vested in Covered Year |
|
|
|
|
|
|
|
|
|
| Pay vs Performance Disclosure |
|
|
|
|
|
|
|
|
|
| Adjustment to Compensation, Amount |
|
|
|
|
108,657
|
(120,477)
|
(337,314)
|
199,759
|
(150,632)
|
| Non-PEO NEO | Prior Year End Fair Value of Equity Awards Granted in Any Prior Year that Fail to Meet Applicable Vesting Conditions During Covered Year |
|
|
|
|
|
|
|
|
|
| Pay vs Performance Disclosure |
|
|
|
|
|
|
|
|
|
| Adjustment to Compensation, Amount |
|
|
|
|
(61,319)
|
(114,628)
|
(282,833)
|
(137,688)
|
(110,451)
|
| Non-PEO NEO | Dividends or Other Earnings Paid on Equity Awards not Otherwise Reflected in Total Compensation for Covered Year |
|
|
|
|
|
|
|
|
|
| Pay vs Performance Disclosure |
|
|
|
|
|
|
|
|
|
| Adjustment to Compensation, Amount |
|
|
|
|
$ 2,399
|
$ 5,993
|
$ 15,833
|
$ 15,752
|
$ 32,097
|
