Pay vs Performance Disclosure
|
12 Months Ended |
|
Feb. 03, 2024
USD ($)
|
Jan. 28, 2023
USD ($)
|
Jan. 29, 2022
USD ($)
|
Jan. 30, 2021
USD ($)
|
| Pay vs Performance Disclosure |
|
|
|
|
| Pay vs Performance Disclosure, Table |
| | | | | | | | | | | | | | | | | | | | | | | | | | | | | | | | | | | | | | | | | | VALUE OF INITIAL FIXED $100 INVESTMENT BASED ON: | | | | | | | | | | FISCAL
YEAR | | SUMMARY COMPENSATION TABLE TOTAL FOR PEO(1) | | COMPENSATION ACTUALLY PAID TO PEO(2) | | AVERAGE SUMMARY COMPENSATION TABLE TOTAL FOR NON-PEO NEOs(3) | | AVERAGE COMPENSATION ACTUALLY PAID TO NON-PEO NEOs(4) | | TOTAL SHAREHOLDER RETURN(5) | | PEER GROUP TOTAL SHAREHOLDER RETURN(6) | | GAAP NET INCOME
(in millions)(7) | | GAAP OPERATING MARGIN(8) | | | | ADJUSTED INCOME
(in millions)(9) | | (a) | | (b) | | (c) | | (d) | | (e) | | (f) | | (g) | | (h) | | (i) | | | | (j) | | 2023 | | $ | 1,292,948 | | $ | 1,292,948 | | $ | 3,511,348 | | $ | 9,355,310 | | $ | 122.65 | | $ | 167.48 | | $ | 127.6 | | 12.1 | % | | $ | 393.8 | | 2022 | | $ | 2,840,898 | | $ | 2,840,898 | | $ | 1,324,379 | | $ | 7,485,589 | | $ | 227.72 | | $ | 204.65 | | $ | 528.6 | | 20.1 | % | | $ | 789.8 | | 2021 | | $ | 4,532,285 | | $ | 4,532,285 | | $ | 1,550,461 | | $ | 9,177,749 | | $ | 187.75 | | $ | 185.13 | | $ | 688.5 | | 24.7 | % | | $ | 962.6 | | 2020 | | $ | 178,007,868 | | $ | 178,007,868 | | $ | 4,062,576 | | $ | 85,926,843 | | $ | 148.81 | | $ | 163.03 | | $ | 271.8 | | 16.4 | % | | $ | 620.5 | |
| (1) | The dollar amounts reported in column (b) are the amounts of total compensation reported for Mr. Friedman (our Chief Executive Officer) for each corresponding year in the “Total” column of the Summary Compensation Table. Refer to “Executive Compensation—Executive Compensation Tables—Summary Compensation.Table.” |
| (2) | The dollar amounts reported in column (c) represent the amount of “compensation actually paid” to Mr. Friedman, as computed in accordance with Item 402(v) of Regulation S-K. The dollar amounts do not reflect the actual amount of compensation earned by or paid to Mr. Friedman during the applicable year. In accordance with the requirements of Item 402(v) of Regulation S-K, the following adjustments were made to Mr. Friedman’s total compensation for each year to determine the compensation actually paid: |
| | | | | | | | | | | | | | FISCAL
YEAR | | REPORTED SUMMARY COMPENSATION TABLE TOTAL FOR PEO | | AVERAGE REPORTED VALUE OF EQUITY AWARDS(a) | | AVERAGE EQUITY AWARD ADJUSTMENTS(b) | | COMPENSATION ACTUALLY PAID TO PEO | | 2023 | | $ | 1,292,948 | | $ | — | | $ | — | | $ | 1,292,948 | | 2022 | | $ | 2,840,898 | | $ | — | | $ | — | | $ | 2,840,898 | | 2021 | | $ | 4,532,285 | | $ | — | | $ | — | | $ | 4,532,285 | | 2020 | | $ | 178,007,868 | | $ | (173,606,989) | | $ | 173,606,989 | | $ | 178,007,868 | |
| (a) | The grant date fair value of equity awards represents the amounts reported in the “Option Awards” column in the Summary Compensation Table for the applicable year. |
| (b) | The equity award adjustments for each applicable year include the addition (or subtraction, as applicable) of the following: (i) the year-end fair value of any equity awards granted in the applicable year that are outstanding and unvested as of the end of the year; (ii) the amount of change as of the end of the applicable year (from the end of the prior fiscal year) in fair value of any awards granted in prior years that are outstanding and unvested as of the end of the applicable year; (iii) for awards that are granted and vest in same applicable year, the fair value as of the vesting date; (iv) for awards granted in prior years that vest in the applicable year, the amount equal to the change as of the vesting date (from the end of the prior fiscal year) in fair value; (v) for awards granted in prior years that are determined to fail to meet the applicable vesting conditions during the applicable year, a deduction for the amount equal to the fair value at the end of the prior fiscal year; and (vi) the dollar value of any dividends or other earnings paid on stock or option awards in the applicable year prior to the vesting date that are not otherwise reflected in the fair value of such award or included in any other component of total compensation for the applicable year. Mr. Friedman’s multi-year stock option award in fiscal 2020 was fully vested upon grant but the underlying shares were subject to selling restrictions that only lapse upon the achievement of both certain stock price-based performance objectives and certain time-based service period requirements. As a result of the fiscal 2020 multi-year option award being fully vested upon grant, the equity award adjustment with respect to Mr. Friedman with respect to fiscal 2020 is equal to the Reported Value of the Equity Awards and there is therefore no change in the reported Compensation Actually Paid to the PEO related to such equity award adjustments for fiscal 2020. For more information regarding Mr. Friedman’s multi-year stock option awards, refer to “Executive Compensation—Compensation Discussion & Analysis—Multi-Year Stock Option Awards to Chairman and Chief Executive Officer.” The amounts deducted or added in calculating the equity award adjustments are as follows: |
| | | | | | | | | | | | | | | | | | | | | | | FISCAL
YEAR | | YEAR END FAIR VALUE OF EQUITY AWARDS | | YEAR OVER YEAR CHANGE IN FAIR VALUE OF OUTSTANDING AND UNVESTED EQUITY AWARDS | | FAIR VALUE AS OF VESTING DATE OF EQUITY AWARDS GRANTED AND VESTED IN THE YEAR | | YEAR OVER YEAR CHANGE IN FAIR VALUE OF EQUITY AWARDS GRANTED IN PRIOR YEARS THAT VESTED IN THE YEAR | | FAIR VALUE AT THE END OF THE PRIOR YEAR OF EQUITY AWARDS THAT FAILED TO MEET VESTING CONDITIONS IN THE YEAR | | VALUE OF DIVIDENDS OR OTHER EARNINGS PAID ON STOCK OR OPTION AWARDS NOT OTHERWISE REFLECTED IN FAIR VALUE OR TOTAL COMPENSATION | | TOTAL EQUITY AWARD ADJUSTMENTS | | 2023 | | $ | — | | $ | — | | $ | — | | $ | — | | $ | — | | $ | — | | $ | — | | 2022 | | $ | — | | $ | — | | $ | — | | $ | — | | $ | — | | $ | — | | $ | — | | 2021 | | $ | — | | $ | — | | $ | — | | $ | — | | $ | — | | $ | — | | $ | — | | 2020 | | $ | — | | $ | — | | $ | 173,606,989 | | $ | — | | $ | — | | $ | — | | $ | 173,606,989 | |
| (3) | The dollar amounts reported in column (d) represent the average of the amounts reported for the Company’s named executive officers (NEOs) as a group (excluding Mr. Friedman) in the “Total” column of the Summary Compensation Table in each applicable year. The names of each of the NEOs (excluding Mr. Friedman) included for purposes of calculating the average amounts in each applicable year are as follows: (i) for fiscal 2023 and fiscal 2022, Jack Preston, Eri Chaya, Stefan Duban and Edward Lee; (ii) for 2021, Jack Preston, Eri Chaya, DeMonty Price and Edward Lee; and (iii) for 2020, Jack Preston, Eri Chaya, DeMonty Price and David Stanchak. Mr. Price retired and left the Company on January 29, 2022. Mr. Stanchak retired and left the Company on May 16, 2021. |
| (4) | The dollar amounts reported in column (e) represent the average amount of “compensation actually paid” to the NEOs as a group (excluding Mr. Friedman), as computed in accordance with Item 402(v) of Regulation S-K. The dollar amounts do not reflect the actual average amount of compensation earned by or paid to the NEOs as a group (excluding Mr. Friedman) during the applicable year. In accordance with the requirements of Item 402(v) of Regulation S-K, the following adjustments were made to average total compensation for the NEOs as a group (excluding Mr. Friedman) for each year to determine the compensation actually paid, using the same methodology described above in Note 2: |
| | | | | | | | | | | | | | FISCAL
YEAR | | AVERAGE REPORTED SUMMARY COMPENSATION TABLE TOTAL FOR NON-PEO NEOs | | AVERAGE REPORTED VALUE OF EQUITY AWARDS | | AVERAGE EQUITY AWARD ADJUSTMENTS(a) | | AVERAGE COMPENSATION ACTUALLY PAID TO NON-PEO NEOs | | 2023 | | $ | 3,511,348 | | $ | (2,569,476) | | $ | 8,413,438 | | $ | 9,355,310 | | 2022 | | $ | 1,324,379 | | $ | — | | $ | 6,161,210 | | $ | 7,485,589 | | 2021 | | $ | 1,550,461 | | $ | — | | $ | 7,627,288 | | $ | 9,177,749 | | 2020 | | $ | 4,062,576 | | $ | (2,260,533) | | $ | 84,124,800 | | $ | 85,926,843 | |
| (a) | The valuation assumptions used to calculate fair values did not materially differ from those disclosed at the time of grant. The amounts deducted or added in calculating the total average equity award adjustments are as follows: |
| | | | | | | | | | | | | | | | | | | | | | | FISCAL
YEAR | | AVERAGE YEAR END FAIR VALUE OF EQUITY AWARDS | | YEAR OVER YEAR AVERAGE CHANGE IN FAIR VALUE OF OUTSTANDING AND UNVESTED EQUITY AWARDS | | AVERAGE FAIR VALUE AS OF VESTING DATE OF EQUITY AWARDS GRANTED AND VESTED IN THE YEAR | | YEAR OVER YEAR AVERAGE CHANGE IN FAIR VALUE OF EQUITY AWARDS GRANTED IN PRIOR YEARS THAT VESTED IN THE YEAR | | AVERAGE FAIR VALUE AT THE END OF THE PRIOR YEAR OF EQUITY AWARDS THAT FAILED TO MEET VESTING CONDITIONS IN THE YEAR | | AVERAGE VALUE OF DIVIDENDS OR OTHER EARNINGS PAID ON STOCK OR OPTION AWARDS NOT OTHERWISE REFLECTED IN FAIR VALUE OR TOTAL COMPENSATION | | TOTAL
AVERAGE EQUITY AWARD ADJUSTMENTS | | 2023 | | $ | 8,183,523 | | $ | 898,134 | | $ | — | | $ | (668,219) | | $ | — | | $ | — | | $ | 8,413,438 | | 2022 | | $ | 10,186,153 | | $ | (3,455,561) | | $ | — | | $ | (569,382) | | $ | — | | $ | — | | $ | 6,161,210 | | 2021 | | $ | 13,158,366 | | $ | (3,247,062) | | $ | — | | $ | 6,277,381 | | $ | (8,561,397) | | $ | — | | $ | 7,627,288 | | 2020 | | $ | 50,888,053 | | $ | 35,072,708 | | $ | — | | $ | (1,835,961) | | $ | — | | $ | — | | $ | 84,124,800 | |
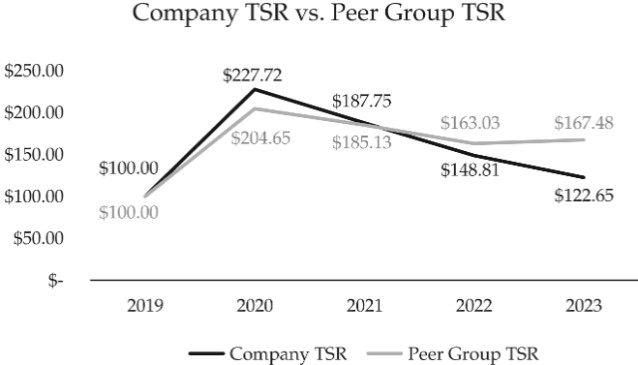
| (5) | Cumulative TSR is calculated by dividing the sum of the cumulative amount of dividends for the measurement period, assuming dividend reinvestment, and the difference between the Company’s share price at the end and the beginning of the measurement period by the Company’s share price at the beginning of the measurement period. |
| (6) | Represents the weighted peer group TSR, weighted according to the respective companies’ stock market capitalization at the beginning of each period for which a return is indicated. The peer group used for this purpose is the following published industry index: S&P Retail Select. |
| (7) | The dollar amounts reported represent the amount of net income reflected in the Company’s audited financial statements for the applicable year. |
| (8) | For fiscal 2022, the Company previously determined that GAAP operating margin was the financial performance measure that, in the Company’s assessment, represented the most important performance measure (that is not otherwise required to be disclosed in the table) used by the Company to link executive compensation actually paid to the Company’s NEOs, for the most recently completed fiscal year, to Company performance. For fiscal 2022, the Company utilized GAAP operating margin when setting goals in the LIP. |
| (9) | For fiscal 2023, the Company has determined that Adjusted Income is the financial performance measure that, in the Company’s assessment, represents the most important performance measure (that is not otherwise required to be disclosed in the table) used by the Company to link executive compensation actually paid to the Company’s NEOs, for the most recently completed fiscal year, to Company performance. We believe that Adjusted Income, which we define as consolidated operating income, adjusted for the impact of certain non-recurring and other items that we do not consider representative of our ongoing operating performance provides meaningful information regarding the performance of our business and facilitates a meaningful evaluation of operating results on a comparable basis with historical results. We do not adjust for depreciation or amortization. Therefore, Adjusted Income indirectly reflects the Company’s capital use and capital expenditures, which are important factors of our long-term business strategy. We believe the use of Adjusted Income is relevant in assessing overall performance of the Company and aligns this performance metric with the interests of shareholders. Our leadership uses this non-GAAP financial measure in order to have comparable financial results to analyze changes in our underlying business from quarter to quarter. For fiscal 2023, the Company utilized Adjusted Income when setting goals in the LIP. |
|
|
|
|
| Company Selected Measure Name |
Adjusted Income
|
|
|
|
| Named Executive Officers, Footnote |
| (1) | The dollar amounts reported in column (b) are the amounts of total compensation reported for Mr. Friedman (our Chief Executive Officer) for each corresponding year in the “Total” column of the Summary Compensation Table. Refer to “Executive Compensation—Executive Compensation Tables—Summary Compensation.Table.” |
| (3) | The dollar amounts reported in column (d) represent the average of the amounts reported for the Company’s named executive officers (NEOs) as a group (excluding Mr. Friedman) in the “Total” column of the Summary Compensation Table in each applicable year. The names of each of the NEOs (excluding Mr. Friedman) included for purposes of calculating the average amounts in each applicable year are as follows: (i) for fiscal 2023 and fiscal 2022, Jack Preston, Eri Chaya, Stefan Duban and Edward Lee; (ii) for 2021, Jack Preston, Eri Chaya, DeMonty Price and Edward Lee; and (iii) for 2020, Jack Preston, Eri Chaya, DeMonty Price and David Stanchak. Mr. Price retired and left the Company on January 29, 2022. Mr. Stanchak retired and left the Company on May 16, 2021. |
|
|
|
|
| Peer Group Issuers, Footnote |
| (6) | Represents the weighted peer group TSR, weighted according to the respective companies’ stock market capitalization at the beginning of each period for which a return is indicated. The peer group used for this purpose is the following published industry index: S&P Retail Select. |
|
|
|
|
| PEO Total Compensation Amount |
$ 1,292,948
|
$ 2,840,898
|
$ 4,532,285
|
$ 178,007,868
|
| PEO Actually Paid Compensation Amount |
$ 1,292,948
|
2,840,898
|
4,532,285
|
178,007,868
|
| Adjustment To PEO Compensation, Footnote |
| (2) | The dollar amounts reported in column (c) represent the amount of “compensation actually paid” to Mr. Friedman, as computed in accordance with Item 402(v) of Regulation S-K. The dollar amounts do not reflect the actual amount of compensation earned by or paid to Mr. Friedman during the applicable year. In accordance with the requirements of Item 402(v) of Regulation S-K, the following adjustments were made to Mr. Friedman’s total compensation for each year to determine the compensation actually paid: |
| | | | | | | | | | | | | | FISCAL
YEAR | | REPORTED SUMMARY COMPENSATION TABLE TOTAL FOR PEO | | AVERAGE REPORTED VALUE OF EQUITY AWARDS(a) | | AVERAGE EQUITY AWARD ADJUSTMENTS(b) | | COMPENSATION ACTUALLY PAID TO PEO | | 2023 | | $ | 1,292,948 | | $ | — | | $ | — | | $ | 1,292,948 | | 2022 | | $ | 2,840,898 | | $ | — | | $ | — | | $ | 2,840,898 | | 2021 | | $ | 4,532,285 | | $ | — | | $ | — | | $ | 4,532,285 | | 2020 | | $ | 178,007,868 | | $ | (173,606,989) | | $ | 173,606,989 | | $ | 178,007,868 | |
| (a) | The grant date fair value of equity awards represents the amounts reported in the “Option Awards” column in the Summary Compensation Table for the applicable year. |
| (b) | The equity award adjustments for each applicable year include the addition (or subtraction, as applicable) of the following: (i) the year-end fair value of any equity awards granted in the applicable year that are outstanding and unvested as of the end of the year; (ii) the amount of change as of the end of the applicable year (from the end of the prior fiscal year) in fair value of any awards granted in prior years that are outstanding and unvested as of the end of the applicable year; (iii) for awards that are granted and vest in same applicable year, the fair value as of the vesting date; (iv) for awards granted in prior years that vest in the applicable year, the amount equal to the change as of the vesting date (from the end of the prior fiscal year) in fair value; (v) for awards granted in prior years that are determined to fail to meet the applicable vesting conditions during the applicable year, a deduction for the amount equal to the fair value at the end of the prior fiscal year; and (vi) the dollar value of any dividends or other earnings paid on stock or option awards in the applicable year prior to the vesting date that are not otherwise reflected in the fair value of such award or included in any other component of total compensation for the applicable year. Mr. Friedman’s multi-year stock option award in fiscal 2020 was fully vested upon grant but the underlying shares were subject to selling restrictions that only lapse upon the achievement of both certain stock price-based performance objectives and certain time-based service period requirements. As a result of the fiscal 2020 multi-year option award being fully vested upon grant, the equity award adjustment with respect to Mr. Friedman with respect to fiscal 2020 is equal to the Reported Value of the Equity Awards and there is therefore no change in the reported Compensation Actually Paid to the PEO related to such equity award adjustments for fiscal 2020. For more information regarding Mr. Friedman’s multi-year stock option awards, refer to “Executive Compensation—Compensation Discussion & Analysis—Multi-Year Stock Option Awards to Chairman and Chief Executive Officer.” The amounts deducted or added in calculating the equity award adjustments are as follows: |
| | | | | | | | | | | | | | | | | | | | | | | FISCAL
YEAR | | YEAR END FAIR VALUE OF EQUITY AWARDS | | YEAR OVER YEAR CHANGE IN FAIR VALUE OF OUTSTANDING AND UNVESTED EQUITY AWARDS | | FAIR VALUE AS OF VESTING DATE OF EQUITY AWARDS GRANTED AND VESTED IN THE YEAR | | YEAR OVER YEAR CHANGE IN FAIR VALUE OF EQUITY AWARDS GRANTED IN PRIOR YEARS THAT VESTED IN THE YEAR | | FAIR VALUE AT THE END OF THE PRIOR YEAR OF EQUITY AWARDS THAT FAILED TO MEET VESTING CONDITIONS IN THE YEAR | | VALUE OF DIVIDENDS OR OTHER EARNINGS PAID ON STOCK OR OPTION AWARDS NOT OTHERWISE REFLECTED IN FAIR VALUE OR TOTAL COMPENSATION | | TOTAL EQUITY AWARD ADJUSTMENTS | | 2023 | | $ | — | | $ | — | | $ | — | | $ | — | | $ | — | | $ | — | | $ | — | | 2022 | | $ | — | | $ | — | | $ | — | | $ | — | | $ | — | | $ | — | | $ | — | | 2021 | | $ | — | | $ | — | | $ | — | | $ | — | | $ | — | | $ | — | | $ | — | | 2020 | | $ | — | | $ | — | | $ | 173,606,989 | | $ | — | | $ | — | | $ | — | | $ | 173,606,989 | |
|
|
|
|
| Non-PEO NEO Average Total Compensation Amount |
$ 3,511,348
|
1,324,379
|
1,550,461
|
4,062,576
|
| Non-PEO NEO Average Compensation Actually Paid Amount |
$ 9,355,310
|
7,485,589
|
9,177,749
|
85,926,843
|
| Adjustment to Non-PEO NEO Compensation Footnote |
| (4) | The dollar amounts reported in column (e) represent the average amount of “compensation actually paid” to the NEOs as a group (excluding Mr. Friedman), as computed in accordance with Item 402(v) of Regulation S-K. The dollar amounts do not reflect the actual average amount of compensation earned by or paid to the NEOs as a group (excluding Mr. Friedman) during the applicable year. In accordance with the requirements of Item 402(v) of Regulation S-K, the following adjustments were made to average total compensation for the NEOs as a group (excluding Mr. Friedman) for each year to determine the compensation actually paid, using the same methodology described above in Note 2: |
| | | | | | | | | | | | | | FISCAL
YEAR | | AVERAGE REPORTED SUMMARY COMPENSATION TABLE TOTAL FOR NON-PEO NEOs | | AVERAGE REPORTED VALUE OF EQUITY AWARDS | | AVERAGE EQUITY AWARD ADJUSTMENTS(a) | | AVERAGE COMPENSATION ACTUALLY PAID TO NON-PEO NEOs | | 2023 | | $ | 3,511,348 | | $ | (2,569,476) | | $ | 8,413,438 | | $ | 9,355,310 | | 2022 | | $ | 1,324,379 | | $ | — | | $ | 6,161,210 | | $ | 7,485,589 | | 2021 | | $ | 1,550,461 | | $ | — | | $ | 7,627,288 | | $ | 9,177,749 | | 2020 | | $ | 4,062,576 | | $ | (2,260,533) | | $ | 84,124,800 | | $ | 85,926,843 | |
| (a) | The valuation assumptions used to calculate fair values did not materially differ from those disclosed at the time of grant. The amounts deducted or added in calculating the total average equity award adjustments are as follows: |
| | | | | | | | | | | | | | | | | | | | | | | FISCAL
YEAR | | AVERAGE YEAR END FAIR VALUE OF EQUITY AWARDS | | YEAR OVER YEAR AVERAGE CHANGE IN FAIR VALUE OF OUTSTANDING AND UNVESTED EQUITY AWARDS | | AVERAGE FAIR VALUE AS OF VESTING DATE OF EQUITY AWARDS GRANTED AND VESTED IN THE YEAR | | YEAR OVER YEAR AVERAGE CHANGE IN FAIR VALUE OF EQUITY AWARDS GRANTED IN PRIOR YEARS THAT VESTED IN THE YEAR | | AVERAGE FAIR VALUE AT THE END OF THE PRIOR YEAR OF EQUITY AWARDS THAT FAILED TO MEET VESTING CONDITIONS IN THE YEAR | | AVERAGE VALUE OF DIVIDENDS OR OTHER EARNINGS PAID ON STOCK OR OPTION AWARDS NOT OTHERWISE REFLECTED IN FAIR VALUE OR TOTAL COMPENSATION | | TOTAL
AVERAGE EQUITY AWARD ADJUSTMENTS | | 2023 | | $ | 8,183,523 | | $ | 898,134 | | $ | — | | $ | (668,219) | | $ | — | | $ | — | | $ | 8,413,438 | | 2022 | | $ | 10,186,153 | | $ | (3,455,561) | | $ | — | | $ | (569,382) | | $ | — | | $ | — | | $ | 6,161,210 | | 2021 | | $ | 13,158,366 | | $ | (3,247,062) | | $ | — | | $ | 6,277,381 | | $ | (8,561,397) | | $ | — | | $ | 7,627,288 | | 2020 | | $ | 50,888,053 | | $ | 35,072,708 | | $ | — | | $ | (1,835,961) | | $ | — | | $ | — | | $ | 84,124,800 | |
|
|
|
|
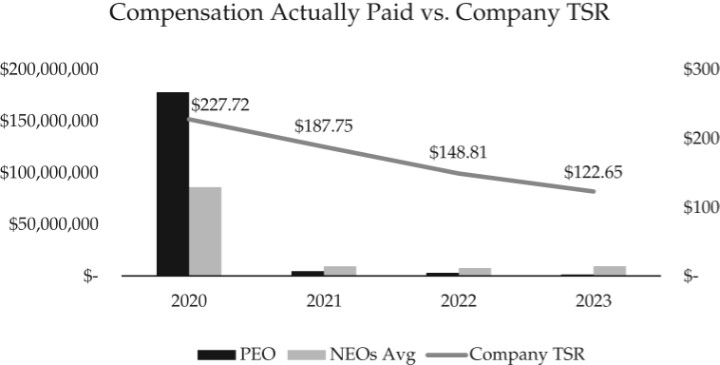
| Compensation Actually Paid vs. Total Shareholder Return |
|
|
|
|
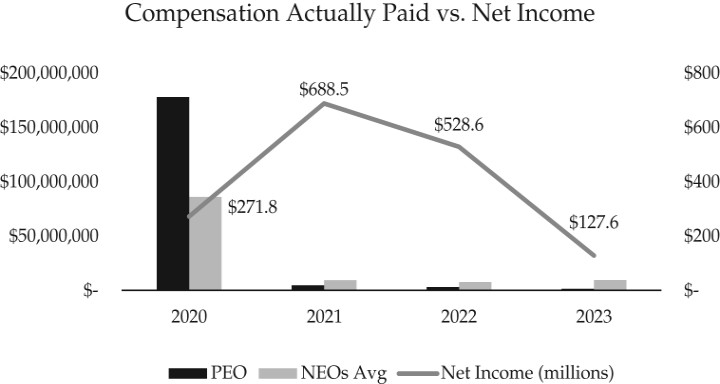
| Compensation Actually Paid vs. Net Income |
|
|
|
|
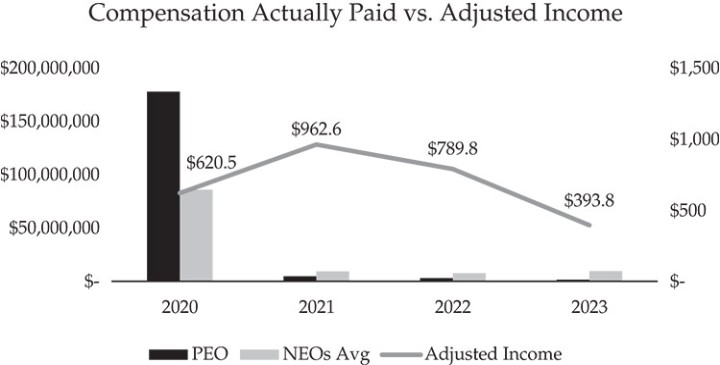
| Compensation Actually Paid vs. Company Selected Measure |
|
|
|
|
| Total Shareholder Return Vs Peer Group |
|
|
|
|
| Total Shareholder Return Amount |
$ 122.65
|
227.72
|
187.75
|
148.81
|
| Peer Group Total Shareholder Return Amount |
167.48
|
204.65
|
185.13
|
163.03
|
| Net Income (Loss) |
$ 127,600,000
|
$ 528,600,000
|
$ 688,500,000
|
$ 271,800,000
|
| Company Selected Measure Amount |
393,800,000
|
789,800,000
|
962,600,000
|
620,500,000
|
| PEO Name |
Mr. Friedman
|
|
|
|
| Prior Year Company Selected Measure Amount |
12.1
|
20.1
|
24.7
|
16.4
|
| Measure:: 1 |
|
|
|
|
| Pay vs Performance Disclosure |
|
|
|
|
| Name |
Adjusted Income
|
|
|
|
| Non-GAAP Measure Description |
| (9) | For fiscal 2023, the Company has determined that Adjusted Income is the financial performance measure that, in the Company’s assessment, represents the most important performance measure (that is not otherwise required to be disclosed in the table) used by the Company to link executive compensation actually paid to the Company’s NEOs, for the most recently completed fiscal year, to Company performance. We believe that Adjusted Income, which we define as consolidated operating income, adjusted for the impact of certain non-recurring and other items that we do not consider representative of our ongoing operating performance provides meaningful information regarding the performance of our business and facilitates a meaningful evaluation of operating results on a comparable basis with historical results. We do not adjust for depreciation or amortization. Therefore, Adjusted Income indirectly reflects the Company’s capital use and capital expenditures, which are important factors of our long-term business strategy. We believe the use of Adjusted Income is relevant in assessing overall performance of the Company and aligns this performance metric with the interests of shareholders. Our leadership uses this non-GAAP financial measure in order to have comparable financial results to analyze changes in our underlying business from quarter to quarter. For fiscal 2023, the Company utilized Adjusted Income when setting goals in the LIP. |
|
|
|
|
| PEO | AVERAGE REPORTED VALUE OF EQUITY AWARDS |
|
|
|
|
| Pay vs Performance Disclosure |
|
|
|
|
| Adjustment to Compensation, Amount |
|
|
|
$ (173,606,989)
|
| PEO | AVERAGE EQUITY AWARD ADJUSTMENTS |
|
|
|
|
| Pay vs Performance Disclosure |
|
|
|
|
| Adjustment to Compensation, Amount |
|
|
|
173,606,989
|
| PEO | FAIR VALUE AS OF VESTING DATE OF EQUITY AWARDS GRANTED AND VESTED IN THE YEAR |
|
|
|
|
| Pay vs Performance Disclosure |
|
|
|
|
| Adjustment to Compensation, Amount |
|
|
|
173,606,989
|
| Non-PEO NEO | AVERAGE REPORTED VALUE OF EQUITY AWARDS |
|
|
|
|
| Pay vs Performance Disclosure |
|
|
|
|
| Adjustment to Compensation, Amount |
$ (2,569,476)
|
|
|
(2,260,533)
|
| Non-PEO NEO | AVERAGE EQUITY AWARD ADJUSTMENTS |
|
|
|
|
| Pay vs Performance Disclosure |
|
|
|
|
| Adjustment to Compensation, Amount |
8,413,438
|
$ 6,161,210
|
$ 7,627,288
|
84,124,800
|
| Non-PEO NEO | YEAR END FAIR VALUE OF EQUITY AWARDS |
|
|
|
|
| Pay vs Performance Disclosure |
|
|
|
|
| Adjustment to Compensation, Amount |
8,183,523
|
10,186,153
|
13,158,366
|
50,888,053
|
| Non-PEO NEO | YEAR OVER YEAR CHANGE IN FAIR VALUE OF OUTSTANDING AND UNVESTED EQUITY AWARDS |
|
|
|
|
| Pay vs Performance Disclosure |
|
|
|
|
| Adjustment to Compensation, Amount |
898,134
|
(3,455,561)
|
(3,247,062)
|
35,072,708
|
| Non-PEO NEO | YEAR OVER YEAR CHANGE IN FAIR VALUE OF EQUITY AWARDS GRANTED IN PRIOR YEARS THAT VESTED IN THE YEAR |
|
|
|
|
| Pay vs Performance Disclosure |
|
|
|
|
| Adjustment to Compensation, Amount |
$ (668,219)
|
$ (569,382)
|
6,277,381
|
$ (1,835,961)
|
| Non-PEO NEO | FAIR VALUE AT THE END OF THE PRIOR YEAR OF EQUITY AWARDS THAT FAILED TO MEET VESTING CONDITIONS IN THE YEAR |
|
|
|
|
| Pay vs Performance Disclosure |
|
|
|
|
| Adjustment to Compensation, Amount |
|
|
$ (8,561,397)
|
|
