Pay vs Performance Disclosure - USD ($)
|
12 Months Ended |
Dec. 31, 2023 |
Dec. 31, 2022 |
Dec. 31, 2021 |
Dec. 31, 2020 |
| Pay vs Performance Disclosure |
|
|
|
|
| Pay vs Performance Disclosure, Table |
| | | | | | | | | | | | Summary Compensation
Total | Compensation Actually
Paid (3) | Average
Summary | Average
Compensation | Value of Fixed $100
Investment based on: | GAAP | | Fiscal
Year
(1) | John C.
Corbett
($) (2) | Robert R.
Hill, Jr.
($) (2) | John C.
Corbett
($) (4) | Robert R.
Hill, Jr.
($) (4) | Compensation
Total for Non-
PEO NEOs
($) (5) | Actually
Paid for Non-
PEO NEOs
($) (6) | Company
TSR
($) (7) | Peer Group
TSR
($) (8) | Net
Income
(Loss)
($M) (9) | Adjusted
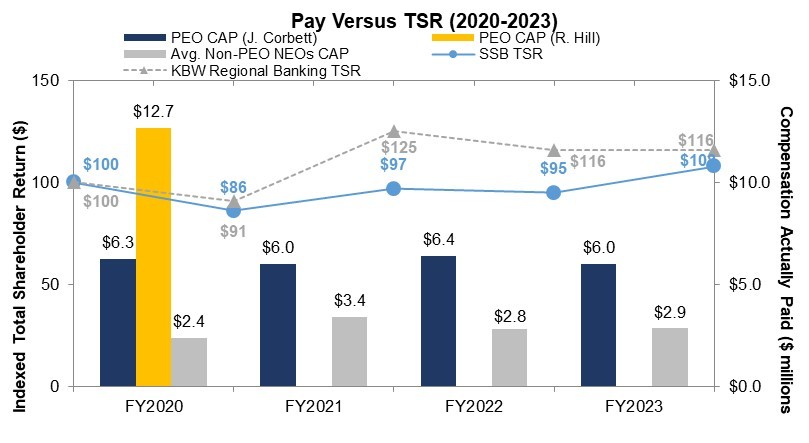
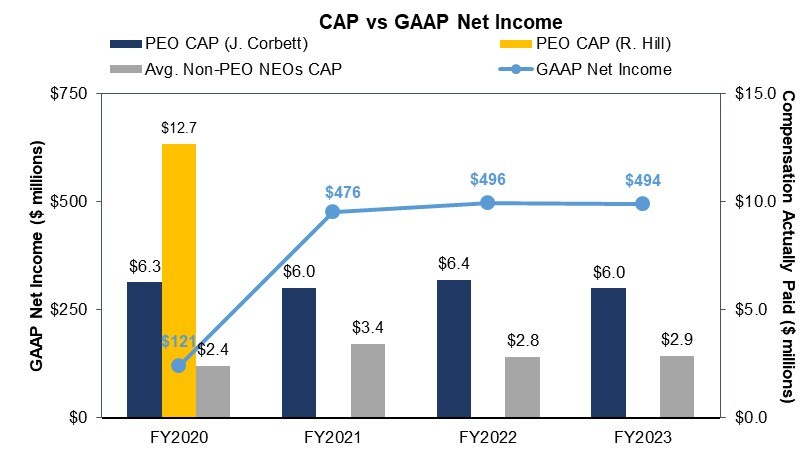
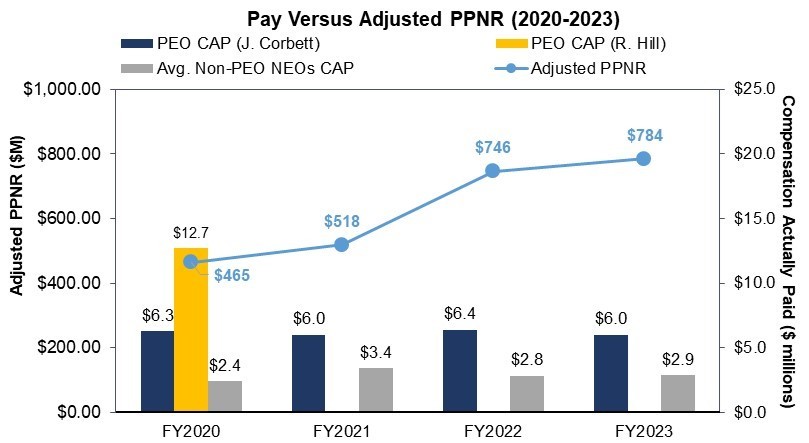
PPNR ($) (10) | 2023 | 5,166,659 | — | 6,000,069 | — | 2,784,360 | 2,855,622 | 108 | 116 | 494 | 784 | 2022 | 5,374,483 | — | 6,398,334 | — | 2,490,730 | 2,832,485 | 95 | 106 | 496 | 746 | 2021 | 5,311,551 | — | 6,003,122 | — | 3,067,288 | 3,411,157 | 97 | 117 | 476 | 518 | 2020 | 1,632,376 | 12,889,221 | 6,265,904 | 12,690,699 | 2,345,769 | 2,397,420 | 86 | 88 | 121 | 465 |
(1) | The Pay Versus Performance table reflects required disclosures for fiscal years 2023, 2022, 2021 and 2020. |
(2) | For fiscal years 2023, 2022, and 2021, Mr. Corbett was the sole Principle Executive Officer (“PEO”) of the Company. For fiscal year 2020, both Messrs. Corbett and Hill served as PEO. Amounts reported in these columns represent (i) the total compensation reported in the Summary Compensation Table (“SCT”) for the applicable year in the case of our PEOs, Mr. Corbett and Mr. Hill (Former CEO), and (ii) the average of the total compensation reported in the SCT for the applicable year for our Non-PEO NEOs. |
(3) | The Compensation Actually Paid (“CAP”) for each year was calculated beginning with the applicable Summary Compensation Table (“SCT”) total as set forth on page 49, less the amounts reported in the SCT for stock-based awards (RSUs and PSUs), plus the fair value as of the end of the covered fiscal year of all awards granted during the fiscal year that are outstanding and unvested as of the fiscal year-end, plus the amount equal to the change in fair value as of the end of the covered fiscal year, whether positive or negative, of any awards granted in any prior fiscal year that are outstanding and unvested as of the end of the covered fiscal year; and adding the dollar value of any dividends or other earnings paid on awards in the covered fiscal year prior to the vesting date that are not otherwise included in another component of total compensation for such fiscal year, plus an amount equal to the change in fair value as of the vesting date, whether positive or negative, of any award granted in any prior fiscal year for which all applicable vesting conditions were satisfied at the end of or during the covered fiscal year. Relative to the PEO’s CAP, the following amounts were deducted from and added to SCT total compensation. Fair values were computed in accordance with ASC 718 as of the applicable valuation date and take into account any excess fair value as a result of the TBV Growth Adjustment. |
(4) | Amounts reported in these columns represent the CAP for the applicable year in the case of our PEOs, Mr. Corbett and Mr. Hill. Adjustments were made to the amounts reported in the SCT for the applicable year. A reconciliation of the adjustments made to the 2023 SCT amounts to calculate CAP for our PEO, Mr. Corbett, and for the average of the Non-PEO NEOs is set forth in the following tables. For purposes of the tables, “EOY” means End of Year, and “BOY” means Beginning of Year. |
PEO (Corbett) SCT Total to CAP Reconciliation | | | | | Year | SCT Total ($) | Deductions from SCT
(i) | Additions to SCT Total
(ii) | CAP ($) | 2023 | 5,166,659 | (2,746,330) | 3,579,740 | 6,000,069 |
| (i) | Represents the grant date fair value of equity-based awards granted each year as reported in the SCT. |
| (ii) | The additions to the SCT Total reflect the value of equity calculated in accordance with the SEC methodology for determining CAP for each year shown as follows: |
Supplemental PEO (Corbett) Equity Component of CAP | | | | | | | | Year | SCT Total for
PEO ($) | (Less) SCT Equity for PEO ($) | Plus (Less) Fair Value of Equity Awards
Granted During
Fiscal Year
Outstanding
and Unvested
at EOY ($)r | Plus (Less) Change
from BOY to EOY
in Fair Value of
Awards Granted
in any Prior
Fiscal Year that
are Outstanding
and Unvested at
EOY ($) | Plus (Less) Change in
Fair Value from
BOY to Vesting
Date of Awards
Granted in Any
Prior Fiscal Year
that Vested
During the Fiscal
Year
($) | Value of
Dividends or
Other Earnings
Paid on Stock or
Option Awards
not Otherwise
Reflected in Fair
Value or Total
Compensation ($) | PEO CAP
($) | 2023 | 5,166,659 | (2,746,330) | 3,045,267 | 646,626 | (317,962) | 205,809 | 6,000,069 |
(5) | Each of the three fiscal years presented includes the average SCT totals of the Non-PEO NEOs as applicable in each reporting year. Fiscal year 2023 includes Messrs. Hill, Matthews, Murray and Young, and Ms. Brooks. Fiscal year 2022 includes Messrs. Hill, Matthews, Williams, and Young. Fiscal |
year 2021 includes Messrs. Hill, Matthews and Young, and Ms. Brooks. Fiscal year 2020 includes Messrs. Matthews, Goettee, Lapointe, and Pollok, and Ms. Brooks. (6) | Relative to CAP, the following amounts were deducted from and added to SCT total compensation: |
Average Non-PEO NEO SCT Total to CAP Reconciliation Year | SCT Total
($) | Deductions from SCT
(i) | Additions to SCT Total
(ii) | CAP
($) | 2023 | 2,784,360 | (603,918) | 675,180 | 2,855,622 |
| (i) | Represents the average of the non-PEO NEOs’ grant date fair value of equity-based awards granted each year as reported in the SCT. |
| (ii) | The additions to the SCT Total reflect the average of the non-PEO NEOs value of equity calculated in accordance with the SEC methodology for determining CAP for each year shown as follows: |
Supplemental Non-PEO Average Equity Component of CAP for Fiscal Year 2023 Year | SCT Total for
Non-PEO NEO
($) | (Less) SCT
Equity for Non-
PEO NEO
($) | Plus (Less) EOY Fair Value of Equity
Awards Granted
During Fiscal
Year Outstanding
and Unvested
at EOY
($) | Plus (Less) Change from BOY to EOY in Fair
Value of Awards
Granted in any Prior
Fiscal Year that are
Outstanding and
Unvested at EOY
($) | Plus (Less) Change in Fair
Value from BOY to
Vesting Date of
Awards Granted in
Any Prior Fiscal
Year that Vested
During the
Fiscal Year
($) | Value of Dividends
or Other Earnings
Paid on Stock or
Option Awards not
Otherwise Reflected
in Fair Value or
Total Compensation
($) | Non-PEO NEO
CAP
($) | 2023 | 2,784,360 | (603,918) | 669,655 | 120,046 | (152,730) | 38,210 | 2,855,622 |
(7) | This amount represents the cumulative TSR based on an initial fixed $100 investment in SouthState common stock for the measurement periods beginning on December 31, 2019, and ending on December 31 of each of 2023, 2022, 2021, and 2020, respectively, assuming in each case reinvestment of all dividends, calculated in accordance with Item 201(e) of the Regulation S-K. TSR is calculated by dividing the difference between the price of the Company’s common stock at the end and the beginning of the measurement period by the price of the Company’s common stock at the beginning of the measurement period. |
(8) | The peer group for purposes of this table is the KBW Nasdaq Regional Banking Index (“KRX”), which is the same peer group disclosed in the Company’s Annual Report on Form 10-K. |
(9) | This amount represents the Company’s GAAP Net Income (Loss) Attributable to SouthState (in millions) as disclosed in SouthState’s Annual Reports on Form 10-K for each applicable fiscal year-end 2023, 2022, 2021, and 2020. |
(10) | Adjusted PPNR has been selected as the Company Selected Measure because the Company believes it is the most important measure linked to compensation actually paid, has a close association with the Company’s share price and TSR, and has been and is expected to continue to be a performance metric that is important to the Company and our stockholders. Adjusted PPNR is a non-GAAP financial measure that equals net income before income tax and provision for credit losses (including unfunded commitments) and excludes the impact of branch consolidation, gains or losses on AFS securities, and other one-time adjustments such as extinguishment of debt cost, income tax benefit/cost related to the carryback of tax losses under the CARES Act, and adjustments (positive or negative) resulting from federal and state tax examinations for tax years outside of the measurement period. See reconciliation of GAAP to Non-GAAP measures in Appendix A. |
|
|
|
|
| Company Selected Measure Name |
Adjusted PPNR
|
|
|
|
| Named Executive Officers, Footnote |
(2) | For fiscal years 2023, 2022, and 2021, Mr. Corbett was the sole Principle Executive Officer (“PEO”) of the Company. For fiscal year 2020, both Messrs. Corbett and Hill served as PEO. Amounts reported in these columns represent (i) the total compensation reported in the Summary Compensation Table (“SCT”) for the applicable year in the case of our PEOs, Mr. Corbett and Mr. Hill (Former CEO), and (ii) the average of the total compensation reported in the SCT for the applicable year for our Non-PEO NEOs. |
(5) | Each of the three fiscal years presented includes the average SCT totals of the Non-PEO NEOs as applicable in each reporting year. Fiscal year 2023 includes Messrs. Hill, Matthews, Murray and Young, and Ms. Brooks. Fiscal year 2022 includes Messrs. Hill, Matthews, Williams, and Young. Fiscal |
year 2021 includes Messrs. Hill, Matthews and Young, and Ms. Brooks. Fiscal year 2020 includes Messrs. Matthews, Goettee, Lapointe, and Pollok, and Ms. Brooks.
|
|
|
|
| Peer Group Issuers, Footnote |
(8) | The peer group for purposes of this table is the KBW Nasdaq Regional Banking Index (“KRX”), which is the same peer group disclosed in the Company’s Annual Report on Form 10-K. |
|
|
|
|
| Adjustment To PEO Compensation, Footnote |
(4) | Amounts reported in these columns represent the CAP for the applicable year in the case of our PEOs, Mr. Corbett and Mr. Hill. Adjustments were made to the amounts reported in the SCT for the applicable year. A reconciliation of the adjustments made to the 2023 SCT amounts to calculate CAP for our PEO, Mr. Corbett, and for the average of the Non-PEO NEOs is set forth in the following tables. For purposes of the tables, “EOY” means End of Year, and “BOY” means Beginning of Year. |
PEO (Corbett) SCT Total to CAP Reconciliation | | | | | Year | SCT Total ($) | Deductions from SCT
(i) | Additions to SCT Total
(ii) | CAP ($) | 2023 | 5,166,659 | (2,746,330) | 3,579,740 | 6,000,069 |
| (i) | Represents the grant date fair value of equity-based awards granted each year as reported in the SCT. |
| (ii) | The additions to the SCT Total reflect the value of equity calculated in accordance with the SEC methodology for determining CAP for each year shown as follows: |
Supplemental PEO (Corbett) Equity Component of CAP | | | | | | | | Year | SCT Total for
PEO ($) | (Less) SCT Equity for PEO ($) | Plus (Less) Fair Value of Equity Awards
Granted During
Fiscal Year
Outstanding
and Unvested
at EOY ($)r | Plus (Less) Change
from BOY to EOY
in Fair Value of
Awards Granted
in any Prior
Fiscal Year that
are Outstanding
and Unvested at
EOY ($) | Plus (Less) Change in
Fair Value from
BOY to Vesting
Date of Awards
Granted in Any
Prior Fiscal Year
that Vested
During the Fiscal
Year
($) | Value of
Dividends or
Other Earnings
Paid on Stock or
Option Awards
not Otherwise
Reflected in Fair
Value or Total
Compensation ($) | PEO CAP
($) | 2023 | 5,166,659 | (2,746,330) | 3,045,267 | 646,626 | (317,962) | 205,809 | 6,000,069 |
|
|
|
|
| Non-PEO NEO Average Total Compensation Amount |
$ 2,784,360
|
$ 2,490,730
|
$ 3,067,288
|
$ 2,345,769
|
| Non-PEO NEO Average Compensation Actually Paid Amount |
$ 2,855,622
|
2,832,485
|
3,411,157
|
2,397,420
|
| Adjustment to Non-PEO NEO Compensation Footnote |
(6) | Relative to CAP, the following amounts were deducted from and added to SCT total compensation: |
Average Non-PEO NEO SCT Total to CAP Reconciliation Year | SCT Total
($) | Deductions from SCT
(i) | Additions to SCT Total
(ii) | CAP
($) | 2023 | 2,784,360 | (603,918) | 675,180 | 2,855,622 |
| (i) | Represents the average of the non-PEO NEOs’ grant date fair value of equity-based awards granted each year as reported in the SCT. |
| (ii) | The additions to the SCT Total reflect the average of the non-PEO NEOs value of equity calculated in accordance with the SEC methodology for determining CAP for each year shown as follows: |
Supplemental Non-PEO Average Equity Component of CAP for Fiscal Year 2023 Year | SCT Total for
Non-PEO NEO
($) | (Less) SCT
Equity for Non-
PEO NEO
($) | Plus (Less) EOY Fair Value of Equity
Awards Granted
During Fiscal
Year Outstanding
and Unvested
at EOY
($) | Plus (Less) Change from BOY to EOY in Fair
Value of Awards
Granted in any Prior
Fiscal Year that are
Outstanding and
Unvested at EOY
($) | Plus (Less) Change in Fair
Value from BOY to
Vesting Date of
Awards Granted in
Any Prior Fiscal
Year that Vested
During the
Fiscal Year
($) | Value of Dividends
or Other Earnings
Paid on Stock or
Option Awards not
Otherwise Reflected
in Fair Value or
Total Compensation
($) | Non-PEO NEO
CAP
($) | 2023 | 2,784,360 | (603,918) | 669,655 | 120,046 | (152,730) | 38,210 | 2,855,622 |
|
|
|
|
| Compensation Actually Paid vs. Total Shareholder Return |
|
|
|
|
| Compensation Actually Paid vs. Net Income |
|
|
|
|
| Compensation Actually Paid vs. Company Selected Measure |
|
|
|
|
| Total Shareholder Return Vs Peer Group |
|
|
|
|
| Tabular List, Table |
The following table sets forth an unranked list of the performance measures which we view as the “most important” measures for linking our NEOs’ compensation to performance: | Most Important Performance Measures (unranked) | Adjusted PPNR | Tangible Book Value/Share | Return on Average Tangible Common Equity | SouthState's Share Price |
|
|
|
|
| Total Shareholder Return Amount |
$ 108
|
95
|
97
|
86
|
| Peer Group Total Shareholder Return Amount |
116
|
106
|
117
|
88
|
| Net Income (Loss) |
$ 494,000,000
|
$ 496,000,000
|
$ 476,000,000
|
$ 121,000,000
|
| Company Selected Measure Amount |
784,000,000
|
746,000,000
|
518,000,000
|
465,000,000
|
| PEO Name |
Mr. Corbett
|
|
|
|
| Measure:: 1 |
|
|
|
|
| Pay vs Performance Disclosure |
|
|
|
|
| Name |
Adjusted PPNR
|
|
|
|
| Non-GAAP Measure Description |
(10) | Adjusted PPNR has been selected as the Company Selected Measure because the Company believes it is the most important measure linked to compensation actually paid, has a close association with the Company’s share price and TSR, and has been and is expected to continue to be a performance metric that is important to the Company and our stockholders. Adjusted PPNR is a non-GAAP financial measure that equals net income before income tax and provision for credit losses (including unfunded commitments) and excludes the impact of branch consolidation, gains or losses on AFS securities, and other one-time adjustments such as extinguishment of debt cost, income tax benefit/cost related to the carryback of tax losses under the CARES Act, and adjustments (positive or negative) resulting from federal and state tax examinations for tax years outside of the measurement period. See reconciliation of GAAP to Non-GAAP measures in Appendix A. |
|
|
|
|
| Measure:: 2 |
|
|
|
|
| Pay vs Performance Disclosure |
|
|
|
|
| Name |
Tangible Book Value/Share
|
|
|
|
| Measure:: 3 |
|
|
|
|
| Pay vs Performance Disclosure |
|
|
|
|
| Name |
Return on Average Tangible Common Equity
|
|
|
|
| Measure:: 4 |
|
|
|
|
| Pay vs Performance Disclosure |
|
|
|
|
| Name |
SouthState's Share Price
|
|
|
|
| John C. Corbett |
|
|
|
|
| Pay vs Performance Disclosure |
|
|
|
|
| PEO Total Compensation Amount |
$ 5,166,659
|
$ 5,374,483
|
$ 5,311,551
|
$ 1,632,376
|
| PEO Actually Paid Compensation Amount |
6,000,069
|
$ 6,398,334
|
$ 6,003,122
|
6,265,904
|
| Robert R. Hill, Jr. |
|
|
|
|
| Pay vs Performance Disclosure |
|
|
|
|
| PEO Total Compensation Amount |
|
|
|
12,889,221
|
| PEO Actually Paid Compensation Amount |
|
|
|
$ 12,690,699
|
| PEO | John C. Corbett | Deductions from SCT |
|
|
|
|
| Pay vs Performance Disclosure |
|
|
|
|
| Adjustment to Compensation, Amount |
(2,746,330)
|
|
|
|
| PEO | John C. Corbett | Additions to SCT Total |
|
|
|
|
| Pay vs Performance Disclosure |
|
|
|
|
| Adjustment to Compensation, Amount |
3,579,740
|
|
|
|
| PEO | John C. Corbett | Plus (Less) Fair Value of Equity Awards Granted During Fiscal Year Outstanding and Unvested at EOY |
|
|
|
|
| Pay vs Performance Disclosure |
|
|
|
|
| Adjustment to Compensation, Amount |
3,045,267
|
|
|
|
| PEO | John C. Corbett | Plus (Less) Change from BOY to EOY in Fair Value of Awards Granted in any Prior Fiscal Year that are Outstanding and Unvested at EOY |
|
|
|
|
| Pay vs Performance Disclosure |
|
|
|
|
| Adjustment to Compensation, Amount |
646,626
|
|
|
|
| PEO | John C. Corbett | Plus (Less) Change in Fair Value from BOY to Vesting Date of Awards Granted in Any Prior Fiscal Year that Vested During the Fiscal Year |
|
|
|
|
| Pay vs Performance Disclosure |
|
|
|
|
| Adjustment to Compensation, Amount |
(317,962)
|
|
|
|
| PEO | John C. Corbett | Value of Dividends or Other Earnings Paid on Stock or Option Awards not Otherwise Reflected in Fair Value or Total Compensation |
|
|
|
|
| Pay vs Performance Disclosure |
|
|
|
|
| Adjustment to Compensation, Amount |
205,809
|
|
|
|
| Non-PEO NEO | Deductions from SCT |
|
|
|
|
| Pay vs Performance Disclosure |
|
|
|
|
| Adjustment to Compensation, Amount |
(603,918)
|
|
|
|
| Non-PEO NEO | Additions to SCT Total |
|
|
|
|
| Pay vs Performance Disclosure |
|
|
|
|
| Adjustment to Compensation, Amount |
675,180
|
|
|
|
| Non-PEO NEO | Plus (Less) Fair Value of Equity Awards Granted During Fiscal Year Outstanding and Unvested at EOY |
|
|
|
|
| Pay vs Performance Disclosure |
|
|
|
|
| Adjustment to Compensation, Amount |
669,655
|
|
|
|
| Non-PEO NEO | Plus (Less) Change from BOY to EOY in Fair Value of Awards Granted in any Prior Fiscal Year that are Outstanding and Unvested at EOY |
|
|
|
|
| Pay vs Performance Disclosure |
|
|
|
|
| Adjustment to Compensation, Amount |
120,046
|
|
|
|
| Non-PEO NEO | Plus (Less) Change in Fair Value from BOY to Vesting Date of Awards Granted in Any Prior Fiscal Year that Vested During the Fiscal Year |
|
|
|
|
| Pay vs Performance Disclosure |
|
|
|
|
| Adjustment to Compensation, Amount |
(152,730)
|
|
|
|
| Non-PEO NEO | Value of Dividends or Other Earnings Paid on Stock or Option Awards not Otherwise Reflected in Fair Value or Total Compensation |
|
|
|
|
| Pay vs Performance Disclosure |
|
|
|
|
| Adjustment to Compensation, Amount |
$ 38,210
|
|
|
|
