Pay vs Performance Disclosure - USD ($)
|
6 Months Ended |
7 Months Ended |
12 Months Ended |
Jun. 15, 2020 |
Dec. 31, 2020 |
Dec. 31, 2024 |
Dec. 31, 2023 |
Dec. 31, 2022 |
Dec. 31, 2021 |
Dec. 31, 2020 |
| Pay vs Performance Disclosure |
|
|
|
|
|
|
|
| Pay vs Performance Disclosure, Table |
|
|
PAY VERSUS PERFORMANCE Under rules adopted pursuant to the Dodd-Frank Act, we are required to disclose certain information about the relationship between the compensation actually paid to our NEOs and certain measures of company performance. The material that follows is provided in compliance with these rules however additional information regarding our compensation philosophy, the structure of our performance-based compensation programs, and compensation decisions made this year is described above in our “Compensation Discussion and Analysis.” The following table provides information regarding compensation actually paid to our principal executive officer (“PEO”) and other NEOs for each year from 2020 to 2024, compared to our total shareholder return (“TSR”) from December 31, 2020 through the end of each such year, and our net income for each such year. We do not have a company-selected measure (“CSM”) because our NEOs’ compensation is not linked to any other financial performance measures. | | | | | | | | | | | | | | | | | | | | | | | Year
(a) | | | Summary
Compensation
Table Total
for First PEO
(b)(1)(3) | | | Compensation
Actually Paid
to First PEO
(c)(1)(4) | | | Summary
Compensation
Table Total
for Second
PEO
(b)(2)(3) | | | Compensation
Actually Paid
to Second
PEO
(c)(2)(4) | | | Average
Summary
Compensation
Table Total
for Non-PEO
Named
Executive
Officers
(d)(5) | | | Average
Compensation
Actually Paid
to Non-PEO
Named
Executive
Officers
(d)(6) | | | Value of Initial Fixed
$100 Investment
Based On: | | | Total
Shareholder
Return
(f)(7) | | | Peer Group
Total
Shareholder
Return
(g)(8) | | | Net Loss
(Millions)
(h)(9) | 2024 | | | $4,131,290 | | | $2,379,980 | | | NA | | | NA | | | $1,588,170 | | | $963,055 | | | $4.05 | | | $13.05 | | | ($111.7) | 2023 | | | $1,546,477 | | | $2,136,238 | | | NA | | | NA | | | $1,334,573 | | | $1,145,469 | | | $6.53 | | | $21.73 | | | ($117.2) | 2022 | | | $2,906,639 | | | $5,477,118 | | | NA | | | NA | | | $1,003,683 | | | $560,004 | | | $5.03 | | | $22.55 | | | ($151.0) | 2021 | | | $8,996,489 | | | ($4,543,508) | | | NA | | | NA | | | $2,039,077 | | | ($686,060) | | | $15.28 | | | $63.31 | | | ($145.5) | 2020 | | | $21,298,608 | | | $9,367,728 | | | $4,317,964 | | | $4,527,456 | | | $2,282,480 | | | $1,512,068 | | | $94.10 | | | $141.57 | | | ($130.9) | | | | | | | | | | | | | | | | | | | | | | | | | | | | |
(1)
| Our first PEO was Laurent Fischer. |
(2)
| Our second PEO was Leone Patterson, who was the PEO for only part of 2020. |
(3)
| Represents the total compensation paid to our PEO in each listed year, as shown in our Summary Compensation Table for such listed year. |
(4)
| Compensation actually paid does not mean that our PEO was actually paid those amounts in 2024, but this is a dollar amount derived from the starting point of Summary Compensation Table total compensation under the methodology prescribed under the relevant rules as shown in the adjustment table below. |
| | | | | | | 2024 | Summary Compensation Table Total(a) | | | $4,131,290 | Subtract Grant Date Fair Value of Option Awards and Stock Awards Granted in Fiscal Year(b) | | | ($3,010,615) | Add Fair Value at Fiscal Year-End of Outstanding and Unvested Option Awards and Stock Awards Granted in Fiscal Year(c) | | | $1,088,642 | Adjust for Change in Fair Value of Outstanding and Unvested Option Awards and Stock Awards Granted in Prior Fiscal Years(c) | | | ($119,486) | Adjust for Fair Value at Vesting of Option Awards and Stock Awards Granted in Fiscal Year That Vested During Fiscal Year(c) | | | $0 | Adjust for Change in Fair Value as of Vesting Date of Option Awards and Stock Awards Granted in Prior Fiscal Years for Which Applicable Vesting Conditions Were Satisfied During Fiscal Year(c) | | | $290,149 | Subtract Fair Value as of Prior Fiscal Year-End of Option Awards and Stock Awards Granted in Prior Fiscal Years That Failed to Meet Applicable Vesting Conditions During Fiscal Year(c) | | | $0 | Add Value of Dividends or Other Earnings Paid on Stock or Option Awards Not Otherwise Reflected in Fair Value or Total Compensation | | | $0 | Compensation Actually Paid | | | $2,379,980 | | | | |
(a)
| We have not reported any amounts in our Summary Compensation Table with respect to “Change in Pension and Nonqualified Deferred Compensation” and, accordingly, the adjustments with respect to such items prescribed by the pay-versus-performance rules are not relevant to our analysis and no adjustments have been made. |
(b)
| The amounts reflect the aggregate grant-date fair value reported in the “Option Awards” column in the Summary Compensation Table for 2024. |
(c)
| In accordance with Item 402(v) requirements, the fair values of unvested and outstanding equity awards to our NEOs were remeasured as of the end of 2024, and as of each vesting date during 2024. We approached the determination of fair value in the same way as we historically have determined fair value and fair values as of each measurement date were determined using |
valuation assumptions and methodologies (including expected term, volatility, dividend yield, and risk-free interest rates) that are generally consistent with those used to estimate fair value at grant under US GAAP. See “Stock Plans” in Note 9 to our financial statements included in our Annual Report on Form 10-K for the year ended December 31, 2024 for additional details. (5)
| This figure is the average of the total compensation paid to our NEOs other than our PEO in each listed year, as shown in our Summary Compensation Table for such listed year. The names of the non-PEO NEOs in each year are listed in the table below. |
| | | | | | | | | | | | | 2020 | | | 2021 | | | 2022 | | | 2023 | | | 2024 | Aaron Osborne | | | Julie Clark | | | Richard Beckman | | | Linda Rubinstein | | | Rabia Gurses Ozden | Angela Thedinga | | | Christopher DeRespino | | | Rupert D’Souza | | | Setareh Seyedkazemi | | | Linda Rubinstein | | | | Rupert D’Souza | | | John Rakow | | | Peter Soparkar | | | Setareh Seyedkazemi | | | | Thomas Leung | | | Linda Rubinstein | | | | | | Peter Soparkar | | | | Leone Patterson | | | Setareh Seyedkazemi | | | | | | | | | | Brigit Riley | | | Peter Soparkar | | | | | | | | | | Peter Soparkar | | | | | | | | | | | | | Angela Thedinga | | | | | | | | | | | | | Jack Thrift | | | | | | | | | | | | | | | | | | | | | | |
(6)
| This figure is the average of compensation actually paid for our NEOs other than our PEO in each listed year. Compensation actually paid does not mean that these NEOs were actually paid those amounts in the listed year, but this is a dollar amount derived from the starting point of Summary Compensation Table total compensation under the methodology prescribed under the SEC's rules as shown in the table below, with the indicated figures showing an average of such figure for all NEOs other than our PEO in each listed year. |
| | | | | | | 2024 | Summary Compensation Table Total(a) | | | $1,588,170 | Subtract Grant Date Fair Value of Option Awards and Stock Awards Granted in Fiscal Year(b) | | | ($908,893) | Add Fair Value at Fiscal Year-End of Outstanding and Unvested Option Awards and Stock Awards Granted in Fiscal Year(c) | | | $371,347 | Adjust for Change in Fair Value of Outstanding and Unvested Option Awards and Stock Awards Granted in Prior Fiscal Years(c) | | | ($87,537) | Adjust for Fair Value at Vesting of Option Awards and Stock Awards Granted in Fiscal Year That Vested During Fiscal Year(c) | | | $0 | Adjust for Change in Fair Value as of Vesting Date of Option Awards and Stock Awards Granted in Prior Fiscal Years for Which Applicable Vesting Conditions Were Satisfied During Fiscal Year(c) | | | ($32) | Subtract Fair Value as of Prior Fiscal Year-End of Option Awards and Stock Awards Granted in Prior Fiscal Years That Failed to Meet Applicable Vesting Conditions During Fiscal Year(c) | | | $0 | Add Value of Dividends or Other Earnings Paid on Stock or Option Awards Not Otherwise Reflected in Fair Value or Total Compensation | | | $0 | Compensation Actually Paid | | | $963,055 | | | | |
(a)
| We have not reported any amounts in our Summary Compensation Table with respect to “Change in Pension and Nonqualified Deferred Compensation” and, accordingly, the adjustments with respect to such items prescribed by the pay-versus-performance rules are not relevant to our analysis and no adjustments have been made. |
(b)
| The amounts reflect the aggregate grant-date fair value reported in the “Option Awards” column in the Summary Compensation Table for 2024. |
(c)
| In accordance with Item 402(v) requirements, the fair values of unvested and outstanding equity awards to our NEOs were remeasured as of the end of 2024, and as of each vesting date during 2024. We approached the determination of fair value in the same way as we historically have determined fair value and fair values as of each measurement date were determined using valuation assumptions and methodologies (including expected term, volatility, dividend yield, and risk-free interest rates) that are generally consistent with those used to estimate fair value at grant under US GAAP. See “Equity Incentive Plans” in Note 9 to our financial statements included in our Annual Report on Form 10-K for the year ended December 31, 2024 for additional details. |
(7)
| Total shareholder return is calculated by assuming that a $100 investment was made on the day prior to the first fiscal year reported below and reinvesting all dividends until the last day of each reported fiscal year. |
(8)
| The peer group is the same as the group used for compensation benchmarking that is disclosed in our “Compensation Discussion and Analysis,” which was updated in September 2024 as described under “Compensation Discussion and Analysis—Competitive Market Pay Information.” We have calculated total shareholder return for 2020, 2021, 2022, 2023 and 2024 using the 2024 Peer Group. Total shareholder return is calculated by assuming that a $100 investment was made on the day prior to the first fiscal year reported below and reinvesting all dividends until the last day of each reported fiscal year. In comparison, the value of $100 invested in the previous peer group would be as follows: 2024: $10.98; 2023: $18.70; 2022: $21.76; 2021: $62.29; 2020: $109.76. |
(9)
| The dollar amounts reported are the Company's net loss reflected in the Company’s audited financial statements. |
|
|
|
|
|
| Named Executive Officers, Footnote |
|
|
(1)
| Our first PEO was Laurent Fischer. |
(2)
| Our second PEO was Leone Patterson, who was the PEO for only part of 2020. |
(5)
| This figure is the average of the total compensation paid to our NEOs other than our PEO in each listed year, as shown in our Summary Compensation Table for such listed year. The names of the non-PEO NEOs in each year are listed in the table below. |
| | | | | | | | | | | | | 2020 | | | 2021 | | | 2022 | | | 2023 | | | 2024 | Aaron Osborne | | | Julie Clark | | | Richard Beckman | | | Linda Rubinstein | | | Rabia Gurses Ozden | Angela Thedinga | | | Christopher DeRespino | | | Rupert D’Souza | | | Setareh Seyedkazemi | | | Linda Rubinstein | | | | Rupert D’Souza | | | John Rakow | | | Peter Soparkar | | | Setareh Seyedkazemi | | | | Thomas Leung | | | Linda Rubinstein | | | | | | Peter Soparkar | | | | Leone Patterson | | | Setareh Seyedkazemi | | | | | | | | | | Brigit Riley | | | Peter Soparkar | | | | | | | | | | Peter Soparkar | | | | | | | | | | | | | Angela Thedinga | | | | | | | | | | | | | Jack Thrift | | | | | | | | | | | | | | | | | | | | | | |
|
|
|
|
|
| Peer Group Issuers, Footnote |
|
|
(8)
| The peer group is the same as the group used for compensation benchmarking that is disclosed in our “Compensation Discussion and Analysis,” which was updated in September 2024 as described under “Compensation Discussion and Analysis—Competitive Market Pay Information.” We have calculated total shareholder return for 2020, 2021, 2022, 2023 and 2024 using the 2024 Peer Group. Total shareholder return is calculated by assuming that a $100 investment was made on the day prior to the first fiscal year reported below and reinvesting all dividends until the last day of each reported fiscal year. In comparison, the value of $100 invested in the previous peer group would be as follows: 2024: $10.98; 2023: $18.70; 2022: $21.76; 2021: $62.29; 2020: $109.76. |
|
|
|
|
|
| Changed Peer Group, Footnote |
|
|
(8)
| The peer group is the same as the group used for compensation benchmarking that is disclosed in our “Compensation Discussion and Analysis,” which was updated in September 2024 as described under “Compensation Discussion and Analysis—Competitive Market Pay Information.” We have calculated total shareholder return for 2020, 2021, 2022, 2023 and 2024 using the 2024 Peer Group. Total shareholder return is calculated by assuming that a $100 investment was made on the day prior to the first fiscal year reported below and reinvesting all dividends until the last day of each reported fiscal year. In comparison, the value of $100 invested in the previous peer group would be as follows: 2024: $10.98; 2023: $18.70; 2022: $21.76; 2021: $62.29; 2020: $109.76. |
|
|
|
|
|
| Adjustment To PEO Compensation, Footnote |
|
|
(4)
| Compensation actually paid does not mean that our PEO was actually paid those amounts in 2024, but this is a dollar amount derived from the starting point of Summary Compensation Table total compensation under the methodology prescribed under the relevant rules as shown in the adjustment table below. |
| | | | | | | 2024 | Summary Compensation Table Total(a) | | | $4,131,290 | Subtract Grant Date Fair Value of Option Awards and Stock Awards Granted in Fiscal Year(b) | | | ($3,010,615) | Add Fair Value at Fiscal Year-End of Outstanding and Unvested Option Awards and Stock Awards Granted in Fiscal Year(c) | | | $1,088,642 | Adjust for Change in Fair Value of Outstanding and Unvested Option Awards and Stock Awards Granted in Prior Fiscal Years(c) | | | ($119,486) | Adjust for Fair Value at Vesting of Option Awards and Stock Awards Granted in Fiscal Year That Vested During Fiscal Year(c) | | | $0 | Adjust for Change in Fair Value as of Vesting Date of Option Awards and Stock Awards Granted in Prior Fiscal Years for Which Applicable Vesting Conditions Were Satisfied During Fiscal Year(c) | | | $290,149 | Subtract Fair Value as of Prior Fiscal Year-End of Option Awards and Stock Awards Granted in Prior Fiscal Years That Failed to Meet Applicable Vesting Conditions During Fiscal Year(c) | | | $0 | Add Value of Dividends or Other Earnings Paid on Stock or Option Awards Not Otherwise Reflected in Fair Value or Total Compensation | | | $0 | Compensation Actually Paid | | | $2,379,980 | | | | |
(a)
| We have not reported any amounts in our Summary Compensation Table with respect to “Change in Pension and Nonqualified Deferred Compensation” and, accordingly, the adjustments with respect to such items prescribed by the pay-versus-performance rules are not relevant to our analysis and no adjustments have been made. |
(b)
| The amounts reflect the aggregate grant-date fair value reported in the “Option Awards” column in the Summary Compensation Table for 2024. |
(c)
| In accordance with Item 402(v) requirements, the fair values of unvested and outstanding equity awards to our NEOs were remeasured as of the end of 2024, and as of each vesting date during 2024. We approached the determination of fair value in the same way as we historically have determined fair value and fair values as of each measurement date were determined using |
valuation assumptions and methodologies (including expected term, volatility, dividend yield, and risk-free interest rates) that are generally consistent with those used to estimate fair value at grant under US GAAP. See “Stock Plans” in Note 9 to our financial statements included in our Annual Report on Form 10-K for the year ended December 31, 2024 for additional details.
|
|
|
|
|
| Non-PEO NEO Average Total Compensation Amount |
|
|
$ 1,588,170
|
$ 1,334,573
|
$ 1,003,683
|
$ 2,039,077
|
$ 2,282,480
|
| Non-PEO NEO Average Compensation Actually Paid Amount |
|
|
$ 963,055
|
1,145,469
|
560,004
|
(686,060)
|
1,512,068
|
| Adjustment to Non-PEO NEO Compensation Footnote |
|
|
(6)
| This figure is the average of compensation actually paid for our NEOs other than our PEO in each listed year. Compensation actually paid does not mean that these NEOs were actually paid those amounts in the listed year, but this is a dollar amount derived from the starting point of Summary Compensation Table total compensation under the methodology prescribed under the SEC's rules as shown in the table below, with the indicated figures showing an average of such figure for all NEOs other than our PEO in each listed year. |
| | | | | | | 2024 | Summary Compensation Table Total(a) | | | $1,588,170 | Subtract Grant Date Fair Value of Option Awards and Stock Awards Granted in Fiscal Year(b) | | | ($908,893) | Add Fair Value at Fiscal Year-End of Outstanding and Unvested Option Awards and Stock Awards Granted in Fiscal Year(c) | | | $371,347 | Adjust for Change in Fair Value of Outstanding and Unvested Option Awards and Stock Awards Granted in Prior Fiscal Years(c) | | | ($87,537) | Adjust for Fair Value at Vesting of Option Awards and Stock Awards Granted in Fiscal Year That Vested During Fiscal Year(c) | | | $0 | Adjust for Change in Fair Value as of Vesting Date of Option Awards and Stock Awards Granted in Prior Fiscal Years for Which Applicable Vesting Conditions Were Satisfied During Fiscal Year(c) | | | ($32) | Subtract Fair Value as of Prior Fiscal Year-End of Option Awards and Stock Awards Granted in Prior Fiscal Years That Failed to Meet Applicable Vesting Conditions During Fiscal Year(c) | | | $0 | Add Value of Dividends or Other Earnings Paid on Stock or Option Awards Not Otherwise Reflected in Fair Value or Total Compensation | | | $0 | Compensation Actually Paid | | | $963,055 | | | | |
(a)
| We have not reported any amounts in our Summary Compensation Table with respect to “Change in Pension and Nonqualified Deferred Compensation” and, accordingly, the adjustments with respect to such items prescribed by the pay-versus-performance rules are not relevant to our analysis and no adjustments have been made. |
(b)
| The amounts reflect the aggregate grant-date fair value reported in the “Option Awards” column in the Summary Compensation Table for 2024. |
(c)
| In accordance with Item 402(v) requirements, the fair values of unvested and outstanding equity awards to our NEOs were remeasured as of the end of 2024, and as of each vesting date during 2024. We approached the determination of fair value in the same way as we historically have determined fair value and fair values as of each measurement date were determined using valuation assumptions and methodologies (including expected term, volatility, dividend yield, and risk-free interest rates) that are generally consistent with those used to estimate fair value at grant under US GAAP. See “Equity Incentive Plans” in Note 9 to our financial statements included in our Annual Report on Form 10-K for the year ended December 31, 2024 for additional details. |
|
|
|
|
|
| Compensation Actually Paid vs. Total Shareholder Return |
|
|
Compensation Actually Paid (CAP) Versus Total Shareholder Return (TSR) 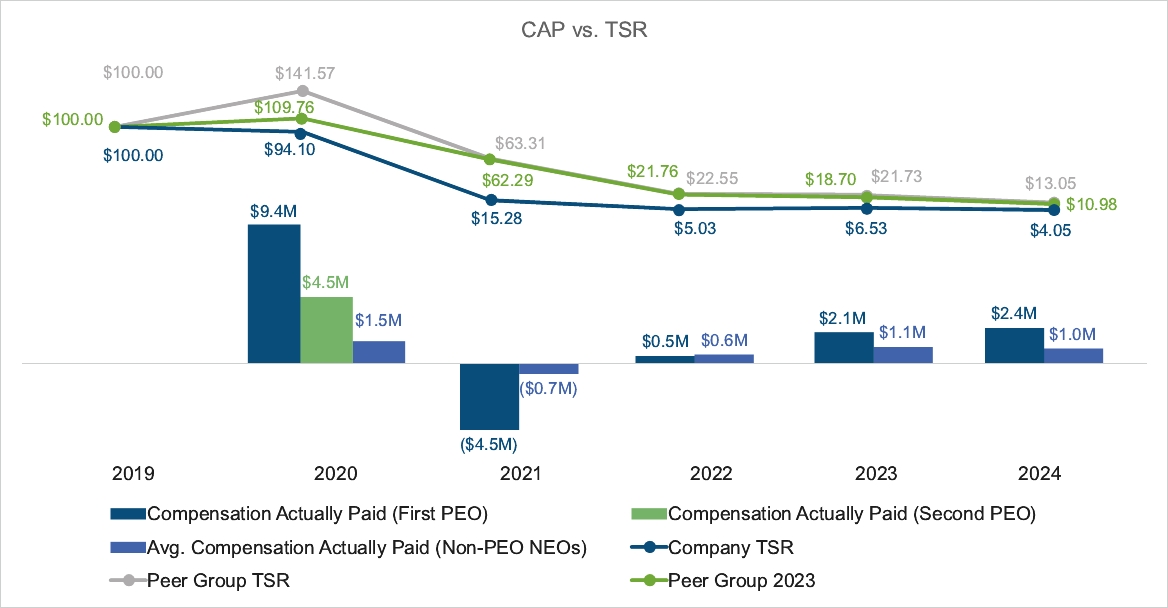
|
|
|
|
|
| Compensation Actually Paid vs. Net Income |
|
|
Compensation Actually Paid Versus Net Loss 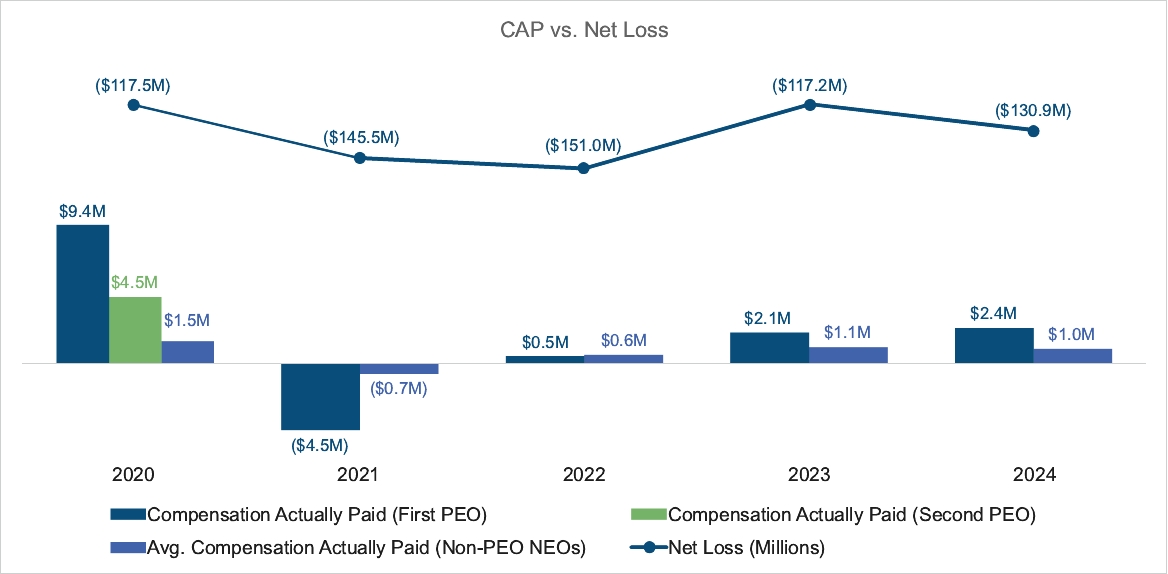
|
|
|
|
|
| Total Shareholder Return Vs Peer Group |
|
|
Compensation Actually Paid (CAP) Versus Total Shareholder Return (TSR)
|
|
|
|
|
| Total Shareholder Return Amount |
|
|
$ 4.05
|
6.53
|
5.03
|
15.28
|
94.1
|
| Peer Group Total Shareholder Return Amount |
|
|
13.05
|
21.73
|
22.55
|
63.31
|
141.57
|
| Net Income (Loss) |
|
|
$ (111,700,000)
|
$ (117,200,000)
|
$ (151,000,000)
|
$ (145,500,000)
|
(130,900,000)
|
| PEO Name |
Leone Patterson
|
Laurent Fischer
|
Laurent Fischer
|
Laurent Fischer
|
Laurent Fischer
|
Laurent Fischer
|
|
| Previous Peer Group Total Shareholder Return Amount |
|
|
$ 10.98
|
$ 18.7
|
$ 21.76
|
$ 62.29
|
109.76
|
| Laurent Fischer [Member] |
|
|
|
|
|
|
|
| Pay vs Performance Disclosure |
|
|
|
|
|
|
|
| PEO Total Compensation Amount |
|
|
4,131,290
|
1,546,477
|
2,906,639
|
8,996,489
|
21,298,608
|
| PEO Actually Paid Compensation Amount |
|
|
2,379,980
|
$ 2,136,238
|
$ 5,477,118
|
$ (4,543,508)
|
9,367,728
|
| Leone Patterson [Member] |
|
|
|
|
|
|
|
| Pay vs Performance Disclosure |
|
|
|
|
|
|
|
| PEO Total Compensation Amount |
|
|
|
|
|
|
4,317,964
|
| PEO Actually Paid Compensation Amount |
|
|
|
|
|
|
$ 4,527,456
|
| PEO | Laurent Fischer [Member] | Aggregate Grant Date Fair Value of Equity Award Amounts Reported in Summary Compensation Table |
|
|
|
|
|
|
|
| Pay vs Performance Disclosure |
|
|
|
|
|
|
|
| Adjustment to Compensation, Amount |
|
|
(3,010,615)
|
|
|
|
|
| PEO | Laurent Fischer [Member] | Year-end Fair Value of Equity Awards Granted in Covered Year that are Outstanding and Unvested |
|
|
|
|
|
|
|
| Pay vs Performance Disclosure |
|
|
|
|
|
|
|
| Adjustment to Compensation, Amount |
|
|
1,088,642
|
|
|
|
|
| PEO | Laurent Fischer [Member] | Year-over-Year Change in Fair Value of Equity Awards Granted in Prior Years That are Outstanding and Unvested |
|
|
|
|
|
|
|
| Pay vs Performance Disclosure |
|
|
|
|
|
|
|
| Adjustment to Compensation, Amount |
|
|
(119,486)
|
|
|
|
|
| PEO | Laurent Fischer [Member] | Vesting Date Fair Value of Equity Awards Granted and Vested in Covered Year |
|
|
|
|
|
|
|
| Pay vs Performance Disclosure |
|
|
|
|
|
|
|
| Adjustment to Compensation, Amount |
|
|
0
|
|
|
|
|
| PEO | Laurent Fischer [Member] | Change in Fair Value as of Vesting Date of Prior Year Equity Awards Vested in Covered Year |
|
|
|
|
|
|
|
| Pay vs Performance Disclosure |
|
|
|
|
|
|
|
| Adjustment to Compensation, Amount |
|
|
290,149
|
|
|
|
|
| PEO | Laurent Fischer [Member] | Prior Year End Fair Value of Equity Awards Granted in Any Prior Year that Fail to Meet Applicable Vesting Conditions During Covered Year |
|
|
|
|
|
|
|
| Pay vs Performance Disclosure |
|
|
|
|
|
|
|
| Adjustment to Compensation, Amount |
|
|
0
|
|
|
|
|
| PEO | Laurent Fischer [Member] | Dividends or Other Earnings Paid on Equity Awards not Otherwise Reflected in Total Compensation for Covered Year |
|
|
|
|
|
|
|
| Pay vs Performance Disclosure |
|
|
|
|
|
|
|
| Adjustment to Compensation, Amount |
|
|
0
|
|
|
|
|
| Non-PEO NEO | Aggregate Grant Date Fair Value of Equity Award Amounts Reported in Summary Compensation Table |
|
|
|
|
|
|
|
| Pay vs Performance Disclosure |
|
|
|
|
|
|
|
| Adjustment to Compensation, Amount |
|
|
(908,893)
|
|
|
|
|
| Non-PEO NEO | Year-end Fair Value of Equity Awards Granted in Covered Year that are Outstanding and Unvested |
|
|
|
|
|
|
|
| Pay vs Performance Disclosure |
|
|
|
|
|
|
|
| Adjustment to Compensation, Amount |
|
|
371,347
|
|
|
|
|
| Non-PEO NEO | Year-over-Year Change in Fair Value of Equity Awards Granted in Prior Years That are Outstanding and Unvested |
|
|
|
|
|
|
|
| Pay vs Performance Disclosure |
|
|
|
|
|
|
|
| Adjustment to Compensation, Amount |
|
|
(87,537)
|
|
|
|
|
| Non-PEO NEO | Vesting Date Fair Value of Equity Awards Granted and Vested in Covered Year |
|
|
|
|
|
|
|
| Pay vs Performance Disclosure |
|
|
|
|
|
|
|
| Adjustment to Compensation, Amount |
|
|
0
|
|
|
|
|
| Non-PEO NEO | Change in Fair Value as of Vesting Date of Prior Year Equity Awards Vested in Covered Year |
|
|
|
|
|
|
|
| Pay vs Performance Disclosure |
|
|
|
|
|
|
|
| Adjustment to Compensation, Amount |
|
|
(32)
|
|
|
|
|
| Non-PEO NEO | Prior Year End Fair Value of Equity Awards Granted in Any Prior Year that Fail to Meet Applicable Vesting Conditions During Covered Year |
|
|
|
|
|
|
|
| Pay vs Performance Disclosure |
|
|
|
|
|
|
|
| Adjustment to Compensation, Amount |
|
|
0
|
|
|
|
|
| Non-PEO NEO | Dividends or Other Earnings Paid on Equity Awards not Otherwise Reflected in Total Compensation for Covered Year |
|
|
|
|
|
|
|
| Pay vs Performance Disclosure |
|
|
|
|
|
|
|
| Adjustment to Compensation, Amount |
|
|
$ 0
|
|
|
|
|
Award Timing Disclosure
|
12 Months Ended |
Dec. 31, 2024 |
|---|
| Award Timing Disclosures [Line Items] |
|
| Award Timing MNPI Disclosure |
Policies and Practices Related to the Grant of Certain Equity Awards From time to time, the Company grants stock options to its employees, including the NEOs. Historically, the Company has granted new-hire option awards on or soon after a new hire’s employment start date. The Company frequently utilizes its 2017 Inducement Plan to grant options to new hires who qualify under the plan. The Company’s practice is to award employees, including NEOs, annual refresh option grants in the first quarter of each fiscal year, which refresh grants are typically approved at the regularly scheduled meeting of the Compensation Committee occurring in such quarter. Additionally, the Company occasionally issues discretionary stock options to its employees, including NEOs, which seek to accomplish specific goals, including employee retention or an adjustment associated with certain corporate events. Also, non-employee directors receive automatic grants of initial and annual stock option awards, at the time of a director’s initial appointment or election to the Board and at the time of each annual meeting of the Company’s stockholders, respectively, pursuant to the Non-Employee Director Compensation Policy, as further described under the heading, “Non-Employee Director Compensation—Non-Employee Director Compensation Policy” above. The Company does not otherwise maintain any written policies on the timing of awards of stock options, stock appreciation rights, or similar instruments with option-like features. The Compensation Committee considers whether there is any MNPI about the Company when determining the timing of stock option grants and does not seek to time the award of stock options in relation to the Company’s public disclosure of MNPI. The Company has not timed the release of MNPI for the purpose of affecting the value of executive compensation.
|
| Award Timing Method |
From time to time, the Company grants stock options to its employees, including the NEOs. Historically, the Company has granted new-hire option awards on or soon after a new hire’s employment start date. The Company frequently utilizes its 2017 Inducement Plan to grant options to new hires who qualify under the plan. The Company’s practice is to award employees, including NEOs, annual refresh option grants in the first quarter of each fiscal year, which refresh grants are typically approved at the regularly scheduled meeting of the Compensation Committee occurring in such quarter. Additionally, the Company occasionally issues discretionary stock options to its employees, including NEOs, which seek to accomplish specific goals, including employee retention or an adjustment associated with certain corporate events. Also, non-employee directors receive automatic grants of initial and annual stock option awards, at the time of a director’s initial appointment or election to the Board and at the time of each annual meeting of the Company’s stockholders, respectively, pursuant to the Non-Employee Director Compensation Policy, as further described under the heading, “Non-Employee Director Compensation—Non-Employee Director Compensation Policy” above.
|
| Award Timing Predetermined |
true
|
| Award Timing MNPI Considered |
true
|
| Award Timing, How MNPI Considered |
The Compensation Committee considers whether there is any MNPI about the Company when determining the timing of stock option grants and does not seek to time the award of stock options in relation to the Company’s public disclosure of MNPI. The Company has not timed the release of MNPI for the purpose of affecting the value of executive compensation.
|
| MNPI Disclosure Timed for Compensation Value |
false
|
