Pay vs Performance Disclosure - USD ($)
|
7 Months Ended |
12 Months Ended |
53 Months Ended |
Jul. 19, 2020 |
Dec. 31, 2024 |
Dec. 31, 2023 |
Dec. 31, 2022 |
Dec. 31, 2021 |
Dec. 31, 2020 |
Dec. 31, 2024 |
| Pay vs Performance Disclosure |
|
|
|
|
|
|
|
| Pay vs Performance Disclosure, Table |
|
| | | | | | | | | | | | | | | | | | | | | | | | | Summary | Summary | | | Average | | Value of Initial Fixed $100 | | | | | Compensation | Compensation | | | Summary | Average | Investment Based On: | | | | | Table | Table | Compensation | Compensation | Compensation | Compensation | | Peer | | | | | Total | Total | Actually | Actually | Table Total | Actually | | Group | | | | | for | for | Paid to | Paid to | for | Paid to | Total | Total | Net | Operating | | | First | Second | First | Second | Non-PEO | Non-PEO | Shareholder | Shareholder | Income | Income | | Year | PEO | PEO | PEO | PEO | NEOs | NEOs | Return | Return | (Millions) | (Millions) | | (a) | (b)(1) | (b)(2) | (c)(3) | (c)(4) | (d)(5) | (e)(6) | (f)(7) | (g)(8) | (h)(9) | (i)(10) | | | $ | $ | $ | $ | $ | $ | $ | $ | $ | $ | | | | | | | | | | | | | | 2024 | 6,183,621 | N/A | 4,443,474 | N/A | 1,884,816 | 1,748,225 | 57.90 | 118.38 | 90 | 156 | | 2023 | 5,678,799 | N/A | 4,082,621 | N/A | 1,810,735 | 1,849,106 | 84.84 | 122.32 | 227 | (87) | | 2022 | 5,375,311 | N/A | 4,366,995 | N/A | 1,854,999 | 1,938,756 | 89.49 | 132.83 | 582 | 657 | | 2021 | 5,653,886 | N/A | 4,243,843 | N/A | 2,284,297 | 1,785,252 | 93.07 | 119.61 | 571 | 458 | | 2020 | 4,104,135 | 3,234,300 | 2,939,282 | 1,548,910 | 2,984,015 | 1,995,859 | 71.51 | 103.50 | 283 | 245 | |
| (1) | R. Steer was appointed to President and Chief Executive Officer on July 20, 2020. The dollar amounts reported in column (b) with respect to the First PEO are the amounts of total compensation reported for R. Steer (our current President and Chief Executive Officer) for each corresponding year in the “Total” column of the Summary Compensation Table. Refer to “Executive Compensation and Other Information – Summary Compensation Table.” |
| (2) | The dollar amount reported in column (b) with respect to the Second PEO is the amount of total compensation reported for Steven J. Bresky (our former President and Chief Executive Officer) for the corresponding year in the “Total” column of the Summary Compensation Table. S. Bresky passed away in July 2020 and his annual salary and bonus for 2020 were prorated for his tenure as President and Chief Executive Officer in 2020. |
| (3) | The dollar amounts reported in column (c) with respect to the First PEO represent the amount of “compensation actually paid” to R. Steer, as computed in accordance with Item 402(v) of Regulation S-K. The dollar amounts do not reflect the actual amount of compensation earned by or paid to R. Steer during the applicable years. The pension benefit adjustments only include average service cost. There was no prior service cost. In accordance with the requirements of Item 402(v) of Regulation S-K, the following adjustments were made to R. Steer’s total compensation for each year to determine the compensation actually paid: |
| | | | | | | | | | | | | | | Year | Reported Summary Compensation Table Total for First PEO | Reported Change in Pension Value and Non-Qualified Deferred Compensation Earnings | Pension Benefit Adjustments | Compensation Actually Paid to First PEO | | $ | $ | $ | $ | 2024 | 6,183,621 | (1,771,026) | 30,879 | 4,443,474 | 2023 | 5,678,799 | (1,625,253) | 29,075 | 4,082,621 | 2022 | 5,375,311 | (1,045,695) | 37,379 | 4,366,995 | 2021 | 5,653,886 | (1,447,513) | 37,470 | 4,243,843 | 2020 | 4,104,135 | (1,199,183) | 34,330 | 2,939,282 |
| (4) | The dollar amount reported in column (c) with respect to the Second PEO represent the amount of “compensation actually paid” to S. Bresky, as computed in accordance with Item 402(v) of Regulation S-K. The dollar amounts do not reflect the actual amount of compensation earned by or paid to S. Bresky during the applicable year. The pension benefit adjustments only include average service cost. There was no prior service cost. In accordance with the requirements of Item 402(v) of Regulation S-K, the following adjustments were made to S. Bresky’s total compensation for 2020 to determine the compensation actually paid: |
| | | | | | | | | | | Year | Reported Summary Compensation Table Total for Second PEO | Reported Change in Pension Value and Non-Qualified Deferred Compensation Earnings | Pension Benefit Adjustments | Compensation Actually Paid to Second PEO | | $ | $ | $ | $ | 2020 | 3,234,300 | (1,711,634) | 26,244 | 1,548,910 |
| (5) | The dollar amounts reported in column (d) represent the average of the amounts reported for the Company’s Named Executive Officers as a group (excluding R. Steer and S. Bresky, who each served as President and Chief Executive Officer during the periods stated above) in the “Total” column of the Summary Compensation Table in each applicable year. The names of the Named Executive Officers (excluding R. Steer and S. Bresky) included for purposes of calculating the average amounts in each applicable year are as follows: (i) for 2024, D. Rankin, E. Gonzalez, J. Bresky and D. Becker; (ii) for 2023, D. Rankin, E. Gonzalez, Peter B. Brown (former President of Seaboard Foods LLC), and J. Bresky; (iii) for 2022, D. Rankin, E. Gonzalez, David M. Dannov (former President of Seaboard Overseas and Trading Group) and Peter B. Brown; (iv) for 2021, D. Rankin, E. Gonzalez, David M. Dannov, and Peter B. Brown; and (v) for 2020, D. Rankin, E. Gonzalez, David M. Dannov and Darwin E. Sand (former President of Seaboard Foods LLC). |
| (6) | The dollar amounts reported in column (e) represent the average amount of “compensation actually paid” to the Company’s Named Executive Officers as a group (excluding R. Steer and S. Bresky), as computed in accordance with Item 402(v) of Regulation S-K. The dollar amounts do not represent the actual average amount of compensation earned or paid to the Named Executive Officers as a group (excluding R. Steer and S. Bresky) during the applicable years. The pension benefit adjustments only include average service cost. There was no prior service cost. In accordance with the requirements of Item 402(v) of Regulation S-K, the following adjustments were made to average total compensation for the Named Executive Officers as a group (excluding R. Steer and S. Bresky) for each year to determine the compensation actually paid, using the same methodology described in Notes 3 and 4 above. |
| | | | | | | | | | | Year | Average Reported Summary Compensation Table Total for Non-PEO NEOs | Average Reported Change in Pension Value and Non-Qualified Deferred Compensation Earnings | Average Pension Benefit Adjustments | Average Compensation Actually Paid to Non-PEO NEOs | | $ | $ | $ | $ | 2024 | 1,884,816 | (191,839) | 55,248 | 1,748,225 | 2023 | 1,810,735 | (35,184) | 73,555 | 1,849,106 | 2022 | 1,854,999 | (44,126) | 127,883 | 1,938,756 | 2021 | 2,284,297 | (608,999) | 109,954 | 1,785,252 | 2020 | 2,984,015 | (1,150,234) | 162,078 | 1,995,859 |
| (7) | The cumulative total shareholder return (“TSR”) values set forth in column (f) are calculated by dividing the sum of the cumulative amount of dividends for the measurement period and the difference between the Company’s share price at the end and the beginning of the measurement period by the Company’s share price at the beginning of the measurement period. |
| (8) | The values set forth in column (g) represent the weighted peer group TSR, weighted according to the respective companies’ stock market capitalization at the beginning of each period for which a return is indicated. The peer group used for this purpose is the following published industry indices: the Dow Jones U.S. Food Products and Dow Jones U.S. Marine Transportation Industry. |
| (9) | The dollar amounts reported in column (h) represent the amount of net income reflected in the Company’s audited financial statements for the applicable years. |
| (10) | The Company has determined that Operating Income is the financial performance measure that, in the Company’s assessment, represents the most important performance measure (that is not otherwise required to be disclosed in the table) used by the Company to link compensation actually paid to the Company’s Named Executive Officers, for the most recently completed fiscal year, to Company performance. The dollar amounts reported in column (i) represent the amount of operating income reflected in the Company’s audited financial statements for the applicable years. |
|
|
|
|
|
|
| Company Selected Measure Name |
|
Operating Income
|
|
|
|
|
|
| Named Executive Officers, Footnote |
| (2) | The dollar amount reported in column (b) with respect to the Second PEO is the amount of total compensation reported for Steven J. Bresky (our former President and Chief Executive Officer) for the corresponding year in the “Total” column of the Summary Compensation Table. S. Bresky passed away in July 2020 and his annual salary and bonus for 2020 were prorated for his tenure as President and Chief Executive Officer in 2020. |
|
| (5) | The dollar amounts reported in column (d) represent the average of the amounts reported for the Company’s Named Executive Officers as a group (excluding R. Steer and S. Bresky, who each served as President and Chief Executive Officer during the periods stated above) in the “Total” column of the Summary Compensation Table in each applicable year. The names of the Named Executive Officers (excluding R. Steer and S. Bresky) included for purposes of calculating the average amounts in each applicable year are as follows: (i) for 2024, D. Rankin, E. Gonzalez, J. Bresky and D. Becker; (ii) for 2023, D. Rankin, E. Gonzalez, Peter B. Brown (former President of Seaboard Foods LLC), and J. Bresky; (iii) for 2022, D. Rankin, E. Gonzalez, David M. Dannov (former President of Seaboard Overseas and Trading Group) and Peter B. Brown; (iv) for 2021, D. Rankin, E. Gonzalez, David M. Dannov, and Peter B. Brown; and (v) for 2020, D. Rankin, E. Gonzalez, David M. Dannov and Darwin E. Sand (former President of Seaboard Foods LLC). |
|
|
|
|
|
| (1) | R. Steer was appointed to President and Chief Executive Officer on July 20, 2020. The dollar amounts reported in column (b) with respect to the First PEO are the amounts of total compensation reported for R. Steer (our current President and Chief Executive Officer) for each corresponding year in the “Total” column of the Summary Compensation Table. Refer to “Executive Compensation and Other Information – Summary Compensation Table.” |
|
| Peer Group Issuers, Footnote |
|
| (8) | The values set forth in column (g) represent the weighted peer group TSR, weighted according to the respective companies’ stock market capitalization at the beginning of each period for which a return is indicated. The peer group used for this purpose is the following published industry indices: the Dow Jones U.S. Food Products and Dow Jones U.S. Marine Transportation Industry. |
|
|
|
|
|
|
| Adjustment To PEO Compensation, Footnote |
| (4) | The dollar amount reported in column (c) with respect to the Second PEO represent the amount of “compensation actually paid” to S. Bresky, as computed in accordance with Item 402(v) of Regulation S-K. The dollar amounts do not reflect the actual amount of compensation earned by or paid to S. Bresky during the applicable year. The pension benefit adjustments only include average service cost. There was no prior service cost. In accordance with the requirements of Item 402(v) of Regulation S-K, the following adjustments were made to S. Bresky’s total compensation for 2020 to determine the compensation actually paid: |
| | | | | | | | | | | Year | Reported Summary Compensation Table Total for Second PEO | Reported Change in Pension Value and Non-Qualified Deferred Compensation Earnings | Pension Benefit Adjustments | Compensation Actually Paid to Second PEO | | $ | $ | $ | $ | 2020 | 3,234,300 | (1,711,634) | 26,244 | 1,548,910 |
|
|
|
|
|
|
| (3) | The dollar amounts reported in column (c) with respect to the First PEO represent the amount of “compensation actually paid” to R. Steer, as computed in accordance with Item 402(v) of Regulation S-K. The dollar amounts do not reflect the actual amount of compensation earned by or paid to R. Steer during the applicable years. The pension benefit adjustments only include average service cost. There was no prior service cost. In accordance with the requirements of Item 402(v) of Regulation S-K, the following adjustments were made to R. Steer’s total compensation for each year to determine the compensation actually paid: |
| | | | | | | | | | | | | | | Year | Reported Summary Compensation Table Total for First PEO | Reported Change in Pension Value and Non-Qualified Deferred Compensation Earnings | Pension Benefit Adjustments | Compensation Actually Paid to First PEO | | $ | $ | $ | $ | 2024 | 6,183,621 | (1,771,026) | 30,879 | 4,443,474 | 2023 | 5,678,799 | (1,625,253) | 29,075 | 4,082,621 | 2022 | 5,375,311 | (1,045,695) | 37,379 | 4,366,995 | 2021 | 5,653,886 | (1,447,513) | 37,470 | 4,243,843 | 2020 | 4,104,135 | (1,199,183) | 34,330 | 2,939,282 |
|
| Non-PEO NEO Average Total Compensation Amount |
|
$ 1,884,816
|
$ 1,810,735
|
$ 1,854,999
|
$ 2,284,297
|
$ 2,984,015
|
|
| Non-PEO NEO Average Compensation Actually Paid Amount |
|
$ 1,748,225
|
1,849,106
|
1,938,756
|
1,785,252
|
1,995,859
|
|
| Adjustment to Non-PEO NEO Compensation Footnote |
|
| (6) | The dollar amounts reported in column (e) represent the average amount of “compensation actually paid” to the Company’s Named Executive Officers as a group (excluding R. Steer and S. Bresky), as computed in accordance with Item 402(v) of Regulation S-K. The dollar amounts do not represent the actual average amount of compensation earned or paid to the Named Executive Officers as a group (excluding R. Steer and S. Bresky) during the applicable years. The pension benefit adjustments only include average service cost. There was no prior service cost. In accordance with the requirements of Item 402(v) of Regulation S-K, the following adjustments were made to average total compensation for the Named Executive Officers as a group (excluding R. Steer and S. Bresky) for each year to determine the compensation actually paid, using the same methodology described in Notes 3 and 4 above. |
| | | | | | | | | | | Year | Average Reported Summary Compensation Table Total for Non-PEO NEOs | Average Reported Change in Pension Value and Non-Qualified Deferred Compensation Earnings | Average Pension Benefit Adjustments | Average Compensation Actually Paid to Non-PEO NEOs | | $ | $ | $ | $ | 2024 | 1,884,816 | (191,839) | 55,248 | 1,748,225 | 2023 | 1,810,735 | (35,184) | 73,555 | 1,849,106 | 2022 | 1,854,999 | (44,126) | 127,883 | 1,938,756 | 2021 | 2,284,297 | (608,999) | 109,954 | 1,785,252 | 2020 | 2,984,015 | (1,150,234) | 162,078 | 1,995,859 |
|
|
|
|
|
|
| Compensation Actually Paid vs. Total Shareholder Return |
|
Compensation Actually Paid and Cumulative TSR: 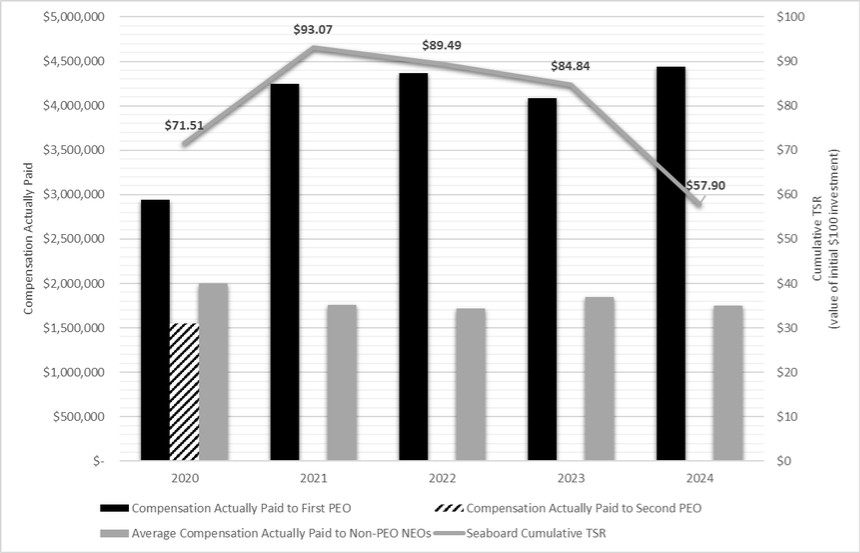
|
|
|
|
|
|
| Compensation Actually Paid vs. Net Income |
|
Compensation Actually Paid and Net Income: 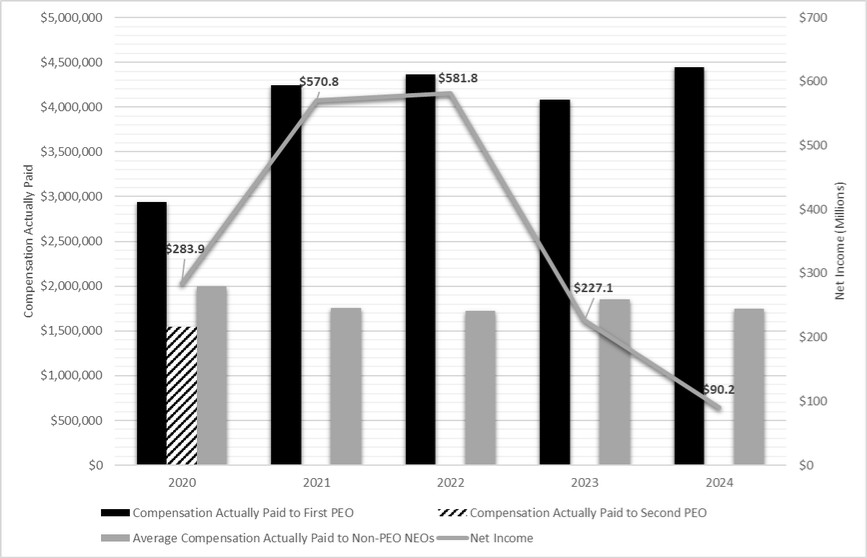
|
|
|
|
|
|
| Compensation Actually Paid vs. Company Selected Measure |
|
Compensation Actually Paid and Operating Income: 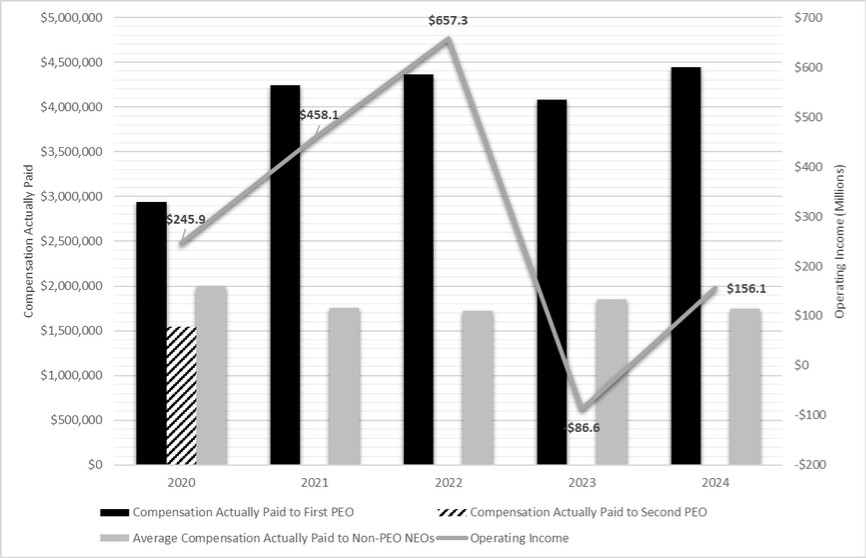
|
|
|
|
|
|
| Total Shareholder Return Vs Peer Group |
|
Company TSR and Peer Group TSR: 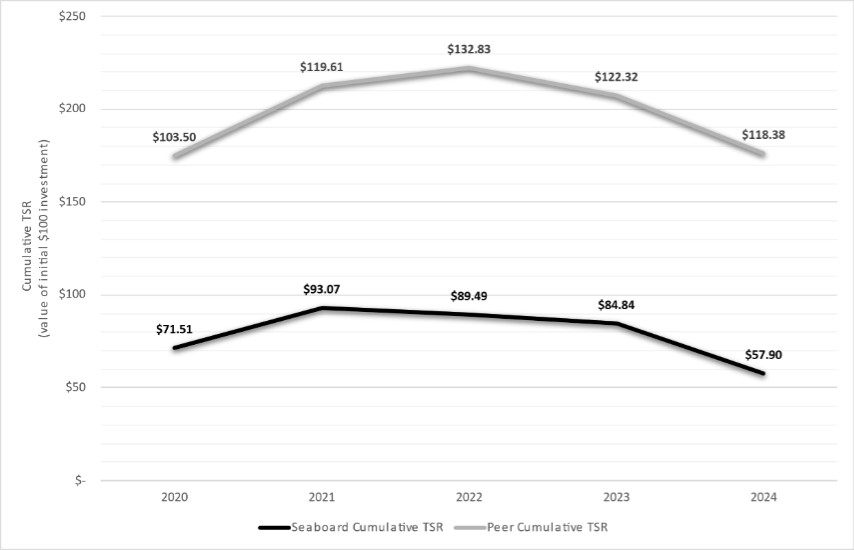
|
|
|
|
|
|
| Total Shareholder Return Amount |
|
$ 57.9
|
84.84
|
89.49
|
93.07
|
71.51
|
|
| Peer Group Total Shareholder Return Amount |
|
118.38
|
122.32
|
132.83
|
119.61
|
103.5
|
|
| Net Income (Loss) |
|
$ 90,000,000
|
$ 227,000,000
|
$ 582,000,000
|
$ 571,000,000
|
$ 283,000,000
|
|
| Company Selected Measure Amount |
|
156,000,000
|
(87,000,000)
|
657,000,000
|
458,000,000
|
245,000,000
|
|
| Measure:: 1 |
|
|
|
|
|
|
|
| Pay vs Performance Disclosure |
|
|
|
|
|
|
|
| Name |
|
Operating Income
|
|
|
|
|
|
| Measure:: 2 |
|
|
|
|
|
|
|
| Pay vs Performance Disclosure |
|
|
|
|
|
|
|
| Non-GAAP Measure Description |
|
| (7) | The cumulative total shareholder return (“TSR”) values set forth in column (f) are calculated by dividing the sum of the cumulative amount of dividends for the measurement period and the difference between the Company’s share price at the end and the beginning of the measurement period by the Company’s share price at the beginning of the measurement period. |
|
|
|
|
|
|
| First PEO |
|
|
|
|
|
|
|
| Pay vs Performance Disclosure |
|
|
|
|
|
|
|
| PEO Total Compensation Amount |
|
$ 6,183,621
|
$ 5,678,799
|
$ 5,375,311
|
$ 5,653,886
|
$ 4,104,135
|
|
| PEO Actually Paid Compensation Amount |
|
$ 4,443,474
|
4,082,621
|
4,366,995
|
4,243,843
|
2,939,282
|
|
| PEO Name |
|
R. Steer
|
|
|
|
|
|
| Second PEO |
|
|
|
|
|
|
|
| Pay vs Performance Disclosure |
|
|
|
|
|
|
|
| PEO Total Compensation Amount |
|
|
|
|
|
3,234,300
|
|
| PEO Actually Paid Compensation Amount |
|
|
|
|
|
1,548,910
|
|
| PEO | First PEO | Aggregate Change in Present Value of Accumulated Benefit for All Pension Plans Reported in Summary Compensation Table |
|
|
|
|
|
|
|
| Pay vs Performance Disclosure |
|
|
|
|
|
|
|
| Adjustment to Compensation, Amount |
|
$ (1,771,026)
|
(1,625,253)
|
(1,045,695)
|
(1,447,513)
|
(1,199,183)
|
|
| PEO | First PEO | Aggregate Pension Adjustments Service Cost |
|
|
|
|
|
|
|
| Pay vs Performance Disclosure |
|
|
|
|
|
|
|
| Adjustment to Compensation, Amount |
|
30,879
|
29,075
|
37,379
|
37,470
|
34,330
|
|
| PEO | Second PEO | Aggregate Change in Present Value of Accumulated Benefit for All Pension Plans Reported in Summary Compensation Table |
|
|
|
|
|
|
|
| Pay vs Performance Disclosure |
|
|
|
|
|
|
|
| Adjustment to Compensation, Amount |
|
|
|
|
|
(1,711,634)
|
|
| PEO | Second PEO | Aggregate Pension Adjustments Service Cost |
|
|
|
|
|
|
|
| Pay vs Performance Disclosure |
|
|
|
|
|
|
|
| Adjustment to Compensation, Amount |
|
|
|
|
|
26,244
|
|
| Non-PEO NEO | Aggregate Change in Present Value of Accumulated Benefit for All Pension Plans Reported in Summary Compensation Table |
|
|
|
|
|
|
|
| Pay vs Performance Disclosure |
|
|
|
|
|
|
|
| Adjustment to Compensation, Amount |
|
(191,839)
|
(35,184)
|
(44,126)
|
(608,999)
|
(1,150,234)
|
|
| Non-PEO NEO | Aggregate Pension Adjustments Service Cost |
|
|
|
|
|
|
|
| Pay vs Performance Disclosure |
|
|
|
|
|
|
|
| Adjustment to Compensation, Amount |
|
$ 55,248
|
$ 73,555
|
$ 127,883
|
$ 109,954
|
$ 162,078
|
|
