BONK Finds Stability At $0.00004002, Can Bulls Spark A Comeback?
06 Dicembre 2024 - 2:00AM
NEWSBTC
Recent trading activity indicates that BONK is maintaining
stability at the critical $0.00004002 support level. This
stabilization comes after a period of downward pressure, raising
speculations of a rebound on the horizon. With bulls showing
signs of resilience, the stage is set for a comeback that could
redefine BONK’s near-term trajectory. Will this level be the
springboard for a recovery, or is further consolidation needed
before the next move? Support Holds Steady: Signs Of A Bullish
Rebound As market sentiment teeters between caution and optimism,
determining the meme coin’s recent hold at the $0.00004002 support
level is crucial in order for investors and traders to reevaluate
their positions ahead of potential volatility. Related Reading:
BONK Jumps 20% As ‘Dog Season’ Starts, Analyst Says On the 4-hour
chart, BONK is exhibiting a steady upward trajectory despite
trading below the 100-day Simple Moving Average (SMA). After
rebounding strongly from the critical $0.00004002 support level,
the asset is making strides to extend its gains, aiming toward the
$0.00006247 resistance zone. A successful breach above the 100-day
SMA could further validate its recovery, possibly opening the door
to higher levels. Also, the formation of the 4-hour Relative
Strength Index (RSI) reveals a resurgence in buying pressure and a
shift toward a more bullish market sentiment. When the RSI rises
and reaches 50%, it could confirm its upside movement, giving BONK
the strength to push higher and test key resistance levels. BONK
Performance On The Daily Time Frame BONK is showing signs of a
potential upward movement on the daily chart, staying above the
100-day SMA after a rebound at the $0.00004002 support level. Its
maintenance above this support provides a foundation for further
growth. If BONK can maintain its position above this level and
continue building momentum, it could pave the way for a breakout
and more upside movement. Furthermore, the daily RSI shows signs of
a rebound, maintaining a steady position above the 50% threshold.
The continued trend above this level implies that the asset is in a
favorable position for more gains, with the possibility of a
sustained rally. Should the RSI continue to climb, it could
indicate growing confidence among traders and signal positive price
action for the meme coin. Related Reading: Is BONK Rally In
Jeopardy? Technical Indicators Confirm Weakness Thus far, BONK is
at a pivotal moment, having found stability above the $0.00004002
support level and the daily 100-day SMA. If Bonk can sustain its
position above this support and build on its current momentum, a
potential recovery could be underway, possibly driving the price
toward the $0.00006247 resistance level and beyond. Nonetheless,
failure to maintain $0.00004002 may alter the meme coin’s direction
to the downside, causing it to retest lower support zones such as
$0.00002962 and $0.00002320. Featured image from Medium, chart from
Tradingview.com
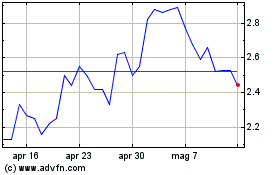
Grafico Azioni Optimism (COIN:OPUSD)
Storico
Da Feb 2025 a Mar 2025

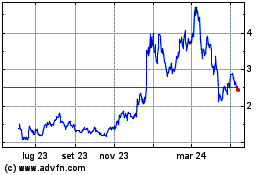
Grafico Azioni Optimism (COIN:OPUSD)
Storico
Da Mar 2024 a Mar 2025
