UNITED STATES
SECURITIES AND EXCHANGE COMMISSION
Washington, D.C. 20549
FORM 10-K
(Mark One)
☒ ANNUAL REPORT PURSUANT TO SECTION 13 OR 15(d) OF THE SECURITIES EXCHANGE ACT OF 1934
For the fiscal year ended December 31, 2024
OR
☐ TRANSITION REPORT PURSUANT TO SECTION 13 OR 15(d) OF THE SECURITIES EXCHANGE ACT OF 1934
For the transition period from to
Commission file number: 000-21467
ALTO INGREDIENTS, INC.
(Exact name of registrant as specified in its
charter)
| Delaware | | 41-2170618 |
(State or other jurisdiction of
incorporation or organization) | | (I.R.S. Employer
Identification No.) |
| 1300 South Second Street, Pekin, Illinois | | 61554 |
| (Address of principal executive offices) | | (Zip Code) |
Registrant’s telephone number, including
area code: (833) 710-2586
Securities registered pursuant to Section 12(b)
of the Act:
| Title of each Class | | Trading Symbol | | Name of Exchange on Which
Registered |
| Common Stock, $0.001 par value | | ALTO | | The Nasdaq Stock Market LLC (Nasdaq Capital Market) |
Securities registered pursuant to Section 12(g)
of the Act: None
Indicate
by check mark if the registrant is a well-known seasoned issuer, as defined in Rule 405 of the Securities Act.
Yes ☐ No ☒
Indicate
by check mark if the registrant is not required to file reports pursuant to Section 13 or Section 15(d) of the Act. Yes ☐ No ☒
Indicate
by check mark whether the registrant (1) has filed all reports required to be filed by Section 13 or 15(d) of the Securities Exchange
Act of 1934 during the preceding 12 months (or for such shorter period that the registrant was required to file such reports), and (2)
has been subject to such filing requirements for the past 90 days. Yes ☒ No ☐
Indicate
by check mark whether the registrant has submitted electronically every Interactive Data File required to be submitted pursuant to Rule
405 of Regulation S-T (§232.405 of this chapter) during the preceding 12 months (or for such shorter period that the registrant
was required to submit such files). Yes ☒ No ☐
Indicate
by check mark whether the registrant is a large accelerated filer, an accelerated filer, a non-accelerated filer, a smaller reporting
company, or an emerging growth company. See the definitions of “large accelerated filer,” “accelerated filer,”
“smaller reporting company,” and “emerging growth company” in Rule 12b-2 of the Exchange Act.
| Large accelerated filer | ☐ | Accelerated filer | ☒ |
| Non-accelerated
filer | ☐ | Smaller reporting company | ☒ |
| | | Emerging growth company | ☐ |
If an emerging
growth company, indicate by check mark if the registrant has elected not to use the extended transition period for complying with any
new or revised financial accounting standards provided pursuant to Section 13(a) of the Exchange Act. ☐
Indicate
by check mark whether the registrant has filed a report on and attestation to its management’s assessment of the effectiveness
of its internal control over financial reporting under Section 404(b) of the Sarbanes-Oxley Act (15 U.S.C. 7262(b)) by the registered
public accounting firm that prepared or issued its audit report. ☒
If securities
are registered pursuant to Section 12(b) of the Act, indicate by check mark whether the financial statements of the registrant included
in the filing reflect the correction of an error to previously issued financial statements. ☐
Indicate
by check mark whether any of those error corrections are restatements that required a recovery analysis of incentive-based compensation
received by any of the registrant’s executive officers during the relevant recovery period pursuant to §240.10D-1(b). ☐
Indicate
by check mark whether the registrant is a shell company (as defined in Rule 12b-2 of the Act). Yes ☐ No ☒
The aggregate
market value of the voting and non-voting common equity held by nonaffiliates of the registrant computed by reference to the closing
sale price of such stock, was approximately $105 million as of June 28, 2024, the last business day of the registrant’s most recently
completed second fiscal quarter.
As of
March 12, 2025, there were 76,611,090 shares of the registrant’s common stock, $0.001 par value per share, and 896 shares of
the registrant’s non-voting common stock, $0.001 par value per share, outstanding.
DOCUMENTS
INCORPORATED BY REFERENCE:
The information
required by Part III of this Report, to the extent not set forth herein, is incorporated herein by reference from the registrant’s
definitive Proxy Statement relating to the 2025 Annual Meeting of Stockholders (“Proxy Statement”), which definitive Proxy
Statement shall be filed with the Securities and Exchange Commission within 120 days after the end of the fiscal year to which this Report
relates.
TABLE OF CONTENTS
CAUTIONARY STATEMENT
All statements included or incorporated by
reference in this Annual Report on Form 10-K, other than statements or characterizations of historical fact, are forward-looking statements.
Examples of forward-looking statements include, but are not limited to, statements concerning projected net sales, costs and expenses,
and margins; the expected timing, cost and effects of our capital improvement projects,
including our carbon capture and storage project, and other strategic and business initiatives; expectations surrounding our repairs
and maintenance activities and their timing, costs and effects; our business outlook and expected performance in future periods; the
sufficiency of our liquidity and capital resources; our ability to continue as a going concern; our accounting estimates, assumptions
and judgments; the demand for specialty alcohols and essential ingredients; the competitive nature of and anticipated growth in our industry;
production capacity and goals; our ability to consummate acquisitions, if any, and integrate their operations successfully; and our prospective
needs for additional capital. These forward-looking statements are based on our current expectations, estimates, approximations and projections
about our industry and business, management’s beliefs, and certain assumptions made by us, all of which are subject to change.
Forward-looking statements can often be identified by words such as “anticipates,” “expects,” “intends,”
“plans,” “predicts,” “believes,” “seeks,” “estimates,” “may,”
“will,” “should,” “would,” “could,” “potential,” “continue,”
“ongoing,” similar expressions and variations or negatives of these words. These statements are not guarantees of future
performance and are subject to risks, uncertainties and assumptions that are difficult to predict. Therefore, our actual results could
differ materially and adversely from those expressed in any forward-looking statements as a result of various factors, some of which
are listed under “Risk Factors” in Item 1A of this report. These forward-looking statements speak only as of the date of
this report. We undertake no obligation to revise or update publicly any forward-looking statement for any reason, except as otherwise
required by law.
PART I
Item 1. Business.
Business Overview
We are a leading producer and distributor of specialty
alcohols, renewable fuels and essential ingredients in the United States.
We operate five alcohol production facilities.
Three of our production facilities are located in Illinois, one is located in Oregon and another is located in Idaho. We have an annual
alcohol production capacity of 350 million gallons, including both renewable fuels and specialty alcohols ranging from industrial-, pharmaceutical-,
and high-quality food- and beverage-grade alcohols. Of this amount, we can produce up to 110 million gallons annually of specialty alcohols,
depending on our product mix among high-quality beverage-grade alcohol and other quality specification alcohols. We market and distribute
all of the alcohols produced at our facilities as well as alcohols produced by third parties. In 2024, we marketed and distributed approximately
386 million gallons combined of our own produced alcohols as well as fuel-grade ethanol produced by third parties, and over 1.4 million
tons of essential ingredients on a dry matter basis.
We also own and operate a liquid carbon dioxide,
or CO2, production facility adjacent to our plant in Oregon for the offtake of CO2 gas from the plant for conversion
to liquid CO2 and subsequent sale. We acquired this facility on January 1, 2025.
In addition, we break bulk and distribute
specialty alcohols, produced by us and third parties, through our Eagle Alcohol business.
We report our financial and operating performance
in three distinct segments:
| ● | Pekin
production, which includes the production and sale of alcohols and essential ingredients
produced at our three production facilities located in Pekin, Illinois, which we refer to
as our Pekin Campus; |
| ● | Marketing
and distribution, which includes marketing and merchant trading for company-produced
alcohols and essential ingredients on an aggregated basis, and sales of fuel-grade ethanol
sourced from third parties; and |
| ● | Western
production, which includes the production and sale of renewable fuels and essential
ingredients and, beginning in 2025, liquid CO2, produced at our western production
facilities, including our liquid CO2 plant, on an aggregated basis, none of which
are individually so significant as to be considered a separately reportable segment. |
Our mission is to produce the highest quality,
sustainable ingredients that make everyday products better. We intend to accomplish this goal in part by investing in our specialized
and higher value specialty alcohol production and distribution infrastructure, expanding production in high-demand essential ingredients,
expanding and extending the sale of our products into new regional and international markets, building efficiencies and economies of
scale and by capturing a greater portion of the value stream.
Production Segments
We produce specialty alcohols, renewable
fuels and essential ingredients, focusing on five key markets: Health, Home & Beauty; Food & Beverage; Industry
& Agriculture; Essential Ingredients; and Renewable Fuels. Products for Health, Home & Beauty
markets include specialty alcohols used in mouthwash, cosmetics, pharmaceuticals, hand sanitizers, disinfectants and cleaners.
Products for Food & Beverage markets include grain neutral spirits used in alcoholic beverages and vinegar and corn germ
used for corn oils. Products for Industry & Agriculture markets include alcohols and other products for paint
applications, vehicle fluids and fertilizers. Products for Essential Ingredients markets include dried yeast, corn protein
meal, corn protein feed, corn germ, distillers grains, liquid CO2 and liquid feed used in commercial animal feed and pet
foods. We also sell yeast and liquid CO2 for human consumption. Our products for the Renewable Fuels markets
include fuel-grade ethanol and distillers corn oil used as a feedstock for renewable diesel and biodiesel fuels. Our specialty
alcohols for the Industry & Agriculture, Food & Beverage and Health, Home & Beauty markets represented
approximately 12%, 7% and 3%, respectively, of our sales in 2024 from these three markets.
We produce our alcohols and essential ingredients
at our facilities described below. Our production facilities located in Illinois are in the heart of the Corn Belt, benefit from relatively
low-cost and abundant feedstock and enjoy logistical advantages that enable us to provide our products to both domestic and international
markets via truck, rail or barge. Our production facilities located in Oregon and Idaho are near their respective fuel and feed customers,
offering significant timing, product transportation cost and logistical advantages.
All of our production facilities, other than our
Magic Valley plant, were operating for all of 2024, subject to scheduled and unscheduled downtimes to address facility repair and maintenance.
In January 2024, we temporarily hot-idled our
Magic Valley facility to minimize losses from negative regional crush margins and to expedite the installation of additional equipment
to achieve the intended production rate, quality and consistency from our corn oil and high protein system at the facility. We restarted
our Magic Valley facility in July 2024 and by October 2024, the facility consistently achieved average ethanol production rates at full
capacity, the protein content yield from the plant reached 50% or greater, and we were able to expand our corn oil yields. Increases
in regional corn basis and declining market prices for protein and corn oil resulted in overall margin compression, outweighing the economic
benefits of our plant improvements. As a consequence, we cold-idled our Magic Valley facility on December 31, 2024 to minimize financial
losses. We continue to provide terminal services at the plant and intend to resume operations at the facility when the economic environment
in the region sustainably improves. We believe that the cold-idling of our Magic Valley facility will have a positive impact on our overall
financial results in 2025 compared to 2024.
As market conditions change, we may increase,
decrease or idle production at one or more operating facilities or resume operations at any idled facility.
Marketing and Distribution Segment
We market and distribute all the alcohols and
essential ingredients we produce at our facilities. We also market and distribute alcohols produced by third parties.
We have extensive and long-standing customer relationships,
both domestic and international, for our specialty alcohols and essential ingredients. These customers include producers and distributors
of ingredients for cosmetics, sanitizers and related products, distilled spirits producers, food products manufacturers, producers of
personal health/consumer health and personal care hygiene products, and global trading firms.
Our renewable fuel customers are located throughout
the Western and Midwestern United States and consist of integrated oil companies and gasoline marketers who blend fuel-grade ethanol
into gasoline. Our customers depend on us to provide a reliable supply of fuel-grade ethanol and manage the logistics and timing of delivery.
Our customers collectively require fuel-grade ethanol volumes in excess of the supplies we produce at our facilities. We secure additional
fuel-grade ethanol supplies from third-party ethanol producers. We arrange for transportation, storage and delivery of fuel-grade ethanol
purchased by our customers through our agreements with third-party service providers in the Western United States as well as in the Midwest
from a variety of sources.
We market food-grade essential ingredients to
human and pet food markets, our feed products (such as distillers grains) primarily to export markets from our Pekin Campus, and other
feed products to dairies and feedlots, in many cases located near our production facilities. These customers use our feed products for
livestock as a substitute for corn and other sources of starch and protein. We sell our corn oil to poultry, renewable diesel and biodiesel
customers.
See “Note 4 – Segments” to our
Notes to Consolidated Financial Statements included elsewhere in this report for financial information about our business segments.
Company History
We are a Delaware corporation formed in 2005.
Our common stock trades on The Nasdaq Capital Market under the symbol “ALTO.” Our Internet website address is http://www.altoingredients.com.
Information contained on our website is not part of this Annual Report on Form 10-K. Our Annual Reports on Form 10-K, Quarterly Reports
on Form 10-Q, Current Reports on Form 8-K and any amendments to such reports filed with or furnished to the Securities and Exchange Commission
and other Securities and Exchange Commission filings are available free of charge through our website as soon as reasonably practicable
after the reports are electronically filed with, or furnished to, the Securities and Exchange Commission.
Business Strategy
The key elements of our business and growth strategy
include:
| ● | Focus
on our customer relationships. Our primary business focus is to expand the production
and sale of specialty alcohols and essential ingredients. Our business is now more service-oriented
and focused on specialty products that yield premium prices compared to commodity products
that yield predominantly passive, market-driven prices. We strive to make our business ever
more customer-centric to enable our premium services to support premium prices and new differentiated
and higher-margin products. |
| ● | Implement
carbon capture and storage at our Pekin Campus, lowering our carbon footprint. The Inflation
Reduction Act of 2022 raised the carbon capture tax credit to $85 per metric ton, reflecting
the section 45Q tax incentive benefits established under the Act. Section 45Z low carbon
fuel tax credits are also available under the Act. We produce over 600,000 metric tons of
CO2 per year at our Pekin Campus, which sits atop the Mount Simon formation, identified
as one of the best and largest carbon storage locations in the country. We are prioritizing
our carbon capture and storage, or CCS, project over other long-term capital projects. We
believe the financial benefits under the Inflation Reduction Act and the substantial additional
economic benefits of the environmental attributes associated with low carbon ethanol will
result in excellent returns on investment. In furtherance of this project, in November 2024,
we entered into a CO2 Transportation and Sequestration Agreement with Vault 44.01, or Vault,
to provide transportation, injection and sequestration into the Mount Simon sandstone formation
in Illinois of CO2 produced at our Pekin Campus. In December, Vault submitted the formal application to the EPA for
our CCS project to obtain the Class VI permit required to begin construction of the CCS pipeline and for long-term CO2 storage in deep
geological formations. |
| ● | Expand
product offerings. We are pursuing initiatives to broaden our product offerings to appeal
to a wider range of customers and uses in our key markets. For example, on January 1, 2025,
we acquired a liquid CO2 production facility located adjacent to our Oregon plant
and now offer liquid CO2 for sale. Our liquid CO2 facility and our
food-grade yeast plant are both FSSC 22000 certified, meeting the Global Food Safety Initiative
(GFSI) benchmarking requirements. In addition, we maintain ISO 9001, ICH Q7 and EXCiPACT
certifications for all United States Pharmacopia, or USP, grade alcohol products. These certifications
appeal to customers with stringent quality demands and enable us to offer alcohol certified
for use as an active pharmaceutical ingredient, or API, and as an excipient—an inactive
component of a drug or medication, such as solvents, carriers or tinctures—in the pharmaceutical
industry. All ingredients we produce for use in beverages, human and pet foods are third-party
certified for ISO 9001 and hazard analysis and critical control points (HACCP). In addition,
all of our animal feed production, including at our Oregon and Idaho facilities, has undergone
third-party Food Safety Modernization Act (FSMA) auditing. We are reviewing additional certifications
and product positioning within our key markets to expand the range of customers we serve
and the uses our products support. |
| ● | Implement
new equipment and technologies. We are evaluating and plan to implement new equipment
and technologies to increase our production yields, improve our operating efficiencies and
reliability, reduce our overall carbon footprint, diversify our products and revenues, and
increase our profitability as financial resources and market conditions Left these investments. |
| ● | Evaluate and pursue strategic opportunities. We are exploring opportunities to expand our business. For example, when the
opportunity arose, we moved quickly to acquire the liquid CO2 production facility adjacent to our Oregon plant and
establish an improved, long-term liquid CO2 sales agreement with a leading reseller of liquid CO2. We intend
to pursue these and other strategic opportunities as financial resources and business prospects make these opportunities desirable.
We are also exploring divestiture opportunities for certain properties in an ongoing effort to continue to optimize our asset
portfolio and as part of our ongoing efforts to maximize shareholder value. For example, we have engaged an investment banking firm
to explore the sale of our production facilities located in Oregon and Idaho. In addition, with the assistance of our financial and legal advisors, we are considering a broad range of other
options, including asset sales, a merger or other strategic transactions to better align our long-term value potential. |
Competitive Strengths
We believe that our competitive strengths include:
| ● | Strong
customer and supplier relationships. We have strong, extensive and long-standing close customer and supplier relationships, both
domestic and international, for our specialty alcohols, renewable fuels and essential ingredients. We have an excellent reputation for
developing specialty alcohols under stringent quality control standards. Our quality management systems are supported by ISO 9001, FSSC
22000, ICH Q7 and EXCiPACT certifications which are viewed by our customers as important attestations of our quality control. |
| ● | Diverse
product mix. We offer a wide range of specialty alcohols, essential ingredients and other
products to meet customer demand. We offer multiple alcohol quality grades ranging from industrial-grade
alcohol to the highest beverage grade low moisture 200 proof alcohol available. We also offer
a wide variety of essential ingredients and other products for food, feed and other markets. |
| ● | Barriers
to entry. Our production facilities use specialized equipment, technologies and processes
to achieve stringent quality controls, higher yields and efficient production of alcohols
and essential ingredients. Our specialized equipment, technologies and processes, together
with our quality management certifications, strict regulatory requirements, and close customer
and supplier relationships create significant barriers to entry to new market participants. |
| ● | Our
experienced management. Our senior management team has a proven track record with significant
operational and financial expertise and many years of experience in the alcohol production
industry. Our senior executives have successfully navigated a wide variety of business and
industry-specific challenges and deeply understand the business of successfully producing
and marketing specialty alcohols, renewable fuels and essential ingredients. |
| ● | The
strategic location of our Midwest production facilities. We operate three distinct but
integrated production facilities at our Pekin Campus in the Midwest. We are able to participate
from that location in the largest regional specialty alcohol market in the United States
as well as international markets. |
| ◾ | We believe that our
Midwest location enhances our overall hedging opportunities with a greater correlation to
the highly liquid physical and paper markets in Chicago. |
| ◾ | Our Midwest location
provides excellent logistical access via rail, truck and barge. In particular, barge access
via the Illinois River to the Mississippi River enables us to efficiently bring our products
to international markets. |
| ◾ | The relatively unique
wet milling process at one of our production facilities at our Pekin Campus allows us to
extract the highest use and value from each component of the corn kernel. As a result, the
wet milling process generates a higher level of cost recovery from corn than that produced
at a dry mill. |
| ◾ | Our Midwest location
allows us deep market insight and engagement in major specialty alcohol, fuel-grade ethanol,
pet food and feed markets, thereby improving pricing opportunities. |
| ◾ | Our Midwest location
sits atop the Mount Simon formation, identified as one of the best and largest carbon storage
locations in the country potentially allowing us to benefit from this close proximity to
store CO2. |
Overview of Our Key Markets and Market Opportunity
We produce specialty alcohols, renewable fuels
and essential ingredients, focusing on five key markets: Health, Home & Beauty; Food & Beverage; Industry &
Agriculture; Essential Ingredients; and Renewable Fuels.
Health, Home & Beauty
Our products for the health, home and beauty markets
include specialty alcohols used in mouthwash, cosmetics, pharmaceuticals, hand sanitizers, disinfectants and cleaners. We offer a variety
of specialty alcohols for the health, home and beauty markets, depending on usage and regulatory requirements, including API-grade or
USP-grade ethyl alcohols, and industrial-grade ethyl alcohol.
We have ISO 9001, FSSC 22000, ICH Q7 and EXCiPACT
certifications, all of which are viewed as important attestations of quality control standards. In particular, our ICH Q7 certification
qualifies our specialty alcohols for use as an API, and our EXCiPACT certification qualifies our specialty alcohols for use as an excipient
in the pharmaceutical industry. These certifications enable us to offer products to a wider group of customers and generally at more
profitable margins.
Food & Beverage
Our products for the food and beverage market
include specialty alcohols used in alcoholic beverages, flavor extracts and vinegar as well as corn germ used for corn oils and CO2
used for beverage carbonation and dry ice. We offer grain neutral spirits, or GNS, alcohol as our primary specialty alcohol for
beverage-grade products. In addition, we sell FCC 190 and USP 190 Ultra into vinegar markets. We also sell high-quality 192 proof and
low-moisture 200-proof GNS products to customers in the beverage, food, flavor and personal care industries.
We believe the key drivers in the food and beverage
market include consumer preferences for the social currency of brand authenticity and heritage; consumers seeking unique and personalized
experiences; improved consumer access to spirits products; the growth of craft distillers; and the ability to meet wide-ranging consumer
preferences through a broad diversity of spirits categories and cocktails.
Industry & Agriculture
Our products for the industry and agriculture
market include alcohols and other products for paint applications, vehicle fluids and fertilizers.
Essential Ingredients
Our essential ingredients include dried yeast,
corn protein meal, corn protein feed, and distillers grains and liquid feed used in commercial animal feed and pet foods. In addition,
we sell yeast for human consumption. We also produce and sell liquid CO2. The raw materials for our essential ingredients
are generated as co-products from our production of alcohols. These co-products are further manufactured, altered and refined into our
essential ingredients, including for special customer applications.
Many of our essential ingredients are used in
a variety of food products to affect their nutrition, including protein and fat content, as well as other product attributes such as
taste, texture, palatability and stability. Our high quality and high purity manufacturing enables our customers to use some of our essential
ingredients in human foods while others are used solely in pet foods and animal feed.
We expect the essential ingredients market to
grow significantly due to global demand for higher-grade protein feed, such as feed used in fisheries and other applications for plant-based
proteins.
Renewable Fuels
Our renewable fuels products include fuel-grade
ethanol primarily used as a transportation fuel additive and distillers corn oil used as a renewable diesel and biodiesel feedstock.
Our renewable fuels business is supported by our own production of fuel-grade ethanol as well as fuel-grade ethanol produced by third
parties.
Renewable fuels, primarily fuel-grade ethanol,
are used for a variety of purposes, including as octane enhancers for premium gasoline and to enable refiners to produce greater quantities
of lower octane blend stock; for fuel blending to extend fuel supplies and reduce reliance on crude oil and refined products; and to
comply with a variety of governmental programs, in particular, the national Renewable Fuel Standard, or RFS, enacted to promote alternatives
to fossil fuels. Under the RFS, the mandated use of all renewable fuels rose incrementally and peaked at 36.0 billion gallons in 2022,
of which production of 15.0 billion gallons was required from conventional, or corn-based, ethanol. The RFS allows the Environmental
Protection Agency, or EPA, to adjust the annual requirement based on certain facts and circumstances. The EPA set its annual requirement
for conventional ethanol to 15.0 billion gallons for 2025. See “—Governmental Regulation.”
According to the Renewable Fuels Association,
the domestic fuel-grade ethanol industry produced over 16.1 billion gallons of ethanol in 2024, up from 15.5 billion gallons of ethanol
in 2023. According to the United States Department of Energy, total annual gasoline consumption in the United States is approximately
137 billion gallons and total annual fuel-grade ethanol blended with gasoline represented approximately 10.4% of this amount in 2024.
We anticipate that continued limited opportunities for gasoline refinery expansions and the growing importance of reducing CO2
emissions using renewable fuels will generate additional growth in the demand for fuel-grade ethanol.
Overview of Alcohol Production Process
Alcohol production from starch- or sugar-based
feedstock is a highly efficient process. Modern alcohol production requires large amounts of corn, or other high-starch grains, and water
as well as chemicals, enzymes and yeast, in addition to natural gas and electricity.
Dry Milling Process
In the dry milling process, corn or other high-starch
grain is first ground into flour, then slurried with water to form a mash. Enzymes are added to the mash to convert the starch into dextrose,
a simple sugar. The mash is processed through a high temperature cooking procedure, which reduces bacteria levels prior to fermentation.
The mash is then cooled and transferred to fermenters, where yeast is added and the conversion of sugar to alcohol and CO2 begins.
After fermentation, the resulting “beer”
is transferred to distillation where the alcohol is separated from the residual “stillage.” The resulting alcohol is concentrated
to 190 proof using conventional distillation methods. It can then be dehydrated to approximately 200 proof, representing 100% alcohol
levels, in either a molecular sieve system or a grits system. For fuel-grade ethanol, the resulting anhydrous alcohol is then blended
with up to 2.5% denaturant, usually gasoline, and then shipped to renewable fuels markets. For specialty alcohols, the products can be
sold pure or as one of the Alcohol Tobacco Tax & Trade Bureau (TTB) approved specially denatured alcohol (SDA) formulations to meet
customer specifications.
The residual stillage is separated into a coarse
grain portion and a liquid portion through a screw press or centrifugation process. The soluble liquid portion is concentrated to about
40% dissolved solids by an evaporation process. This intermediate state is called condensed distillers solubles, or syrup. The coarse
grain and syrup portions are then mixed to produce wet distillers grains with solubles, or WDGS, or can be mixed and dried to produce
dried distillers grains with solubles, or DDGS. Both WDGS and DDGS are high-protein animal feed products.
Wet Milling Process
In the wet milling process, corn or other high-starch
grain is first soaked or “steeped” in sulfurous acid for approximately 24 hours to soften the whole corn kernel prior to
milling. After steeping, the grain is coarse milled to gently open the kernels to separate the corn germ and from which corn oil is further
extracted in a separate process. The remaining fiber, protein and starch components are further separated and sold.
The stillage from the fermentation process is
concentrated in an evaporator and is co-dried with the fiber component and sold as corn protein feed. The protein component is
separated from the starch, filtered and dried to produce corn protein meal, a product with greater than 60% protein content. The
starch component is processed into alcohol through fermentation. The fermentation process for alcohol at this stage is similar to
the dry milling process. In addition, we separate and dry yeast to produce distillers yeast.
Overview of Distillers Grains Market
Distillers grains are produced as a co-product
of alcohol production and are valuable components of feed rations primarily to dairies and beef cattle markets, both nationally and internationally.
Our plants produce both WDGS and DDGS. WDGS is sold to customers proximate to the plants and DDGS is delivered by truck, rail and barge
to customers in domestic and international markets. Producing WDGS uses up to one-third less process energy, thus reducing production
costs and lowering the carbon footprint of our Western production facilities.
Historically, the market price for distillers
grains has generally tracked the price of corn. We believe that the market price of WDGS and DDGS is determined by a number of factors,
including the market prices of corn, soybean meal and other competitive ingredients, the performance or value of WDGS and DDGS in a particular
feed formulation and general market forces of supply and demand, including export markets for these essential ingredients. The market
price of distillers grains is also often influenced by nutritional models that calculate the feed value of distillers grains by nutritional
content, as well as reliability of consistent supply.
Customers
Our Kinergy Marketing LLC, or Kinergy, subsidiary
sells all of our produced alcohols and also markets fuel-grade ethanol produced by third parties. Our Alto Nutrients, LLC subsidiary
sells all of the essential ingredients we produce. Our Alto Carbonic, LLC subsidiary sells all of the liquid CO2 we produce
and our Eagle Alcohol business sells our alcohols and third-party alcohols in break bulk quantities to customers in the beverage, food,
industrial and related-process industries.
We have extensive and long-standing customer relationships,
both domestic and international, for our specialty alcohols and essential ingredients, including yeast for pet food and human foods.
These customers include producers and distributors of ingredients for cosmetics, sanitizers and related products, distilled spirits producers,
food products manufacturers, producers of personal health/consumer health and personal care hygiene products, and global trading firms.
Our renewable fuel customers are located throughout
the Western and Midwestern United States and consist of integrated oil companies and gasoline marketers who blend fuel-grade ethanol
into gasoline. Our customers depend on us to provide a reliable supply of fuel-grade ethanol and manage the logistics and timing of delivery.
We secure additional fuel-grade ethanol supplies from third-party fuel-grade ethanol plants.
We market our essential ingredient feed products
to dairies and feedlots, in many cases located near our production facilities. These customers use our feed products for livestock as
a substitute for corn and other sources of starch and protein. We sell our corn oil to poultry, renewable diesel and biodiesel customers.
Our Pekin Campus production segment generated
$416 million, $502 million and $521 million in net sales for the years ended December 31, 2024, 2023 and 2022, respectively, from the
sale of alcohols. Our Pekin Campus production segment generated $169 million, $218 million and $226 million in net sales for the years
ended December 31, 2024, 2023 and 2022, respectively, from the sale of essential ingredients.
During 2024, 2023 and 2022, our Pekin Campus production
segment sold an aggregate of approximately 214 million, 209 million and 205 million gallons of alcohols and 906,300, 878,400, and 850,300
tons of essential ingredients, respectively, on a dry matter basis.
Our Western production segment generated $115
million, $167 million and $254 million in net sales for the years ended December 31, 2024, 2023 and 2022, respectively, from the sale
of alcohols. Our Western production segment generated $37 million, $57 million and $90 million in net sales for the years ended December
31, 2024, 2023 and 2022, respectively, from the sale of essential ingredients.
During 2024, 2023 and 2022, our Western production
segment sold an aggregate of approximately 61 million, 67 million and 92 million gallons of alcohols and 514,600, 642,300 and 787,100
tons of essential ingredients, respectively, on a dry matter basis.
Our marketing and distribution segment generated
$217 million, $263 million and $229 million in net sales for the years ended December 31, 2024, 2023 and 2022, respectively, from the
sale of our own alcohols and third-party produced alcohols.
Our Corporate and other segment, which includes
Eagle Alcohol’s business, generated $11 million, $16 million and $16 million in net sales for the years ended December 31, 2024,
2023 and 2022, respectively, and sold 3.6 million, 4.0 million and 4.0 million gallons of alcohols, respectively, for those years.
During 2024, 2023 and 2022, we produced or purchased
from third parties and resold an aggregate of 386 million, 383 million and 419 million gallons of alcohols to approximately 85, 88 and
114 customers, respectively. For 2024, 2023 and 2022, sales to our two largest customers, Chevron Products USA and Shell Trading (US)
Company represented an aggregate of approximately 18%, 16% and 20% of our net sales, respectively. For 2024, 2023 and 2022, sales to
each of our other customers represented less than 10% of our net sales.
Suppliers
Pekin Campus and Western Production Segments
Our production operations depend upon various
raw materials suppliers, including suppliers of corn, natural gas, electricity and water. The cost of corn, including delivery costs,
is the most important variable cost associated with our alcohol production. We source corn for our plants using standard contracts, including
spot purchase, forward purchase and basis contracts. When resources are available, we seek to limit the exposure of our production operations
to raw material price fluctuations by purchasing forward a portion of our corn requirements on a fixed price basis and by purchasing
corn and other raw materials futures contracts and options.
During 2024, 2023 and 2022, purchases of corn
from our three largest suppliers represented an aggregate of approximately 29%, 26% and 38% of our total corn purchases, respectively,
for those periods. Purchases from each of our other corn suppliers represented less than 10% of total corn purchases in each of 2024,
2023 and 2022.
Marketing and Distribution Segment
Our marketing and distribution operations include
alcohols and essential ingredients we produce but also depend upon various third-party producers of fuel-grade ethanol. In addition,
we provide transportation, storage and delivery services through third-party service providers with whom we have contracted to receive
fuel-grade ethanol at agreed upon locations from our third-party suppliers and to store and/or deliver the ethanol to agreed-upon locations
on behalf of our customers. These contracts generally run from year-to-year, subject to termination by either party upon advance written
notice before the end of the then-current annual term.
During 2024, 2023 and 2022, we purchased and resold
from third parties an aggregate of approximately 108 million, 103 million and 118 million gallons, respectively, of fuel-grade ethanol.
During 2024, 2023 and 2022, purchases of fuel-grade
ethanol from our four largest third-party suppliers represented 79%, 86% and 69%, respectively, of our total third-party ethanol purchases
for each of those periods. Purchases from each of our other third-party ethanol suppliers represented less than 10% of total third-party
ethanol purchases in each of 2024, 2023 and 2022.
Production Facilities
We operate five alcohol production facilities.
Three of our production facilities are located in Illinois, one is located in Oregon and another is located in Idaho. We have an annual
alcohol production capacity of up to 350 million gallons, including both fuel-grade ethanol and specialty alcohols ranging from industrial-,
pharmaceutical-, and high-quality food- and beverage-grade alcohols. Of this amount, we are able to produce up to 110 million gallons
annually of specialty alcohols, depending on our product mix among high-quality beverage-grade alcohol and other quality specification
alcohols. We also own and operate a liquid CO2 production facility adjacent to our plant in Oregon for the offtake of CO2
gas from the plant for conversion to liquid CO2 and subsequent sale.
The tables below provide an overview of our five
alcohol production facilities and our liquid CO2 production facility. As market conditions change, we may increase, decrease
or idle production at one or more operating facilities or resume operations at any idled facility.
Pekin Campus Production Facilities
| | |
Pekin
Wet Facility | |
Pekin
Dry Facility | |
Pekin
ICP Facility |
| Location | |
Pekin, IL | |
Pekin, IL | |
Pekin, IL |
| Current operating status | |
Operating | |
Operating | |
Operating |
| Approximate maximum annual alcohol production capacity (in millions of gallons) | |
100 | |
60 | |
90 |
| Approximate maximum annual specialty alcohol production capacity (in millions of gallons) | |
74 | |
— | |
66 |
| Production milling process | |
Wet | |
Dry | |
Dry |
| Primary energy source | |
Natural Gas | |
Natural Gas | |
Natural Gas |
Western Production Facilities
| | |
Magic Valley
Facility | |
Columbia
Facility | |
Liquid CO2
Facility |
| Location | |
Burley, ID | |
Boardman, OR | |
Boardman, OR |
| Current operating status | |
Cold-Idled | |
Operating | |
Operating |
| Approximate maximum annual fuel-grade ethanol production capacity (in millions of gallons) | |
60 | |
40 | |
- |
| Approximate maximum annual liquid CO2 capacity (in thousands of tons) | |
- | |
- | |
70 |
| Production milling process | |
Dry | |
Dry | |
N/A |
| Primary energy source | |
Natural Gas | |
Natural Gas | |
Electricity |
Commodity Risk Management
We employ various risk mitigation techniques.
For example, we may seek to mitigate our exposure to commodity price fluctuations by purchasing forward a portion of our corn and natural
gas requirements through fixed-price or variable-price contracts with our suppliers, as well as entering derivative contracts for fuel-grade
ethanol, corn and natural gas. To mitigate fuel-grade ethanol inventory price risks, we may sell a portion of our production forward
under fixed- or index-price contracts, or both. We may hedge a portion of the price risks by entering exchange-traded futures contracts
and options. Properly executing these risk mitigation strategies can reduce the volatility of our gross profit margins.
Specialty alcohols have relatively low price volatility
and are usually priced at significant premiums to fuel-grade ethanol. The market price of fuel-grade ethanol is volatile, however, and
subject to large fluctuations. Given the nature of our business, we cannot effectively hedge against extreme volatility or certain market
conditions. For example, fuel-grade ethanol prices, as reported by the Chicago Mercantile Exchange, or CME, ranged from $1.38 to $2.12
per gallon during 2024, from $1.58 to $2.67 per gallon during 2023 and from $2.00 to $2.88 per gallon during 2022; and corn prices, as
reported by the CME, ranged from $3.62 to $4.71 per bushel during 2024, from $4.50 to $6.85 per bushel during 2023 and from $5.64 to
$8.18 per bushel during 2022.
Climate-Related and Other Risks
Short- to medium-term climate-related and other
risks include high sensitivity to certain commodity prices such as corn and natural gas; regulatory changes and political volatility,
both domestic and international; ethanol supply and demand imbalances; logistics and storage constraints from river access during inclement
or volatile weather conditions; lack of automation of process optimization; high repair, maintenance and production costs resulting from
older facilities; poor cooling capacity of our older facilities as water temperatures increase; and international market competition.
Long-term climate-related risks include water
resource limitations; lower or volatile grain availability in local markets; market transition away from combustion fuels that include
renewables; and the energy cost impact of technology such as wet milling and multiple distillation processes for high-quality alcohol.
We also may be impacted by costs and regulatory burdens associated with carbon emissions from our production and distribution as well
as truck transport and packaging associated with Eagle Alcohol’s use of drums and totes. See “Risk Factors.”
Marketing Arrangements
We market all the alcohols and essential ingredients
produced at our facilities. We also market and distribute alcohols produced by third parties.
Competition
We are a leading producer of specialty alcohols
in the United States.
Other significant producers of specialty
alcohols in the United States are Archer-Daniels-Midland Company, Grain Processing Corporation, BioUrja Renewables, LLC, CIE and
Greenfield Global Inc., which collectively make up a significant majority of the total installed specialty alcohol production
capacity in the United States along with many smaller producers.
The largest producers of fuel-grade ethanol in
the United States are POET, LLC, Valero Renewable Fuels Company, LLC, Archer-Daniels-Midland Company and Green Plains Inc., collectively
with approximately 39% of the total installed fuel-grade ethanol production capacity in the United States. In addition, there are many
mid-sized fuel-grade ethanol producers with several plants under ownership, smaller producers each with one or two plants, and several
fuel-grade ethanol marketers that create significant competition. Overall, we believe there are over 200 fuel-grade ethanol production
facilities in the United States with a total installed production capacity of approximately 18 billion gallons and many brokers and marketers
with whom we compete for sales of fuel-grade ethanol and its co-products.
Our fuel-grade ethanol also competes on a global
market against production from other countries, such as Brazil, which may have lower production costs than United States producers. Lower
feedstock input costs such as sugarcane used in Brazil as compared to corn used in the Unites States may give foreign producers a competitive
advantage. In addition, fuel-grade ethanol from sugarcane feedstock qualifies as an advanced biofuel, unlike corn ethanol, allowing certain
producers to economically satisfy an advanced biofuel standard. Moreover, new products and production technologies are under continuous
development, many of which, if adopted by competitors, could harm our ability to compete.
We believe that our competitive strengths include
our customer and supplier relationships, our diverse product mix, the barriers to entry to our most profitable lines of business—including
our certifications at our production facilities—our experienced management, and the strategic location
of our Midwest production facilities. See “—Competitive Strengths.”
Governmental Regulation
Our business is subject to a wide range of federal,
state and local laws and regulations directed at protecting public health and the environment, including those promulgated by the Occupational
Safety and Health Administration, or OSHA, the U.S. Food and Drug Administration, or FDA, the EPA, and numerous state, local and international
authorities. These laws, their underlying regulatory requirements and their potential enforcement, some of which are described below,
impact, or may impact, nearly every aspect of our operations, including our alcohol production (including distillation), our liquid CO2
production, our essential ingredient production, our storage facilities, and our water usage, wastewater discharge, disposal of
hazardous wastes and emissions, and other matters pertaining to our existing and proposed business by imposing:
| ● | restrictions
on our existing and proposed operations and/or the need to install enhanced or additional
controls; |
| ● | special
requirements applicable to food and drug additives; |
| ● | the
need to obtain and comply with permits and authorizations; |
| ● | liability
for exceeding applicable permit limits or legal requirements, in some cases for the remediation
of contaminated soil and groundwater at our production facilities, contiguous and adjacent
properties and other properties owned and/or operated by third parties; and |
| ● | other
specifications for the specialty alcohols and essential ingredients we produce, market and
sell. |
In addition, some governmental regulations are
helpful to our production and marketing business. The fuel-grade ethanol industry in particular is supported by federal and state mandates
and environmental regulations that favor the use of fuel-grade ethanol in motor fuel blends in North America. Some of the governmental
regulations applicable to our production and marketing business are briefly described below.
Food and Drug Regulation
Our products for the Health, Home & Beauty,
Food & Beverage and Essential Ingredients markets are subject to regulation by the FDA as well as similar state agencies.
Under the Federal Food, Drug, and Cosmetic Act, or FDCA, the FDA regulates the processing, formulation, safety, manufacture, packaging,
labeling and distribution of food ingredients, vitamins, cosmetics and pharmaceuticals for active and inactive ingredients. In 2022,
The Modernization of Cosmetics Regulation Act (MoCRA) was added to the FDCA. This was a significant expansion to the FDCA, and established
requirements for cosmetic product facility registration and product listing, widening regulatory oversight of many more of our customers’
products. Many of the FDA’s and FDCA’s rules and regulations apply directly to us as well as indirectly through their application
in our customers’ products. For proper marketing and sale in the United States, an applicable product must be generally recognized
as safe, approved and not adulterated or misbranded under the FDCA and relevant regulations issued under the FDCA. The FDA has broad
authority to enforce the provisions of the FDCA. Failure to comply with the laws and regulations of the FDA or similar state agencies
could prevent us from selling certain of our products or subject us to liability.
Renewable Fuels Energy Legislation
Under the RFS, the mandated use of all renewable
fuels, including fuel-grade ethanol, rose incrementally and peaked at 36.0 billion gallons in 2022, of which 15.0 billion gallons are
required from conventional, or corn-based, ethanol for 2025. Under the provisions of the Energy Independence and Security Act of 2007,
the EPA has the authority to waive the mandated RFS requirements in whole or in part. To grant a waiver, the EPA administrator must determine,
in consultation with the Secretaries of Agriculture and Energy, that there is inadequate domestic renewable fuel supply or implementation
of the requirement would severely harm the economy or environment of a state, region or the United States as a whole.
Various bills in Congress introduced from time
to time are also directed at altering existing renewable fuels energy legislation, but none have passed in recent years. Some legislative
bills are directed at halting or reversing expansion of, or even eliminating, the renewable fuel program, while other bills are directed
at bolstering the program or enacting further mandates or grants that would support the renewable fuels industry.
The EPA has allowed fuel and fuel-additive manufacturers
to introduce into commercial gasoline up to 15% fuel-grade ethanol by volume, or E15, for vehicles from model year 2001 and after. According
to the Renewable Fuels Association, E15 is explicitly approved by the manufacturer for use in approximately 95% of model year 2024 and
newer cars and light trucks based on its annual review of vehicle owner’s manuals and warranty statements. Commercial sales of
E15 have begun in a majority of states. E15 has historically been prohibited in most states during the summer driving season due to concerns
over evaporative emissions and to meet federal clean air standards. For the 2024, 2023 and 2022 summer driving seasons, the EPA issued
emergency fuel waivers to allow the sale of E15 to help alleviate high gasoline prices. E15 may, however, be sold year-round in states
that have a reformulated gasoline program. In addition, the EPA proposed in late 2023 that E15 be permitted for sale year-round in various
Midwestern states effective in April 2024. The U.S. Office of Management and Budget approved the proposal in February 2024 but deferred
the effective date to April 2025.
Various states including California, Oregon and
Washington, and other regions such as the Canadian province of British Columbia, have implemented low carbon fuel standards focused on
reducing the carbon intensity of transportation fuels. Other states, including New York, Vermont, Massachusetts, Michigan, Illinois,
Colorado and New Mexico, currently have proposed legislation or policies that would establish a low carbon fuel standard program. Blending
fuel-grade ethanol into gasoline is one of the primary means of attaining these goals.
Additional Environmental Regulations
In addition to the governmental regulations applicable
to the alcohol production and marketing industry described above, our business is subject to additional federal, state and local environmental
regulations, including regulations established by the EPA and state regulatory agencies related to water quality and air pollution control.
We cannot predict the manner by which, or extent to which, these regulations will harm or help our business or the alcohol production
and marketing industry in general.
Human Capital Resources
As of March 12, 2025, we had approximately 393
full-time employees. Our human capital resources objectives include attracting and retaining well-qualified and highly skilled and motivated
employees and executives. As of that same date, approximately 51% of our employees were represented by a labor union and covered by a
collective bargaining agreement. We have never had a work stoppage or strike and we consider our relations with our employees to be good.
Our compensation program is designed to attract,
retain and motivate our personnel. We use a mix of competitive salaries and other benefits to attract and retain employees and executives.
Some of these benefits include matching 401K contributions of up to 6% of salary, health and wellness programs and a paid service day
for employees to give back to their communities. At the direction and with the involvement of our Sustainability and Governance board
committees, we have established a Sustainability working committee that draws from our many administrative and operational departments
to review key policies and procedures, conduct employee engagement surveys, champion volunteering and charitable drives, develop and
implement formalized recruiting and training efforts to prioritize collecting data and improving on key metrics from industry frameworks
such as the Global Reporting Initiative (GRI) and Sustainability Accounting Standards Board (SASB) standards which are maintained by
the International Sustainability Standards Board of the IFRS Foundation.
Item 1A. Risk Factors.
Before deciding to purchase, hold or sell
our common stock, you should carefully consider the risks described below in addition to the other information contained in this Report
and in our other filings with the Securities and Exchange Commission, including subsequent reports on Forms 10-Q and 8-K. The risks and
uncertainties described below are not the only ones we face. Additional risks and uncertainties not presently known to us or that we
currently deem immaterial may also affect our business. If any of these known or unknown risks or uncertainties actually occurs with
material adverse effects on Alto Ingredients, our business, financial condition, results of operations and/or liquidity could be seriously
harmed. In that event, the market price for our common stock will likely decline, and you may lose all or part of your investment.
Risks Related to our Business
Our results of operations and our ability to operate
at a profit are largely dependent on our ability to manage the costs of corn, natural gas and other production inputs, with the prices
of our alcohols and essential ingredients, all of which are subject to volatility and uncertainty.
Our results of operations are highly impacted
by commodity prices, including the cost of corn, natural gas and other production inputs that we must purchase, and the prices of alcohols
and essential ingredients that we sell. Prices and supplies are subject to and determined by numerous market and other forces over which
we have no control, such as inclement or favorable weather, domestic and global demand, supply excesses or shortages, export conditions,
inflationary conditions, global geopolitical tensions and various governmental policies in the United States and throughout the world.
Price volatility of corn, natural gas and other
production inputs, and alcohols and essential ingredients, may cause our results of operations to fluctuate significantly. We may fail
to generate expected levels of net sales and profits even under fixed-price and other contracts for the sale of specialty alcohols used
in consumer products. Our customers may not pay us timely or at all, even under longer-term, fixed-price contracts for our specialty
alcohols, and may seek to renegotiate prices under those contracts during periods of falling prices or high price volatility.
Historically, the spread between corn and
fuel-grade ethanol prices has fluctuated significantly. Fluctuations are likely to continue to occur. A sustained negative or narrow
spread, whether as a result of sustained high or increased corn prices or sustained low or decreased alcohol or essential ingredient
prices, would adversely affect our results of operations and financial condition. Revenues from sales of alcohols, particularly
fuel-grade ethanol, and essential ingredients have in the past and could in the future decline below the marginal cost of
production, which have in the past and may again in the future force us to suspend production, particularly fuel-grade ethanol
production, at some or all of our facilities. For example, we hot-idled our Magic Valley facility in early 2023 due to unfavorable
market conditions and again hot-idled our Magic Valley facility in early 2024 in part due to unfavorable market conditions and to
expedite the installation of additional equipment needed to achieve the intended production rate, quality and consistency from the
corn oil and high protein system at the facility. We restarted the Magic Valley facility in July 2024, but due to challenging market
economics, we cold-idled the plant at the end of 2024.
In addition, some of our fuel-grade ethanol marketing
and distribution activities will likely be unprofitable in a market of generally declining prices due to the nature of our business.
For example, to satisfy customer demand, we maintain certain quantities of fuel-grade ethanol inventory for subsequent resale. Moreover,
we procure much of our fuel-grade ethanol inventory outside of contracted third-party marketing and distribution arrangements and therefore
must buy fuel-grade ethanol at a price established at the time of purchase and sell fuel-grade ethanol at an index price established
later at the time of sale that is generally reflective of movements in the market price of fuel-grade ethanol. As a result, our margins
for fuel-grade ethanol sold in these transactions generally decline and may turn negative as the market price of fuel-grade ethanol declines.
We can provide no assurances that corn, natural
gas or other production inputs can be purchased at or near current or any specific prices, or that our alcohols or essential ingredients
will sell at or near current or any particular prices. Consequently, our results of operations and financial condition may be adversely
affected by increases in the prices of corn, natural gas and other production inputs or decreases in the prices of our alcohols and essential
ingredients.
The prices of our products are volatile and subject
to large fluctuations, which may cause our results of operations to fluctuate significantly.
The prices of our products are volatile and subject
to large fluctuations. For example, the market price of fuel-grade ethanol is dependent upon many factors, including the supply of ethanol
and the price of gasoline, which is in turn dependent upon the price of petroleum which itself is highly volatile, difficult to forecast
and influenced by a wide variety of global economic and geopolitical conditions, including decisions concerning petroleum output by the
Organization of Petroleum Exporting Countries (OPEC) and their allies, an intergovernmental organization that seeks to manage the price
and supply of oil on the global energy market. Other important factors that impact the price of petroleum include war and threats of
war, attacks on or threats to shipping vessels as has recently occurred in the Red Sea, the consequent rerouting of supply lines to less
direct or more expensive paths, and other supply chain disruptions.
Our fuel-grade ethanol sales are tied to prevailing
spot market prices rather than long-term, fixed-price contracts. Fuel-grade ethanol prices, as reported by the Chicago Mercantile Exchange,
ranged from $1.38 to $2.12 per gallon in 2024, from $1.58 to $2.67 per gallon in 2023 and from $2.00 to $2.88 per gallon in 2022. In
addition, even under longer-term, fixed-price contracts for our specialty alcohols, our customers may seek to renegotiate prices under
those contracts during periods of falling prices or high price volatility. Fluctuations in the prices of our products may cause our results
of operations to fluctuate significantly.
We may engage in hedging transactions and other risk
mitigation strategies that could harm our results of operations and financial condition.
To partially offset the effects of production
input and product price volatility, in particular, corn and natural gas costs and fuel-grade ethanol prices, we may enter into contracts
to purchase a portion of our corn or natural gas requirements on a forward basis or fix the sale price of portions of our alcohol production.
In addition, we may engage in other hedging transactions involving exchange-traded futures contracts for corn, natural gas and unleaded
gasoline from time to time. The financial statement impact of these activities is dependent upon, among other things, the prices involved
and our ability to sell sufficient products to use all of the corn and natural gas for which forward commitments have been made. We have
recognized losses in the past, and may suffer losses in the future, from our hedging arrangements. For example, for the year ended December
31, 2023, we recognized net losses of $8.0 million related to the change in the fair values of hedging contracts.
Hedging arrangements also expose us to the risk
of financial loss in situations where our counterparty to the hedging contract defaults on its contract or, in the case of exchange-traded
contracts, where there is a change in the expected differential between the underlying price in the hedging agreement and the actual
prices paid or received by us. In addition, our open contract positions may require cash deposits to cover margin calls, negatively impacting
our liquidity. As a result, our hedging activities and fluctuations in the price of corn, natural gas, fuel-grade ethanol and unleaded
gasoline may adversely affect our results of operations, financial condition and liquidity.
Disruptions in our production or distribution, including
from climate change and other weather effects, may adversely affect our business, results of operations and financial condition.
Our business depends on the continuing availability
of rail, road, port, storage and distribution infrastructure. In particular, due to limited storage capacity at some of our production
facilities and other considerations related to production efficiencies, certain facilities depend on timely delivery of corn. Alcohol
production also requires a significant and uninterrupted supply of other raw materials and energy, primarily water, electricity and natural
gas. Local water, electricity and gas utilities may fail to reliably supply the water, electricity and natural gas that our production
facilities need or may fail to supply those resources on acceptable terms. In the past, poor weather has caused disruptions in rail transportation,
which slowed the delivery of fuel-grade ethanol and/or corn by rail to and from our facilities.
For example, in the first quarter of 2024, extreme
cold weather conditions in January at our Pekin Campus restricted barge deliveries and increased standby fees. To manage inventory levels,
we transported more product by rail, a higher cost mode of transportation. Cold weather conditions also required us to shift to lower
margin feed products and reduced our production rates across our Pekin Campus, hindering our ability to produce specialty alcohol at
full capacity. In the third quarter of 2023 we experienced unusually high unscheduled production downtime for repairs and maintenance
which reduced sales volumes and profits. In 2022, a lightning strike at the utility servicing our Pekin Campus disrupted our operations,
cutting power to our facilities and materially affecting our production, resulting in unexpected repair and maintenance costs, lost production
and degradation in the quality of work-in-progress inventories.
Disruptions in production or distribution, whether
caused by labor difficulties, unscheduled downtimes and other operational hazards inherent in the alcohol production industry, including
equipment failures, fires, explosions, abnormal pressures, blowouts, pipeline ruptures, transportation accidents, climate change and
natural disasters such as earthquakes, floods and storms, or other weather effects, or human error or malfeasance or other reasons, could
prevent timely deliveries of corn or other raw materials and energy, and could delay transport of our products to market, and may require
us to halt production at one or more production facilities, any of which could have a material adverse effect on our business, results
of operations and financial condition.
Some of these operational hazards may also cause
personal injury or loss of life, severe damage to or destruction of property and equipment or environmental damage, and may result in
suspension of operations and the imposition of civil or criminal penalties. Our insurance may not fully cover the potential hazards described
above or we may be unable to renew our insurance on commercially reasonable terms or at all.
Increased alcohol or essential ingredient production
or higher inventory levels may cause a decline in prices for those products, and may have other negative effects, materially and adversely
impacting our results of operations, cash flows and financial condition.
The prices of our alcohols and essential ingredients
are highly impacted by competing third-party supplies of those products. In addition, if fuel-grade ethanol production margins improve,
we anticipate that owners of production facilities operating at below capacity, or owners of idled production facilities, will increase
production levels, thereby resulting in more abundant fuel-grade ethanol supplies and inventories. Increases in the supply of alcohols
and essential ingredients may not be commensurate with increases in demand for alcohols and essential ingredients, thus leading to lower
prices. Any of these outcomes could have a material adverse effect on our results of operations, cash flows and financial condition.
We may suffer impairments in the value of our long-lived
assets which may materially and adversely affect our results of operations.
We evaluate our long-lived assets annually for
impairment or when circumstances indicate that the full carrying value of an asset may be unrecoverable. These evaluations rely on financial
and other assumptions concerning the assets, any of which may not materialize in the future. For example, we recognized asset impairments
of $24.8 million and $6.5 million for the years ended December 31, 2024 and 2023, respectively. We may recognize additional impairments
of the values of our long-lived assets in the future based on then-prevailing financial and other circumstances. Impairments of our long-lived
assets may materially and adversely affect our results of operations.
Our alcohol production relies on traditional corn-based
feedstock and process technologies. New technologies could make corn-based alcohol production and traditional process technologies less
competitive or even obsolete, materially and adversely harming our business.
We produce our alcohols from corn. Moreover, our
plants are constructed and operate primarily as corn-based alcohol production facilities. Competitors and other third parties have undertaken
research to develop competing products to corn-based alcohols, and ethanol in particular, as well as new process technologies. These
research efforts seek alternatives to corn-based ethanol and traditional process technologies aimed at improving real or perceived problems
with the fuel, such as the carbon and energy intensity of its production, its lower energy content compared to gasoline and its hydrophobic
nature resulting in water separation in transit or at other times. Competitors and other third parties may develop new alcohols and processes
that improve on any of these or other real or perceived problems with corn-based alcohols, including ethanol. If viable competing products
or new process technologies are developed and attract widespread or even modest adoption, we may be forced to modify our production facilities,
including our process technologies, if possible, to transition in full or in part to these other products or process technologies to
remain competitive. Modifying our production facilities may require expertise that our personnel may not possess and would likely require
significant capital expenditures the funding for which we may not have. An inability to remain competitive due to the introduction and
adoption of competing products or new process technologies, or significant costs associated with the adoption of new products and process
technologies, would materially and adversely affect our business, financial condition and results of operations.
Inflation and sustained higher prices may adversely
impact our results of operations and financial condition.
We have experienced adverse inflationary impacts
on key production inputs, wages and other costs of labor, equipment, services, and other business expenses. In addition, we have experienced
adverse inflationary impacts on our budgets and expenses for many of our in-process and planned capital projects. Inflation and its negative
impacts could escalate in future periods. Even if inflation stabilizes or abates, the prices of key production inputs, wages and other
costs of labor, equipment, services, and other business expenses, and for our capital projects, will likely remain at elevated levels.
We may not be able to include these additional costs in the prices of the products we sell. As a result, inflation and sustained higher
prices may have a material adverse effect on our results of operations and financial condition.
Climate change, and governmental regulations aimed
at addressing climate-related issues, may affect conditions to which our business is highly sensitive, many of which could materially
and adversely harm our business, results of operations and financial condition.
Our business is highly sensitive to commodity
prices, in particular, the prices of corn and natural gas. Inclement weather from climate change, including extreme temperatures or drought,
may adversely affect growing conditions, which may reduce available corn supplies, our primary production input, and other grain substitutes,
driving up prices and thereby increasing our production input costs. In addition, governmental regulators may disfavor carbon-based energy
sources, such as natural gas, leading to regulations that disincentivize their use or otherwise make their production more difficult
and costly, driving up their prices. Higher natural gas prices would likewise increase our production input costs.
Other factors that may result from climate change,
or that may result from governmental regulations aimed at addressing climate-related issues, may also adversely affect our business,
including the following:
| ● | water
is one of our key production inputs; water resource limitations may result from drought and
other inclement weather; water resource limitations may also result from rationing and other
governmental regulations limiting water use; |
| ● | higher
water temperatures due to increased global or regional temperatures may negatively affect
production efficiencies due to water temperature production requirements given the limited
cooling capacities of our older facilities; |
| ● | flooding
and other inclement weather may negatively affect our river access, other transportation
logistics and costs, and storage requirements; |
| ● | an
overall increase in energy costs will negatively impact our production costs generally and
may critically impact certain high energy-intensive production technologies, such as our
wet milling and multiple distillation processes for the highest quality specialty alcohols; |
| ● | regulatory
and market transition away from combustion fuels and fuel-grade ethanol blending may threaten
the viability of our renewable fuels business; and |
| ● | costs
and regulatory burdens associated with governmental regulations that limit or tax greenhouse
gas emissions, such as CO2, from alcohol production and distribution, or from
truck transport and packaging associated with Eagle Alcohol’s business and use of drums
and totes, will negatively impact us. |
New legislation in the United States to address
climate change issues, especially at the state and local levels, may be passed and implemented, materially and adversely impacting our
business.
Any of these factors could materially and adversely
harm our business, results of operations and financial condition.
Risks Related to our Finances
We have incurred significant losses and negative
operating cash flow in the past and we may incur losses and negative operating cash flow in the future, which may hamper our operations
and impede us from expanding our business.
We have incurred significant losses and negative
operating cash flow in the past. For example, for the years ended December 31, 2024, 2023 and 2022, we incurred consolidated net losses
of approximately $59.0 million, $28.0 million and $41.6 million, respectively. For the year ended December 31, 2024, we incurred negative
operating cash flow of $3.5 million. We may incur losses and negative operating cash flow in the future. We expect to rely on cash on
hand, cash, if any, generated from our operations, borrowing availability under our lines of credit and proceeds from our future financing
activities, if any, to fund all of the cash requirements of our business. Additional losses and negative operating cash flow may hamper
our operations and impede us from expanding our business.
We are engaged in multiple capital improvement projects.
These projects, and their financing, costs, timing and effects, are based on our plans, expectations and various assumptions that may
not eventuate. We may therefore be unable to timely achieve, or achieve at all, the results we expect, including as to projected additional
EBITDA and Adjusted EBITDA.
We are engaged in multiple capital improvement
projects to diversify and enhance our revenue streams and to expand margins and profitability by reducing costs. These projects have
different timelines, returns on investment and risk profiles. In addition, we must raise significant additional capital to complete some
of our projects, including our CCS project. Our expected financial and other results from these projects are based on assumptions around
many factors, including their costs, timing, operation and market prices prevailing at project completion and thereafter, as well as
tax and other favorable environmental attributes associated with low carbon alcohol that may accrue to our benefit. For example, our
assumptions around the anticipated results of our CCS project rely heavily on the tax benefits that may accrue to us under the Inflation
Reduction Act of 2022 as well as other favorable environmental attributes associated with carbon capture and storage and low carbon alcohol
production. These tax and other benefits may change, including as a result of new or repealed laws, new administrations and the implementation
or interpretation of existing laws, or the exhaustion of funds or benefits available under a particular program. For example, in January
2025, the new administration suspended all Inflation Reduction Act spending for 90 days. In addition, certain provisions of the Inflation
Reduction Act lack proposed or final regulations and guidance. Regulators could issue new regulations or guidance that significantly
narrows the application of clean energy tax incentives, and could even defer or withdraw regulations, which could materially and adversely
affect the economic outcome of our CCS project. We can provide no assurances that any particular benefit will be available to us upon
completion of our CCS project, or thereafter, or any other capital improvement project.
Capital improvement projects require significant
outlays of capital and are often subject to material execution risks and delays. Our CCS project in particular requires Environmental
Protection Agency, or EPA, approval but the EPA’s own projected timeline for approval has lengthened and may lengthen further.
We may have insufficient financial resources, and we may be unable to raise sufficient capital, to complete our projects timely or at
all. Although we intend to use reputable third-party contractors with expertise in their fields to implement our projects, adverse conditions
and events as well as delays in capital projects are not uncommon. Moreover, the projects’ interaction with existing processes
may result in the degradation of other plant operations. For example, operation of our corn oil and high protein system at our Magic
Valley facility previously resulted in inconsistent product quality and degraded other operations at the plant, including production
rates. In the past, we have extended our expected completion dates for various projects and, as circumstances require, may have to do
so again.
In addition, our CCS project may be adversely
affected by the SAFE CCS Act or the United States Supreme Court’s decision in the case of Chevron U.S.A., Inc. v. Natural Resources
Defense Council, Inc., or both, as discussed below. The timing and economics of our CCS project may also be adversely affected by new
rules proposed by the U.S. Department of Transportation’s Pipeline and Hazardous Materials Safety Administration that impose stronger
standards for CO2 pipelines and establish new standards for transporting CO2 in a gaseous state via pipeline, adding
additional requirements and costs to the project.
We can provide no assurances that our projects
will be completed, or if completed, will be completed timely or within budget. We also can provide no assurances that our project assumptions
will reflect prevailing future conditions or that our projects will achieve the results we expect, including as to projected additional
EBITDA and Adjusted EBITDA. Failure to achieve our expected results may have a material adverse effect on our business, financial condition
and results of operations.
We regularly incur significant expenses to repair,
maintain and upgrade our production facilities and operating equipment, and any interruption in our operations would harm our operating
performance.
We regularly incur significant expenses to repair,
maintain and upgrade our production facilities and operating equipment, estimated at an average of $30.0 million per year. We incurred
$35.0 million of these expenses for 2024. The machines and equipment we use to produce our alcohols and essential ingredients are complex,
have many parts, and some operate on a continuous basis. We must perform routine equipment maintenance and must periodically replace
a variety of parts such as motors, pumps, pipes and electrical parts, and engage in other repairs. In addition, our production facilities
require periodic shutdowns to perform major maintenance and upgrades. Our production facilities also occasionally require unscheduled
shutdowns to perform repairs. For example, we completed our biennial wet mill outage at our Pekin Campus in Spring 2024. The wet mill
was offline for ten days, which negatively impacted sales and margins for the second quarter. In the first quarter of 2024, production
at our Colombia facility was hampered by equipment issues that extended the facility’s regularly scheduled outage. In the third
quarter of 2023 we experienced unusually high unscheduled production downtime for repairs and maintenance at our Pekin Campus which reduced
sales volumes and increased losses. These scheduled and unscheduled shutdowns result in lower sales and increased costs in the periods
during which a shutdown occurs and could result in unexpected operational issues in future periods resulting from changes to equipment
and operational and mechanical processes made during shutdown.
Our indebtedness may expose us to risks that could
negatively impact our business, prospects, liquidity, cash flows and results of operations.
We have incurred, and anticipate incurring additional,
substantial indebtedness for our capital improvement projects. We expect that these projects, when completed, will generate financial
returns sufficient to service and ultimately repay or refinance our indebtedness. However, the costs, timing, and effects of our capital
improvement projects may not meet our projections. In addition, our indebtedness could:
| ● | make
it more difficult to repay or refinance our indebtedness if it becomes due during adverse
economic and industry conditions; |
| ● | result
in adverse consequences due to a breach of our financial or other covenants and obligations
in favor of our lenders; |
| ● | limit
our flexibility to pursue strategic opportunities or react to changes in our business and
the industries in which we operate and, consequently, place us at a competitive disadvantage
to our competitors who have less debt; |
| ● | require
a substantial portion of our cash flows from operations for debt service payments, thereby
reducing the availability of our cash flows to fund working capital, additional capital expenditures,
acquisitions, dividend payments and for other general corporate purposes; or |
| ● | limit
our ability to procure additional financing for working capital or other purposes. |
Our ability to generate operating results and
sufficient cash to make all required principal and interest payments when due, and to satisfy our financial covenants and other obligations,
depends on our performance, which is subject to a variety of factors beyond our control, including the cost of key production inputs,
the supply of and demand for alcohols and essential ingredients, and many other factors related to the industries in which we operate.
We cannot provide any assurance that we will be able to timely service or satisfy our debt obligations, including our financial covenants.
Our failure to timely service or satisfy our debt obligations, including to meet our financial covenants, could result in our indebtedness
being immediately due and payable, and would have a material adverse effect on our business, business prospects, liquidity, financial
condition, cash flows and results of operations.
Our ability to utilize net operating loss carryforwards
and certain other tax attributes may be limited.
Federal and state income tax laws impose restrictions
on our use of net operating loss, or NOL, and tax credit carryforwards in the event that an “ownership change” occurs for
tax purposes, as defined by section 382 of the Internal Revenue Code, or Code. In general, an ownership change occurs when stockholders
owning 5% or more of a corporation entitled to use NOL or other loss carryforwards have increased their ownership by more than 50 percentage
points during any three-year period. The annual base limitation under section 382 of the Code is calculated by multiplying the corporation’s
value at the time of the ownership change by the greater of the long-term tax-exempt rate determined by the Internal Revenue Service
in the month of the ownership change or the two preceding months. Our ability to utilize our NOL and other loss carryforwards may be
substantially limited. These limitations could result in increased future tax obligations, which could have a material adverse effect
on our financial condition and results of operations.
Risks Related to Legal and Regulatory Matters
We may be adversely affected by environmental, health
and safety laws and regulations, as well as related liabilities that may not be adequately covered by insurance.
We are subject to various federal, state and local
environmental laws and regulations, including those relating to the discharge of materials into the air, water and ground; the generation,
storage, handling, use, transportation and disposal of hazardous materials and wastes; and the health and safety of our employees. In
addition, some of these laws and regulations require us to operate under permits that are subject to renewal or modification. These laws,
regulations and permits often require expensive pollution control equipment or operational changes to limit actual or potential impacts
to the environment. Any violation of these laws and regulations or permit conditions may result in substantial fines, natural resource
damages, criminal sanctions, permit revocations and/or production facility shutdowns. In addition, we have made, and expect to make,
significant capital expenditures on an ongoing basis to comply with increasingly stringent environmental laws, regulations and permits.
We may be liable for the investigation and cleanup
of environmental contamination at each of our production facilities and at off-site locations where we arrange for the disposal of hazardous
substances or wastes. If these substances or wastes have been or are disposed of or released at sites that undergo investigation and/or
remediation by regulatory agencies, we may be responsible under the Comprehensive Environmental Response, Compensation and Liability
Act of 1980, or other environmental laws for all or part of the costs of investigation and/or remediation, and for damages to natural
resources. We may also be subject to related claims by private parties alleging property damage and personal injury due to exposure to
hazardous or other materials at or from those properties. Some of these matters may require us to expend significant amounts for investigation,
cleanup or other costs not covered by insurance.
In addition, new laws, new interpretations of
existing laws, increased governmental enforcement of environmental laws or other developments could require us to make significant additional
expenditures. Continued government and public emphasis on environmental issues will likely result in increased future investments for
environmental controls at our production facilities. Present and future environmental laws and regulations, and interpretations of those
laws and regulations, applicable to our operations, more vigorous enforcement policies and discovery of currently unknown conditions
may require substantial expenditures that could have a material adverse effect on our results of operations and financial condition.
The hazards and risks associated with producing
and transporting our products (including fires, natural disasters, explosions and abnormal pressures and blowouts) may also result in
personal injury claims or damage to property and third parties. As protection against operating hazards, we maintain insurance coverage
against some, but not all, potential losses. However, we could sustain losses for uninsurable or uninsured risks, or in amounts in excess
of existing insurance coverages. Events that result in significant personal injury or damage to our property or third parties or other
losses that are not fully covered by insurance could have a material adverse effect on our results of operations and financial condition.
Our CCS project may be adversely affected
by the SAFE CCS Act and other Regulations.
The SAFE CCS Act was signed into law in Illinois
in July 2024. We are pursuing at our Pekin Campus, located in Illinois, a CCS project that will require significant financial and personnel
resources. Our CCS project is our most important ongoing capital improvement initiative. The SAFE CCS Act establishes stringent safety,
financial and insurance requirements on CO2 pipelines and imposes a moratorium on the construction of new CO2 pipelines
until the U.S. Department of Transportation’s Pipeline and Hazardous Materials Safety Administration finalizes its new safety rules
or July 1, 2026, whichever occur sooner. The SAFE CCS Act will result in increased compliance and other requirements likely adding costs
and potentially adding time to complete our CCS project. In January 2025, the U.S. Department of Transportation’s Pipeline and Hazardous
Materials Safety Administration proposed new rules that impose stronger standards for CO2 pipelines and establish new standards
for transporting CO2 in a gaseous state via pipeline, adding additional requirements
and costs to the project. We can provide no assurance that our CCS project will not be adversely affected by the SAFE CCS Act or other
regulations or that it will be financially viable in light of any new requirements and potential delays.
We may be adversely affected by food and drug laws
and regulations, as well as related liabilities that may not be adequately covered by insurance.
Some of our products are subject to regulation
by the U.S. Food and Drug Administration, or FDA, as well as similar state agencies. The FDA regulates, under the Federal Food, Drug,
and Cosmetic Act, or FDCA, the processing, formulation, safety, manufacture, packaging, labeling and distribution of food ingredients,
vitamins, cosmetics and pharmaceuticals for active and inactive ingredients. Many of the FDA’s and FDCA’s rules and regulations
apply directly to us as well as indirectly through their application in our customers’ products. To be properly marketed and sold
in the United States, a relevant product must be generally recognized as safe, approved and not adulterated or misbranded under the FDCA
and relevant regulations issued under the FDCA.
If we fail to comply with laws and FDA regulations
or those of similar state agencies, we may be prevented from selling certain of our products and may also be subject to government agency
enforcement liability. In addition, we may be subject to product liability and other claims by our customers or by individuals alleging
personal injury from our products as food and drug additives.
We maintain insurance coverage against some, but
not all, potential losses. Some of these matters, if they arise, may require us to expend significant amounts for investigation and defense
or other costs not covered by insurance. We could sustain losses for uninsurable or uninsured risks, or in amounts in excess of existing
insurance coverages. Events that result in significant personal injury or other losses that are not fully covered by insurance could
have a material adverse effect on our results of operations and financial condition.
The United States fuel-grade ethanol industry is
highly dependent upon various federal and state laws and regulations and any changes in or reinterpretations of those laws or regulations
could have a material adverse effect on our results of operations, cash flows and financial condition.
The domestic market for fuel-grade ethanol is
significantly impacted by federal mandates for volumes of renewable fuels (such as ethanol) required to be blended with gasoline. Future
demand for fuel-grade ethanol will largely depend on incentives to blend ethanol into motor fuels, including the price of ethanol relative
to the price of gasoline, the relative octane value of ethanol, constraints on the ability of vehicles to use higher ethanol blends,
and the EPA’s, established volumes from time to time, small refinery waivers, and other applicable environmental requirements.
The EPA has implemented the Renewable Fuel Standard
under the Energy Policy Act of 2005 and the Energy Independence and Security Act of 2007. The EPA, in coordination with the Secretary
of Energy and the Secretary of Agriculture, determines annual quotas for the quantity of renewable fuels (such as fuel-grade ethanol)
that must be blended into motor fuels consumed in the United States. The EPA finalized mandatory volumes of 15.0 billion gallons for
each of 2023, 2024, and 2025 of conventional renewable fuels, or corn-based fuel-grade ethanol, which could decline in future years.
The EPA may issue small refinery waivers, in full
or in part, to reduce or eliminate annual renewable fuel volume requirements for small refineries that process fewer than 75,000 barrels
of petroleum daily. In the past, the EPA has issued small refinery waivers that have materially and adversely affected overall demand
for and the price of fuel-grade ethanol. The U.S. Court of Appeals for the Fifth Circuit, in the fourth quarter of 2023, struck down
the EPA’s decision to deny numerous small refinery waivers, finding that the EPA’s denials were impermissibly retroactive,
contrary to law and counter to evidence in the litigation record. Accordingly, small refinery waivers from the EPA may be more likely
in the future and could again materially and adversely affect overall demand for and the price of fuel-grade ethanol.
Various bills in Congress introduced from time
to time are also directed at altering existing renewable fuels energy legislation, but none have passed in recent years. Some legislative
bills are directed at halting or reversing expansion of, or even eliminating in its entirety, the renewable fuel program.
Our results of operations, cash flows and financial
condition could be adversely impacted if the EPA reduces mandatory volumes or issues significant small refinery waivers, or if any legislation
is enacted that reduces volume requirements or if existing legislation is reinterpreted to have the same effect.
Future demand for fuel-grade ethanol is uncertain
and may be affected by changes to federal mandates, public perception, consumer acceptance and overall consumer demand for transportation
fuel, any of which could negatively affect demand for fuel-grade ethanol and our results of operations.
Although many trade groups, academics and governmental
agencies support ethanol as a fuel additive that promotes a cleaner environment, others criticize fuel-grade ethanol production and use
as consuming considerably more energy and emitting more greenhouse gases than other biofuels and potentially depleting water resources.
Some studies suggest that corn-based ethanol is less efficient than ethanol produced from other feedstock and that it negatively impacts
consumers by causing increased prices for dairy, meat and other food generated from livestock that consume corn. Additionally, critics
of fuel-grade ethanol contend that corn supplies are redirected from international food markets to domestic fuel markets. If negative
views of corn-based ethanol production gain broader acceptance, support for existing measures promoting use and domestic production of
corn-based ethanol as a fuel additive could decline, leading to a reduction or repeal of federal ethanol usage mandates, which would
materially and adversely affect the demand for fuel-grade ethanol. These views could also negatively impact public perception of the
fuel-grade ethanol industry and acceptance of ethanol as an alternative fuel.
There are limited markets for fuel-grade ethanol
beyond those established by federal mandates. Discretionary blending and E85 blending (i.e., gasoline blended with up to 85% fuel-grade
ethanol by volume) are important secondary markets. Discretionary blending is often determined by the price of fuel-grade ethanol relative
to the price of gasoline. In periods when discretionary blending is financially unattractive, the demand for fuel-grade ethanol may decline.
Also, the demand for fuel-grade ethanol is affected by the overall demand for transportation fuel. Demand for transportation fuel is
affected by the number of miles traveled by consumers and vehicle fuel economy. Lower demand for fuel-grade ethanol and essential ingredients,
including through the transition by consumers to alternative fuel vehicles such as electric vehicles and hybrid vehicles, would reduce
the value of our ethanol and related products, erode our overall margins and diminish our ability to generate revenue or to operate profitably.
In addition, we believe that additional consumer acceptance of E15 and E85 fuels is necessary before fuel-grade ethanol can achieve any
significant growth in market share relative to other transportation fuels.
The United States Supreme Court’s decision
in the case of Chevron U.S.A., Inc. v. Natural Resources Defense Council, Inc. may result in less industry-favorable rulemaking and agency
interpretations of laws and regulations, which could materially and adversely affect our results of operations, cash flows and financial
condition as well as the business and financial prospects of certain capital improvement projects, such as CCS.
The United States Supreme Court, in the landmark
case of Chevron U.S.A., Inc. v. Natural Resources Defense Council, Inc., recently overturned its prior doctrine of judicial deference
to administrative interpretations of laws and regulations. This outcome could materially and adversely affect rulemaking and agencies’
interpretations favorable to the renewable fuels industry, such as the EPA’s administration of the Renewable Fuel Standard. This
outcome could also materially and adversely affect the Treasury Department’s ability to promulgate favorable regulations under
the Inflation Reduction Act of 2022, including tax credits such as the section 45Q carbon capture and storage tax credits and section
45Z low carbon fuel tax credits, as well as other industry-favorable tax credits. Less industry-favorable rulemaking and agency interpretations
of laws and regulations could materially and adversely affect our results of operations, cash flows and financial condition as well as
the financial prospects of certain capital improvement projects, such as CCS.
Risks Related to Ownership of our Common Stock
Our stock price is highly volatile,
which could result in substantial losses for investors purchasing shares of our common stock and in litigation against us.
The market price of our common stock has fluctuated
significantly in the past and may continue to fluctuate significantly in the future. The market price of our common stock may continue
to fluctuate in response to one or more of the following factors, or any of the other risks or uncertainties discussed in this report,
many of which are beyond our control:
| ● | fluctuations
in our quarterly or annual operating results; |
| ● | fluctuations
in the market prices of our products; |
| ● | fluctuations
in the costs of key production input commodities such as corn and natural gas; |
| ● | the
timing, cost and effects of, and our ability to fund, our capital improvement projects, including
our CCS project; |
| ● | anticipated
trends in our financial condition and results of operations; |
| ● | our
ability to obtain any necessary financing; |
| ● | the
volume and timing of the receipt of orders for our products from major customers, including
annual contracted sales volumes for our specialty alcohols; |
| ● | competitive
pricing pressures; |
| ● | changes
in market valuations of companies similar to us; |
| ● | stock
market price and volume fluctuations generally; |
| ● | regulatory
developments or increased enforcement; |
| ● | additions
or departures of key personnel; |
| ● | environmental,
product or other liabilities we may incur; |
| ● | our
financing activities and future sales of our common stock or other securities; and |
| ● | our
ability to maintain contracts that are critical to our operations. |
The price at which you purchase shares of our
common stock may not be indicative of the price that will prevail in the trading market. You may be unable to sell your shares of common
stock at or above your purchase price, which may result in substantial losses to you and which may include the complete loss of your
investment. In the past, securities class action litigation has often been brought against a company following periods of high stock
price volatility. We may be the target of similar litigation in the future. Securities litigation could result in substantial costs and
divert management’s attention and our resources away from our business.
Any of the risks described above could have a
material adverse effect on our results of operations, the price of our common stock, or both.
Because we do not plan to pay any
cash dividends on our shares of common stock, our stockholders will not be able to receive a return on their shares unless and until
they sell them.
We intend to retain a significant portion of any
future earnings to finance the development, operation and expansion of our business. We do not anticipate paying any cash dividends on
our common stock in the near future. The declaration, payment, and amount of any future dividends will be made at the discretion of our
board of directors, and will depend upon, among other things, our results of operations, cash flows, and financial condition, operating
and capital requirements, compliance with any applicable debt covenants, and other factors our board of directors considers relevant.
There is no assurance that future dividends will be paid, and, if dividends are paid, there is no assurance of the amount of any such
dividend. Unless our board of directors determines to pay dividends, our stockholders will be required to look solely to appreciation
in the value of our common stock to realize any gain on their investment. There can be no assurance that any such appreciation will occur.
Our bylaws contain exclusive forum provisions that
could limit our stockholders’ ability to obtain a favorable judicial forum for disputes with us or our directors, officers, employees
or agents.
Our bylaws provide that, unless we consent in
writing to the selection of an alternative forum, the Delaware Court of Chancery shall be the sole and exclusive forum for (a) any derivative
action or proceeding brought on our behalf, (b) any action asserting a claim of breach of a fiduciary duty owed by any director, officer
or other employee of us to us or our stockholders, (c) any action asserting a claim arising pursuant to any provision of the Delaware
General Corporation Law, or (d) any action asserting a claim governed by the internal affairs doctrine.
Our bylaws also provide that, unless we consent
in writing to the selection of an alternative forum, to the fullest extent permitted by applicable law, the federal district courts of
the United States of America shall be the exclusive forum for the resolution of any complaint asserting a cause of action arising under
the Securities Act of 1933, as amended, or the Securities Act, including all causes of action asserted against any defendant named in
such complaint, including our officers and directors, underwriters for any offering giving rise to such complaint, and any other professional
entity whose profession gives authority to a statement made by that person or entity and who has prepared or certified any part of the
documents underlying the offering.
For the avoidance of doubt, the exclusive forum
provisions described above do not apply to any claims arising under the Securities Act or the Securities Exchange Act of 1934, as amended,
or the Exchange Act, to the extent federal law requires otherwise. Section 27 of the Exchange Act creates exclusive federal jurisdiction
over all suits brought to enforce any duty or liability created by the Exchange Act or the rules and regulations thereunder, and Section
22 of the Securities Act creates concurrent jurisdiction for federal and state courts over all suits brought to enforce any duty or liability
created by the Securities Act or the rules and regulations thereunder.
The choice of forum provisions in our bylaws may
limit our stockholders’ ability to bring a claim in a judicial forum that they find favorable for disputes with us or our directors,
officers, employees, agents or other third parties, which may discourage such lawsuits against us and our directors, officers, employees,
agents and other third parties even though an action, if successful, might benefit our stockholders. The applicable courts may also reach
different judgments or results than would other courts, including courts where a stockholder considering an action may be located or
would otherwise choose to bring the action, and such judgments or results may be more favorable to us than to our stockholders. With
respect to the provision making the Delaware Court of Chancery the sole and exclusive forum for certain types of actions, stockholders
who do bring a claim in the Delaware Court of Chancery could face additional litigation costs in pursuing any such claim, particularly
if they do not reside in or near Delaware. Finally, if a court were to find these provisions of our bylaws inapplicable to, or unenforceable
in respect of, one or more of the specified types of actions or proceedings, we may incur additional costs associated with resolving
such matters in other jurisdictions, which could have a material adverse effect on us.
General Risk Factors
Cyberattacks through security vulnerabilities could
lead to disruption of our business, reduced revenue, increased costs, liability claims, or harm to our reputation or competitive position.
Security vulnerabilities may arise from our hardware,
software, employees, contractors or policies we have deployed, which may result in external parties gaining access to our networks, data
centers, cloud data centers, corporate computers, manufacturing systems, and/or access to accounts we have at our suppliers, vendors
or customers. External parties may gain access to our data or our customers’ data, or attack the networks causing denial of service
or attempt to hold our data or systems in ransom. The vulnerability could be caused by inadequate account security practices such
as the failure to timely remove employee access when terminated. To mitigate these security issues, we have implemented measures throughout
our organization, including firewalls, backups, encryption, employee information technology policies and user account policies. However,
there can be no assurance that these measures will be sufficient to avoid cyberattacks. If any of these types of security breaches were
to occur and we were unable to protect sensitive data, our relationships with our business partners and customers could be materially
damaged, our reputation could be materially harmed, and we could be exposed to a risk of litigation and possible significant liability.
Further, if we fail to adequately maintain our
information technology infrastructure, we may have outages and data loss. Excessive outages may affect our ability to timely and efficiently
deliver products to customers or develop new products. Such disruptions and data loss may adversely impact our ability to fulfill orders
and interrupt other processes. Delayed sales or lost customers resulting from these disruptions could adversely affect our financial
results, stock price and reputation.
Our and our business partners’ or contractors’
failure to fully comply with applicable data privacy or similar laws could lead to significant fines and require onerous corrective action.
In addition, data security breaches experienced by us or our business partners or contractors could result in the loss of trade secrets
or other intellectual property, public disclosure of sensitive commercial data, and the exposure of personally identifiable information
(including sensitive personal information) of our employees, customers, suppliers, contractors and others.
Unauthorized
use or disclosure of, or access to, any personal information maintained by us or on our behalf, whether through breach of our systems,
breach of the systems of our suppliers or vendors by an unauthorized party, or through employee or contractor error, theft or misuse,
or otherwise, could harm our business. If any such unauthorized use or disclosure of, or access to, such personal information was to
occur, our operations could be seriously disrupted, and we could be subject to demands, claims and litigation by private parties, and
investigations, related actions, and penalties by regulatory authorities. In addition, we could incur significant costs in notifying
affected persons and entities and otherwise complying with the multitude of foreign, federal, state and local laws and regulations relating
to the unauthorized access to, or use or disclosure of, personal information. Finally, any perceived or actual unauthorized access to,
or use or disclosure of, such information could harm our reputation, substantially impair our ability to attract and retain customers
and have an adverse impact on our business, financial condition and results of operations.
Item 1B. Unresolved Staff Comments.
We have received no written comments regarding
our periodic or current reports from the staff of the Securities and Exchange Commission that were issued 180 days or more preceding
the end of our 2024 fiscal year and that remain unresolved.
Item 1C. Cybersecurity.
We recognize the critical importance of maintaining
the trust and confidence of our customers, business partners, employees and other stakeholders. We engage in active oversight of cybersecurity,
a cornerstone of our comprehensive enterprise risk management (ERM) program. Our cybersecurity framework is rooted in the National Institute
of Standards and Technology, or NIST, Cybersecurity Framework, or CSF, as well as the International Organization for Standardization
(ISO/IEC 27001), reflecting our commitment to uphold the highest cybersecurity standards. We align our policies, standards and practices
with these benchmarks and dynamically refine them to address evolving cybersecurity threats.
Risk Management and Strategy
We maintain a cybersecurity program aligned with
NIST CSF standards designed to identify critical assets and vulnerabilities, protect them with appropriate safeguards, promptly detect
cybersecurity events, respond effectively to mitigate their impact and recover from incidents to restore services. Our cybersecurity
program is designed to safeguard the confidentiality, integrity and availability of information. Our cybersecurity risk management strategy
includes:
| ● | Governance:
The Audit Committee of our Board of Directors oversees our cybersecurity risk management.
Our Chief Financial Officer and Director of Information Technology, along with key executives,
have roles in governance and facilitating alignment across our organization. |
| ● | Compliance
and Standards: We design our cybersecurity program for compliance with industry-specific
and other regulations (e.g., the General Data Protection Regulation (GDPR) and the California
Consumer Privacy Act (CCPA)) demonstrating our commitment to both domestic and international
information security standards. |
Technical Safeguards
We deploy technical defenses against cybersecurity
risks of attack and other incidents, including firewalls, intrusion detection and prevention systems and access controls. We refine these
measures based on our ongoing assessments, including cybersecurity threat intelligence updates.
| ● | Incident
Response and Recovery Planning: We maintain incident response and recovery frameworks,
tested twice yearly through backup restorations to critical systems, to improve our preparedness
to effectively manage and mitigate cybersecurity incidents. |
| ● | Education
and Awareness: Our personnel and members of our Board of Directors undergo mandatory
periodic training on cybersecurity threats, with updated insights into effective defense
mechanisms and our evolving cybersecurity policies and practices. |
| ● | Use of Third Parties: We collaborate with external cybersecurity service providers, including auditors, consultants and governmental agencies, to refine our cybersecurity measures. These service providers carry out cybersecurity risk evaluations such as periodic assessments and vulnerability scans to pinpoint potential security flaws and suggest enhancements. In addition, we employ third-party technology and other solutions to enhance our protection against cybersecurity risks. These solutions include our use of a managed security service provider to support our in-house technology team, an endpoint detection and response, or EDR, system for ongoing surveillance, detection, and action against threats, as well as a security information and event management, or SIEM, system designed to automate the real time identification, investigation and prioritization of critical alerts. |
| ● | Third-Party Risk Management: We use a comprehensive due diligence process to manage third-party risks, emphasizing continuous monitoring and to ensure our business partners’ cybersecurity practices meet our stringent standards. |
As of the filing of this report, we do not believe
that any risks from cybersecurity threats, including as a result of any previous cybersecurity incidents, have materially affected or
are reasonably likely to materially affect, Alto Ingredients, Inc.
Governance
| ● | We take a comprehensive and forward-looking approach to cybersecurity risk management under the oversight of our Audit Committee. Management, including our Chief Financial Officer and our Director of Information Technology, provide regular updates to ensure a strategic, unified response to cybersecurity challenges. Management is notified of, and monitors, cybersecurity incidents through our EDR and SIEM systems. |
| ● | Our Director of Information Technology has over 20 years of experience in information technology and five years of experience serving directly as a Chief Information Security Officer for other organizations. |
| ● | Our
networks and systems are continuously monitored by a combination of third-party service providers
and an internal cybersecurity team. Management is promptly notified of cybersecurity incidents. |
| ● | Our
Audit Committee is promptly notified by our management of any material cybersecurity breach. |
| ● | Our
Board of Directors is briefed at least quarterly on the state of our cybersecurity program. |
| ● | Our
internal cybersecurity team collaborates with external cybersecurity service providers, including
auditors, consultants and governmental agencies, to refine our cybersecurity measures. These
service providers carry out cybersecurity risk evaluations such as periodic assessments and
vulnerability scans to pinpoint potential security flaws and suggest enhancements. |
Engagement and Continuous Improvement
We periodically evaluate our cybersecurity measures
through internal and external audits and assessments to ensure our cybersecurity program is at the forefront of industry best practices.
The results of these audits and assessments inform adjustments to our cybersecurity program to improve our resilience against emerging
cybersecurity threats.
Item 2. Properties.
Our corporate headquarters, located in Pekin,
Illinois, consists of plants and facilities comprising our Pekin Campus production segment and totaling 145 acres on land we own. In
Sacramento, California, we lease office space totaling approximately 3,400 square feet under a lease expiring in 2026. In St. Louis,
Missouri, we lease warehouse space totaling approximately 84,000 square feet under a lease expiring in 2030. We have plants located in
Boardman, Oregon, at a 25-acre facility, and Burley, Idaho, at a 25-acre facility. The land in Boardman, Oregon is leased under a lease
expiring in 2076. We own the land in Burley, Idaho. The plants and facilities in Oregon and Idaho comprise our Western production segment.
See “Business—Production Facilities.” Our properties are subject to deeds of trust and other encumbrances in favor
of our lenders.
Item 3. Legal Proceedings.
We are subject to legal proceedings, claims and
litigation arising in the ordinary course of business. While the amounts claimed may be substantial, the ultimate liability cannot presently
be determined because of considerable uncertainties that exist. Therefore, it is possible that the outcome of those legal proceedings,
claims and litigation could adversely affect our quarterly or annual operating results or cash flows when resolved in a future period.
However, based on facts currently available, management believes such matters will not adversely affect in any material respect our financial
position, results of operations or cash flows.
Item 4. Mine Safety Disclosures.
Not applicable.
PART II
Item 5. Market For Registrant’s Common Equity, Related Stockholder Matters and Issuer Purchases of Equity Securities.
Market Information
Our common stock trades on The Nasdaq Capital
Market under the symbol “ALTO.” We also have non-voting common stock outstanding, which is convertible into our voting common
stock, and which is not listed on an exchange.
Security Holders
As of March 12, 2025, we had 76,611,090 shares
of common stock outstanding held of record by approximately 305 stockholders and 896 shares of non-voting common stock outstanding held
of record by one stockholder. These holders of record include depositories that hold shares of stock for brokerage firms which, in turn,
hold shares of stock for numerous beneficial owners. On March 12, 2025, the closing sales price of our common stock on The Nasdaq Capital
Market was $1.39 per share.
Performance Graph
The graph below shows a comparison of the cumulative
total stockholder return on our common stock with the cumulative total return on The Nasdaq Composite Index and The Nasdaq Clean Edge
Green Energy Index, or Peer Group, in each case over the five-year period ended December 31, 2024.
The graph assumes $100 invested at the indicated
starting date in our common stock and in each of The Nasdaq Composite Index and the Peer Group, with the reinvestment of all dividends.
We have not paid or declared any cash dividends on our common stock and do not anticipate paying any cash dividends on our common stock
in the foreseeable future. Stockholder returns over the indicated periods should not be considered indicative of future stock prices
or stockholder returns. This graph assumes that the value of the investment in our common stock and each of the comparison groups was
$100 on December 31, 2019.
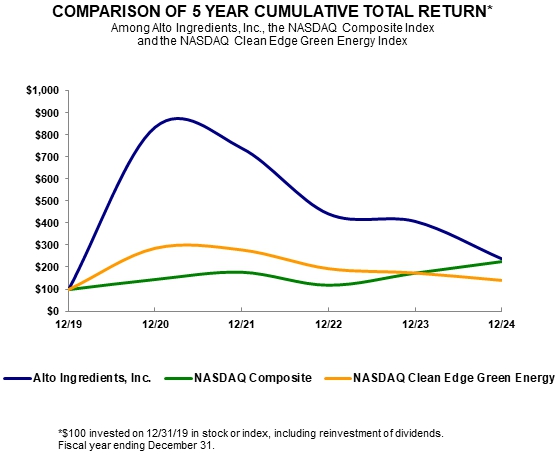
| | |
Years Ended | |
| | |
12/2019 | | |
12/2020 | | |
12/2021 | | |
12/2022 | | |
12/2023 | | |
12/2024 | |
| | |
| | |
| | |
| | |
| | |
| | |
| |
| Alto Ingredients, Inc. | |
| 100.00 | | |
| 835.38 | | |
| 740.00 | | |
| 443.08 | | |
| 409.23 | | |
| 240.00 | |
| Nasdaq Composite | |
| 100.00 | | |
| 144.92 | | |
| 177.06 | | |
| 119.45 | | |
| 172.77 | | |
| 223.87 | |
| Nasdaq Clean Edge Green Energy | |
| 100.00 | | |
| 284.83 | | |
| 277.30 | | |
| 193.70 | | |
| 174.51 | | |
| 141.58 | |
Dividend Policy
We have never paid cash dividends on our common
stock and do not intend to pay cash dividends on our common stock in the foreseeable future. We anticipate that we will retain any earnings
for use in the continued development of our business.
Our current and future debt financing arrangements
may limit or prevent cash distributions from our subsidiaries to us, depending upon the achievement of specified financial and other
operating conditions and our ability to properly service our debt, thereby limiting or preventing us from paying cash dividends. Further,
the holders of our outstanding Series B Preferred Stock are entitled to dividends of 7% per annum, payable quarterly in arrears. Accrued
and unpaid dividends in respect of our Series B Preferred Stock must be paid prior to the payment of any dividends in respect of shares
of our common stock.
For 2024, 2023 and 2022, we declared and paid
cash dividends on our outstanding shares of Series B Preferred Stock as they became due.
Recent Sales of Unregistered Securities
None.
Purchases of Equity Securities by the Issuer
and Affiliated Purchasers
None.
Item 6. [Reserved]
Not Applicable.
Item 7. Management’s Discussion and Analysis of Financial Condition and Results of Operations.
The following discussion and analysis of our
financial condition and results of operations should be read in conjunction with our consolidated financial statements and notes to consolidated
financial statements included elsewhere in this report. This discussion contains forward-looking statements, reflecting our plans and
objectives that involve risks and uncertainties. Actual results and the timing of events may differ materially from those contained in
these forward-looking statements due to a number of factors, including those discussed in the section entitled “Risk Factors”
and elsewhere in this report.
Overview
We are a leading producer and distributor of specialty
alcohols, renewable fuels and essential ingredients in the United States.
We operate five alcohol production facilities.
Three of our production facilities are located in Illinois, one is located in Oregon and another is located in Idaho. We have an annual
alcohol production capacity of 350 million gallons, including both renewable fuels and specialty alcohols ranging from industrial-, pharmaceutical-,
and high-quality food- and beverage-grade alcohols. Of this amount, we can produce up to 110 million gallons annually of specialty alcohols,
depending on our product mix among high-quality beverage-grade alcohol and other quality specification alcohols. We market and distribute
all of the alcohols produced at our facilities as well as alcohols produced by third parties. In 2024, we marketed and distributed approximately
386 million gallons combined of our own produced alcohols as well as fuel-grade ethanol produced by third parties, and over 1.4 million
tons of essential ingredients on a dry matter basis.
We also own and operate a liquid CO2
production facility adjacent to our plant in Oregon for the offtake of CO2 gas from the plant for conversion to liquid CO2
and subsequent sale.
In addition, we break bulk distribute specialty
alcohols, produced by us and third parties, through our Eagle Alcohol business.
We report our financial and operating performance
in three distinct segments:
| ● | Pekin
production, which includes the production and sale of alcohols and essential ingredients
produced at our three production facilities located in Pekin, Illinois, which we refer to
as our Pekin Campus; |
| ● | Marketing
and distribution, which includes marketing and merchant trading for company-produced
alcohols and essential ingredients on an aggregated basis, and sales of fuel-grade ethanol
sourced from third parties; and |
| ● | Western
production, which includes the production and sale of renewable fuels and essential
ingredients and, beginning in 2025, liquid CO2 produced at our western production
facilities, including our liquid CO2 plant, on an aggregated basis, none of which
are individually so significant as to be considered a separately reportable segment. |
Our mission is to produce the highest quality,
sustainable ingredients that make everyday products better. We intend to accomplish this goal in part by investing in our specialized
and higher value specialty alcohol production and distribution infrastructure, expanding production in high-demand essential ingredients,
expanding and extending the sale of our products into new regional and international markets, building efficiencies and economies of
scale and by capturing a greater portion of the value stream.
Production Segments
We produce specialty alcohols, renewable fuels
and essential ingredients, focusing on five key markets: Health, Home & Beauty; Food & Beverage; Industry &
Agriculture; Essential Ingredients; and Renewable Fuels. Products for Health, Home & Beauty markets include
specialty alcohols used in mouthwash, cosmetics, pharmaceuticals, hand sanitizers, disinfectants and cleaners. Products for Food &
Beverage markets include grain neutral spirits used in alcoholic beverages and vinegar and corn germ used for corn oils. Products
for Industry & Agriculture markets include alcohols and other products for paint applications and fertilizers. Products for
Essential Ingredients markets include dried yeast, corn protein meal, corn protein feed, corn germ, distillers grains, liquid
CO2 and liquid feed used in commercial animal feed and pet foods. We also sell yeast and liquid CO2 for human consumption.
Our products for the Renewable Fuels markets include fuel-grade ethanol and distillers corn oil used as a feedstock for renewable
diesel and biodiesel fuels. Our specialty alcohols for the Industry & Agriculture, Food & Beverage and Health, Home
& Beauty markets represented approximately 12%, 7% and 3%, respectively, of our sales in 2024 from these three markets.
We produce our alcohols and essential ingredients
at our facilities described below. Our production facilities located in Illinois are in the heart of the Corn Belt, benefit from relatively
low-cost and abundant feedstock and enjoy logistical advantages that enable us to provide our products to both domestic and international
markets via truck, rail or barge. Our production facilities located in Oregon and Idaho are near their respective fuel and feed customers,
offering significant timing, product transportation cost and logistical advantages.
All of our production facilities, other than our
Magic Valley plant, were operating for all of 2024, subject to scheduled and unscheduled downtimes to address facility repair and maintenance.
In January 2024, we temporarily hot-idled our Magic
Valley facility to minimize losses from negative regional crush margins and to expedite the installation of additional equipment to achieve
the intended production rate, quality and consistency from our corn oil and high protein system at the facility. We restarted our Magic
Valley facility in July 2024 and by October 2024, the facility consistently achieved average ethanol production rates at full capacity,
the protein content yield from the plant reached 50% or greater, and we were able to expand our corn oil yields. Increases in regional
corn basis and declining market prices for protein and corn oil resulted in overall margin compression, outweighing the economic benefits
of our plant improvements. As a consequence, we cold-idled our Magic Valley facility on December 31, 2024 to minimize financial losses.
We continue to provide terminal services at the plant and intend to resume operations at the facility when the economic environment in
the region sustainably improves. We believe that the cold-idling of our Magic Valley facility will have a positive impact on our overall
financial results in 2025 compared to 2024.
As market conditions change, we may increase,
decrease or idle production at one or more operating facilities or resume operations at any idled facility.
Marketing and Distribution Segment
We market and distribute all the alcohols and
essential ingredients we produce at our facilities. We also market and distribute alcohols produced by third parties.
We have extensive and long-standing customer relationships,
both domestic and international, for our specialty alcohols, renewable fuels and essential ingredients. These customers include producers
and distributors of ingredients for cosmetics, sanitizers and related products, distilled spirits producers, food products manufacturers,
producers of personal health/consumer health and personal care hygiene products, and global trading firms.
Our renewable fuels customers are located throughout
the Western and Midwestern United States and consist of integrated oil companies and gasoline marketers who blend fuel-grade ethanol
into gasoline. Our customers depend on us to provide a reliable supply of fuel-grade ethanol and manage the logistics and timing of delivery.
Our customers collectively require fuel-grade ethanol volumes in excess of the supplies we produce at our facilities. We secure additional
fuel-grade ethanol supplies from third-party ethanol producers. We arrange for transportation, storage and delivery of fuel-grade ethanol
purchased by our customers through our agreements with third-party service providers in the Western United States as well as in the Midwest
from a variety of sources.
We market food-grade essential ingredients to
human and pet food markets, our feed products (such as distillers grains) primarily to export markets from our Pekin Campus, and other
feed products to dairies and feedlots, in many cases located near our production facilities. These customers use our feed products for
livestock as a substitute for corn and other sources of starch and protein. We sell our corn oil to poultry, renewable diesel and biodiesel
customers.
See “Note 4 – Segments” to our
Notes to Consolidated Financial Statements included elsewhere in this report for financial information about our business segments.
Financial Review, Current Initiatives and Outlook
Our fourth quarter and full-year financial results
reflect challenging market conditions, including lower crush margins, compared to the fourth quarter of 2023 and the prior full year.
As discussed below, we took decisive action to rationalize our business which, together with over $30 million in associated asset impairments,
resulted in a material portion of the substantial non-cash, one-time expenses for the fourth quarter and full year 2024, resetting our
base. We also reduced our annual expense run rate by nearly $8 million. Together with improved performance at our Pekin Campus wet mill,
our synergistic acquisition of premium liquid CO2 processing and our entry into the European market through International
Sustainability and Carbon Certification, or ISCC, product sales, we are optimistic about 2025.
As part of our ongoing efforts to maximize shareholder
value, we have engaged an investment banking firm to explore the sale of our production facilities located in Oregon and Idaho. In addition,
with the assistance of our financial and legal advisors, we are considering a broad range of other options, including asset sales, a merger
or other strategic transactions to better align our long-term value potential.
In January, we acquired Kodiak Carbonic, a beverage-grade
liquid CO2 processor, for $7.6 million. This processing facility, renamed Alto Carbonic, is located adjacent to our Columbia
plant in Boardman, Oregon and has been operating profitably since 2015.
Alto Carbonic processes biogenic CO2
gas produced as a byproduct of the fermentation process at our Columbia plant and converts it into premium liquid CO2. The
finished product is sold into the Northwestern region of the United States for use in food and beverage processing, industrial cooling,
and other applications. The facility produces an average of approximately 56,000 tons annually of liquid CO2 with the capacity
to produce over 70,000 tons annually and the potential for further expansion. Alto Carbonic currently uses only 50% of our Columbia plant’s
biogenic CO2 gas.
Simultaneous with this acquisition, we entered
into an amended long-term sales offtake agreement with a leading North American industrial gas supplier. The acquisition is immediately
accretive and has a compelling payback of approximately two years. We are in the process of integrating the liquid CO2 plant
with our Columbia facility, improving coordination between operations. We expect to realize additional cost savings through synergies
in production and overhead. We are also evaluating an opportunity to increase storage capacity at the site to improve logistics and take
advantage of spot market demand for premium liquid CO2.
The acquisition immediately stems the recent lack
of profitability at our Columbia plant, provides a stronger financial foundation to overcome competitive challenges for destination plants
and significantly increases the value of these combined assets.
We integrated Eagle Alcohol’s high quality
alcohol bulk operations and customers into our Pekin Campus and Kinergy businesses and have now turned our focus to converting Eagle Alcohol’s
break-bulk warehousing and trucking operations into a profitable service center.
We also decreased staff at other operations, reducing
overhead run-rates of both costs of goods sold and selling, general and administrative expenses. In total, we reduced headcount by 16%
and expect to save nearly $8 million annually from these efficiencies, improving our bottom-line run rate and helping us manage our liquidity.
We expect to realize the full annualized financial benefit from these cost saving initiatives beginning in the second quarter.
As an additional cost saving initiative, we cold-idled
our Magic Valley facility at the end of 2024. For context, starting in 2022, we saw an opportunity to take advantage of premium prices
for high quality protein and corn oil. Consistent with our business strategy to improve yields of high margin products, we undertook
the installation and ultimate commissioning of high-quality protein and corn oil technology at our Magic Valley plant. The installation
took much longer and cost significantly more than expected. In addition, we underestimated the negative impact that the buildout of renewable
diesel and soy crush capacity would have on market prices for protein and corn oil in the region. Compounded by the dramatic swing in
delivered corn prices for Western operations compared to our Midwestern facilities, it became impossible to operate our Magic Valley
facility profitably. By cold idling the plant and reducing our variable and fixed costs as much as possible, we have stopped this drag
on the profitable areas of our business. In the fourth quarter, we took a significant impairment charge related to the Magic Valley plant.
To partially offset remaining carry expenses, and to serve our customers in the area, we are opportunistically using the facility as
a renewable fuel terminal.
At our Pekin Campus, we continue to pursue opportunities
to optimize carbon, which historically was considered a waste stream with only marginal value. In November, we achieved an important
milestone by finalizing our CO2 transportation and sequestration agreement with Vault 44.01, or Vault. This partnership is
critical to our carbon capture and storage, or CCS, project. In December, Vault submitted the formal application to the EPA for our CCS
project to obtain the Class VI permit required to begin construction of the CCS pipeline and for long-term CO2 storage in
deep geological formations.
CCS operations require significant development
and planning. The EPA requires extensive site analysis, monitoring and safety measures to safeguard underground water supplies. The approval
process is currently estimated to take at least two years. We expect that this approval timeline will also allow the time necessary to
address Illinois’s current moratorium on new CO2 pipelines imposed as part of its SAFE CCS Act. The moratorium is in
effect until the earlier of July 2026 or revised federal safety standards are established.
Although progress on our CCS project has been
slow, significant changes have occurred in the political and regulatory environment, as well as the carbon market, during that time.
Our deliberate pace has been advantageous as we navigate these changes and discover effective paths forward. The extended period required
for regulatory approvals affords us additional time to develop the necessary infrastructure plans, including compression and energy solutions.
We also intend to use the additional time to secure necessary financing. Finally, working with Vault, we are focused on meeting with
local groups and authorities to educate the community about our CCS project, strengthen support and address concerns.
At our Pekin Campus, we are proactively modifying
our operations to deliver higher value products. Following our biennial wet mill outage in spring 2024, we improved plant utilization,
operating the wet mill at nameplate capacity of 100 million gallons. Pekin Campus production volume in the fourth quarter increased 3.8
million gallons over the prior year period. This 7% increase demonstrates the effectiveness of our maintenance program. Carrying these
improvements into 2025, we expect to produce an additional 8 million gallons for the full year, lowering our per gallon cost of production
and enabling us to produce a greater volume of specialty alcohols.
We applied for, and in late summer obtained for
our Pekin Campus, ISCC certification for our renewable fuels business to allow us to ship qualified renewable fuel to the European Union
where we typically are able to garner premium prices compared to domestic markets. We began exporting certified renewable fuel to European
markets in the fourth quarter and anticipate expanding exports in 2025.
In our premium specialty alcohol business, we
continue to materially differentiate our products through our certifications and customer relationships. For 2024, we sold nearly 92
million gallons of specialty alcohols. In 2025, our goal is to balance production levels between specialty alcohols and ISCC renewable
fuels to maximize margins while addressing customer needs. We also completed another ISO 9001 audit with no adverse findings, a testament
to our culture of quality.
For the fourth quarter, we sold 95.1 million gallons,
up from 92.5 million gallons for the same period in 2023, largely reflecting production improvements at our Pekin Campus from our planned
repairs and maintenance program. However, our sales price per gallon averaged $1.88 in the fourth quarter compared to $2.24 for the same
period in 2023, reducing net sales by $38 million for the year over year period. Market crush margins declined nearly 18 cents per gallon
in the fourth quarter resulting in an $8.7 million adverse impact to gross profit for the period. In addition, returns from protein sales
were negatively impacted by expanded soy crush intended to meet renewable diesel demand, higher wet feed product mix and the inability
of a key customer to take product deliveries following Hurricane Helene. Low carbon fuel credit prices also declined in the fourth quarter
compared to the prior year period but improved sequentially from the third quarter of 2024 and continue to recover from market lows.
Our realized derivative losses, which are included
in Adjusted EBITDA (defined below), were $3.5 million for the fourth quarter compared to $2.3 million for the prior year period. Unrealized
derivative gains, which are excluded from Adjusted EBITDA, were $5.5 million for the fourth quarter compared to a loss of $8.2 million
for the prior year period, resulting in a positive $13.7 million year-over-year net difference. Our non-cash, lower of cost or market
adjustment on physical inventories and mark-to-market on corn commitments resulted in a $3.5 million reserve in the fourth quarter compared
to $2.2 million in the prior year period. In the fourth quarter, we recognized final acquisition-related expenses for Eagle Alcohol of
$5.7 million, of which $5.0 million was non-cash, compared to $0.7 million in the prior year period.
Asset impairments for the fourth quarter totaled
$24.8 million, consisting of $21.4 million related to the cold idling of our Magic Valley plant and $3.4 million related to the impairment
of intangibles from the integration of certain Eagle Alcohol activities, compared to a $6.0 million impairment in the prior year period
related to Eagle Alcohol’s goodwill.
Use of Non-GAAP Financial Measures
Management believes that
certain financial measures not in accordance with generally accepted accounting principles, or GAAP, are useful measures of operations.
Management provides EBITDA and Adjusted EBITDA as non-GAAP financial measures so that investors will have the same financial information
that management uses, which may assist investors in properly assessing our performance on a period-over-period basis.
We define EBITDA as unaudited
consolidated net income (loss) before interest expense, interest income, provision for income taxes and depreciation and amortization
expense. We define Adjusted EBITDA as unaudited consolidated net income (loss) before interest expense, interest income, unrealized derivative
gains and losses, acquisition-related expense, provision for income taxes, asset impairments, and depreciation and amortization expense.
A table is provided below
to reconcile Adjusted EBITDA to its most directly comparable GAAP measure, consolidated net income (loss). EBITDA and Adjusted EBITDA
are not measures of financial performance under GAAP and should not be considered as alternatives to consolidated net income (loss) or
any other measure of performance under GAAP, or to cash flows from operating, investing or financing activities as an indicator of cash
flows or as a measure of liquidity. EBITDA and Adjusted EBITDA have limitations as analytical tools and you should not consider these
measures in isolation or as a substitute for analysis of our results as reported under GAAP.
Information reconciling
forward-looking EBITDA or Adjusted EBITDA to forward-looking consolidated net income (loss) would require a forward-looking statement
of consolidated net income (loss) prepared in accordance with GAAP, which is unavailable to us without unreasonable effort. We are not
able to provide a quantitative reconciliation of forward-looking EBITDA or Adjusted EBITDA to forward-looking consolidated net income
(loss) because certain items required for reconciliation are uncertain, outside of our control and/or cannot reasonably be predicted,
such as net sales, cost of goods sold, unrealized derivative gains and losses, asset impairments and provision (benefit) for income taxes,
which we view as the most material components of consolidated net income (loss) that are not presently estimable.
Reconciliation of
Adjusted EBITDA to Consolidated Net Loss
| | |
Three Months Ended
December 31, | | |
Years Ended
December 31, | |
| (in thousands) (unaudited) | |
2024 | | |
2023 | | |
2024 | | |
2023 | |
| Consolidated net loss | |
$ | (41,712 | ) | |
$ | (18,945 | ) | |
$ | (58,984 | ) | |
$ | (28,005 | ) |
| Adjustments: | |
| | | |
| | | |
| | | |
| | |
| Interest expense, net | |
| 2,474 | | |
| 2,126 | | |
| 7,644 | | |
| 7,425 | |
| Interest income | |
| (112 | ) | |
| (265 | ) | |
| (689 | ) | |
| (854 | ) |
| Unrealized derivative (gains) losses | |
| (5,495 | ) | |
| 8,162 | | |
| (13,574 | ) | |
| 9,679 | |
| Acquisition-related expense | |
| 5,676 | | |
| 700 | | |
| 7,701 | | |
| 2,800 | |
| Asset impairments | |
| 24,790 | | |
| 5,970 | | |
| 24,790 | | |
| 6,544 | |
| Provision for income taxes | |
| 173 | | |
| 97 | | |
| 173 | | |
| 97 | |
| Depreciation and amortization expense | |
| 6,548 | | |
| 5,698 | | |
| 24,408 | | |
| 23,080 | |
| Total adjustments | |
| 34,054 | | |
| 22,488 | | |
| 50,453 | | |
| 48,771 | |
| Adjusted EBITDA | |
$ | (7,658 | ) | |
$ | 3,543 | | |
$ | (8,531 | ) | |
$ | 20,766 | |
2024 Financial Performance Summary
Our consolidated net sales declined by $0.3 billion
to $1.0 billion for 2024 from $1.2 billion for 2023. Our net loss attributable to common stockholders increased by $31.0 million to a
net loss of $60.3 million for 2024 from a net loss of $29.3 million for 2023.
Factors that contributed to these results of operations
for 2024 include:
| ● | Net
sales. Our net sales decline of $0.3 billion was due to a decline in our average sales
price per gallon and fewer tons of essential ingredients sold, partially offset by an increase
in total alcohol gallons sold. |
| o | Our average
sales price per gallon declined by $0.52, or 21%, to $1.95 for 2024 from $2.47 for 2023.
The decline was primarily driven by lower renewable fuel prices in 2024 largely due to lower
oil and gasoline prices. |
| o | Our volume
of essential ingredients sold declined by 0.1 million tons, or 7%, to 1.4 million tons for
2024 from 1.5 million tons for 2023 primarily due to lower alcohol production volumes during
2024. Our average sales price for our essential ingredients also declined primarily due to
lower corn prices. |
| o | Our total
gallons sold increased by 3.5 million gallons, or 1%, to 386.0 million gallons for 2024 from
382.5 million gallons for 2023. |
| ◾ | Our specialty alcohol
production sales volume increased by 14.8 million gallons, or 19%, to 91.5 million gallons
for 2024 from 76.7 million gallons for 2023 primarily due to increased customer demand for
specialty alcohols during the year. |
| ◾ | Our third-party sales
volume increased by 5.7 million gallons, or 6%, to 108.3 million gallons for 2024 from 102.6
million gallons for 2023. This increase resulted from our fulfillment of customer contracts
for renewable fuels using third party volumes while our Magic Valley and Pekin Campus plants
were offline in 2024. |
| ◾ | Our renewable fuel
production sales volume declined by 17.0 million gallons, or 8%, to 186.2 million gallons
for 2024 from 203.2 million gallons for 2023, primarily due to reduced production in 2024
as our Magic Valley facility was hot-idled for most of the first half of 2024 coupled with
scheduled production downtime at our Pekin Campus for repairs and maintenance. |
| ● | Gross
Profit. Our gross profit declined by $5.9 million to a gross profit of $9.7 million for
2024 from $15.7 million for 2023 partially due to weakened commodity crush margins from lower
ethanol sales prices as well as lower corn prices which reduced profits from our essential
ingredients. Our gross profit and margins were further impacted by production challenges
at our Magic Valley plant as we continued to incur costs to implement our high-protein and
corn oil system at the facility coupled with higher repairs and maintenance costs due to
our scheduled downtime at our Pekin Campus. |
Sales and Margins
We generate sales by marketing all of the
alcohols produced by our three production facilities in Illinois, all of the fuel-grade ethanol produced by our production
facilities in Oregon and Idaho, and fuel-grade ethanol purchased from third-party suppliers throughout the United States. We also
market essential ingredients produced by our production facilities, including dried yeast, corn protein meal, corn protein feed,
corn germ, and distillers grains and liquid feed used in commercial animal feed and pet foods. We also sell yeast and liquid
CO2 for human consumption.
Our profitability is highly dependent on various
commodity prices, including the market prices of corn, natural gas and fuel-grade ethanol.
Our consolidated average alcohol sales price declined
by 21% to $1.95 per gallon for 2024 compared to $2.47 per gallon for 2023. The average price of fuel-grade ethanol as reported by the
Chicago Mercantile Exchange, or CME, declined by 24% to $1.69 per gallon for 2024 compared to $2.22 per gallon for 2023. Our average
cost of corn declined by 28% to $4.72 per bushel for 2024 from $6.58 per bushel for 2023. The average price of corn as reported by the
CME declined by 25% to $4.24 per bushel for 2024 from $5.64 per bushel for 2023.
We believe that our gross profit margins depend
primarily on the following key factors:
| ● | the
prices of our specialty alcohols and the market price of fuel-grade ethanol, the latter of
which is impacted by the price of gasoline and related petroleum products, and government
regulation, including government ethanol mandates; |
| ● | the
market prices of key production input commodities, such as corn (including corn basis) and
natural gas; |
| ● | the
market prices of our essential ingredients; |
| ● | key
variable costs (other than production input commodities), such as production and other personnel
staffing; |
| ● | our
ability to anticipate trends in the market and contracted prices of our alcohols, essential
ingredients, and costs of key input commodities, and our ability to implement appropriate
risk management through hedging and other means, and opportunistic pricing strategies, as
well as the financial results of those hedging activities; |
| ● | the
proportion of our sales of specialty alcohols to our sales of fuel-grade ethanol produced
at our facilities relative to their respective market and contracted prices; and |
| ● | the
proportion of our sales of fuel-grade ethanol produced at our facilities to our sales of
fuel-grade ethanol produced by unrelated third-parties relative to the market price of fuel-grade
ethanol and marketing and distribution fees payable for third-party sales. |
We seek to optimize our gross profit margins by
anticipating the factors above and, when resources are available, implementing hedging transactions and taking other actions designed
to lock in margins, limit risk and otherwise address these factors. For example, we may seek to reduce inventory levels in anticipation
of declining alcohol or essential ingredient prices and increase production and inventory levels in anticipation of rising alcohol or
essential ingredient prices. We may also seek to alter our proportion or timing, or both, of purchase and sales commitments.
Our inability to anticipate the factors described
above or their relative importance, and adverse movements in the factors themselves, could result in declining or even negative gross
profit margins over certain periods of time. Our ability to anticipate these factors or favorable movements in these factors may enable
us to generate above-average gross profit margins. However, given the difficulty associated with successfully forecasting any of these
factors, we are unable to estimate our future sales or gross profit margins.
Results
of Operations
Selected
Financial Information
The following selected
financial information should be read in conjunction with our consolidated financial statements and notes to our consolidated financial
statements included elsewhere in this report, and the other sections of “Management’s Discussion and Analysis of Financial
Condition and Results of Operations” contained in this report.
Certain performance
metrics that we believe are important indicators of our results of operations include:
Certain performance
metrics that we believe are important indicators of our results of operations include the following:
| | |
| | |
| | |
Percentage Change | |
| | |
Years Ended December 31, | | |
2024 vs | | |
2023 vs | |
| | |
2024 | | |
2023 | | |
2022 | | |
2023 | | |
2022 | |
| Alcohol Sales (gallons in millions) | |
| | |
| | |
| | |
| | |
| |
| Pekin Campus renewable fuel gallons sold | |
| 125.7 | | |
| 136.2 | | |
| 116.1 | | |
| (8 | )% | |
| 17 | % |
| Western production renewable fuel gallons sold | |
| 60.5 | | |
| 67.0 | | |
| 92.4 | | |
| (10 | )% | |
| (27 | )% |
| Third-party renewable fuel gallons sold | |
| 108.3 | | |
| 102.6 | | |
| 117.9 | | |
| 6 | % | |
| (13 | )% |
| Total renewable fuel gallons sold | |
| 294.5 | | |
| 305.8 | | |
| 326.4 | | |
| (4 | )% | |
| (6 | )% |
| Specialty alcohol gallons sold | |
| 91.5 | | |
| 76.7 | | |
| 92.5 | | |
| 19 | % | |
| (17 | )% |
| Total gallons sold | |
| 386.0 | | |
| 382.5 | | |
| 418.9 | | |
| 1 | % | |
| (9 | )% |
| | |
| | | |
| | | |
| | | |
| | | |
| | |
| Sales Price per Gallon | |
| | | |
| | | |
| | | |
| | | |
| | |
| Pekin Campus | |
$ | 1.95 | | |
$ | 2.40 | | |
$ | 2.55 | | |
| (19 | )% | |
| (6 | )% |
| Western production | |
$ | 1.91 | | |
$ | 2.49 | | |
$ | 2.75 | | |
| (23 | )% | |
| (9 | )% |
| Marketing and distribution | |
$ | 2.00 | | |
$ | 2.56 | | |
$ | 2.83 | | |
| (22 | )% | |
| (10 | )% |
| Total | |
$ | 1.95 | | |
$ | 2.47 | | |
$ | 2.64 | | |
| (21 | )% | |
| (6 | )% |
| | |
| | | |
| | | |
| | | |
| | | |
| | |
| Alcohol Production (gallons in millions) | |
| | | |
| | | |
| | | |
| | | |
| | |
| Pekin Campus | |
| 212.4 | | |
| 209.7 | | |
| 208.8 | | |
| 1 | % | |
| 0 | % |
| Western production | |
| 58.7 | | |
| 68.1 | | |
| 91.2 | | |
| (14 | )% | |
| (25 | )% |
| Total | |
| 271.1 | | |
| 277.8 | | |
| 300.0 | | |
| (2 | )% | |
| (7 | )% |
| | |
| | | |
| | | |
| | | |
| | | |
| | |
| Corn Cost per Bushel | |
| | | |
| | | |
| | | |
| | | |
| | |
| Pekin Campus | |
$ | 4.45 | | |
$ | 6.32 | | |
$ | 7.32 | | |
| (30 | )% | |
| (14 | )% |
| Western production | |
$ | 5.73 | | |
$ | 7.45 | | |
$ | 8.97 | | |
| (23 | )% | |
| (17 | )% |
| Total | |
$ | 4.72 | | |
$ | 6.58 | | |
$ | 7.77 | | |
| (28 | )% | |
| (15 | )% |
| | |
| | | |
| | | |
| | | |
| | | |
| | |
| Average Market Metrics | |
| | | |
| | | |
| | | |
| | | |
| | |
| PLATTS Ethanol price per gallon | |
$ | 1.69 | | |
$ | 2.22 | | |
$ | 2.47 | | |
| (24 | )% | |
| (10 | )% |
| CME Corn cost per bushel | |
$ | 4.24 | | |
$ | 5.64 | | |
$ | 6.94 | | |
| (25 | )% | |
| (19 | )% |
| Board corn crush per gallon (1) | |
$ | 0.18 | | |
$ | 0.21 | | |
$ | 0.00 | | |
| (14 | )% | |
| — | |
| | |
| | | |
| | | |
| | | |
| | | |
| | |
| Essential Ingredients Sold (in thousands of tons) | |
| | | |
| | | |
| | | |
| | | |
| | |
| Pekin Campus | |
| | | |
| | | |
| | | |
| | | |
| | |
| Distillers grains | |
| 336.4 | | |
| 332.7 | | |
| 334.4 | | |
| 1 | % | |
| (1 | )% |
| CO2 | |
| 188.6 | | |
| 182.4 | | |
| 164.8 | | |
| 3 | % | |
| 11 | % |
| Corn wet feed | |
| 121.8 | | |
| 95.0 | | |
| 89.9 | | |
| 28 | % | |
| 6 | % |
| Corn dry feed | |
| 87.2 | | |
| 90.6 | | |
| 81.6 | | |
| (4 | )% | |
| 11 | % |
| Corn oil and germ | |
| 75.1 | | |
| 73.8 | | |
| 66.7 | | |
| 2 | % | |
| 11 | % |
| Syrup and other | |
| 38.6 | | |
| 41.2 | | |
| 56.9 | | |
| (6 | )% | |
| (28 | )% |
| Corn meal | |
| 35.4 | | |
| 36.8 | | |
| 32.1 | | |
| (4 | )% | |
| 15 | % |
| Yeast | |
| 23.2 | | |
| 25.9 | | |
| 23.9 | | |
| (10 | )% | |
| 8 | % |
| Total Pekin Campus | |
| 906.3 | | |
| 878.4 | | |
| 850.3 | | |
| 3 | % | |
| 3 | % |
| | |
| | | |
| | | |
| | | |
| | | |
| | |
| Western production | |
| | | |
| | | |
| | | |
| | | |
| | |
| Distillers grains | |
| 394.5 | | |
| 459.7 | | |
| 643.7 | | |
| (14 | )% | |
| (29 | )% |
| CO2 | |
| 57.7 | | |
| 119.1 | | |
| 77.4 | | |
| (52 | )% | |
| 54 | % |
| Syrup and other | |
| 54.8 | | |
| 55.5 | | |
| 55.8 | | |
| (1 | )% | |
| (1 | )% |
| Corn oil | |
| 7.6 | | |
| 8.0 | | |
| 10.2 | | |
| (5 | )% | |
| (22 | )% |
| Total Western Production | |
| 514.6 | | |
| 642.3 | | |
| 787.1 | | |
| (20 | )% | |
| (18 | )% |
| | |
| | | |
| | | |
| | | |
| | | |
| | |
| Total Essential Ingredients Sold | |
| 1,420.9 | | |
| 1,520.7 | | |
| 1,637.4 | | |
| (7 | )% | |
| (7 | )% |
| | |
| | | |
| | | |
| | | |
| | | |
| | |
| Essential Ingredients return % (2) | |
| | | |
| | | |
| | | |
| | | |
| | |
| Pekin Campus Return | |
| 49.7 | % | |
| 45.7 | % | |
| 41.3 | % | |
| 9 | % | |
| 11 | % |
| Western Production Return | |
| 32.0 | % | |
| 33.4 | % | |
| 31.6 | % | |
| (4 | )% | |
| 6 | % |
| Consolidated Total Return | |
| 45.2 | % | |
| 42.4 | % | |
| 37.9 | % | |
| 7 | % | |
| 12 | % |
| (1) | Assumes corn conversion of 2.80 gallons of alcohol per bushel
of corn. |
| (2) | Essential ingredients revenues as a percentage of total corn
costs consumed. |
Year Ended December 31, 2024 Compared to the Year Ended
December 31, 2023
| | |
Years Ended
December 31, | | |
Dollar | | |
Percentage | | |
Results as a Percentage
of Net Sales for the
Years Ended
December 31, | |
| | |
2024 | | |
2023 | | |
Change | | |
Change | | |
2024 | | |
2023 | |
| | |
(dollars in thousands) | | |
| |
| Net sales | |
$ | 965,258 | | |
$ | 1,222,940 | | |
$ | (257,682 | ) | |
| (21.1 | )% | |
| 100.0 | % | |
| 100.0 | % |
| Cost of goods sold | |
| 955,536 | | |
| 1,207,287 | | |
| (251,751 | ) | |
| (20.9 | )% | |
| 99.0 | % | |
| 98.7 | % |
| Gross profit | |
| 9,722 | | |
| 15,653 | | |
| (5,931 | ) | |
| (37.9 | )% | |
| 1.0 | % | |
| 1.3 | % |
| Selling, general and administrative expenses | |
| (29,736 | ) | |
| (29,864 | ) | |
| (128 | ) | |
| (0.4 | )% | |
| (3.1 | )% | |
| (2.4 | )% |
| Acquisition-related expenses | |
| (7,701 | ) | |
| (2,800 | ) | |
| 4,901 | | |
| 175.0 | % | |
| (0.8 | )% | |
| (0.2 | )% |
| Gain (loss) on sale (disposal) of assets | |
| 830 | | |
| (293 | ) | |
| 1,123 | | |
| * | | |
| (0.0 | )% | |
| (0.0 | )% |
| Asset impairments | |
| (24,790 | ) | |
| (6,544 | ) | |
| 18,246 | | |
| 278.8 | % | |
| (2.6 | )% | |
| (0.5 | )% |
| Loss from operations | |
| (51,675 | ) | |
| (23,848 | ) | |
| 27,827 | | |
| 116.7 | % | |
| (5.4 | )% | |
| (2.0 | )% |
| Income from cash grant | |
| — | | |
| 2,812 | | |
| (2,812 | ) | |
| (100.0 | )% | |
| 0.0 | % | |
| 0.2 | % |
| Interest expense, net | |
| (7,644 | ) | |
| (7,425 | ) | |
| 219 | | |
| 2.9 | % | |
| (0.8 | )% | |
| (0.6 | )% |
| Other income, net | |
| 508 | | |
| 553 | | |
| (45 | ) | |
| (8.1 | )% | |
| 0.1 | % | |
| 0.0 | % |
| Loss before provision for income taxes | |
| (58,811 | ) | |
| (27,908 | ) | |
| 30,903 | | |
| 110.7 | % | |
| (6.1 | )% | |
| (2.3 | )% |
| Provision for income taxes | |
| 173 | | |
| 97 | | |
| 76 | | |
| 78.4 | % | |
| 0.0 | % | |
| 0.0 | % |
| Consolidated net loss | |
$ | (58,984 | ) | |
$ | (28,005 | ) | |
$ | 30,979 | | |
| 110.6 | % | |
| (6.1 | )% | |
| (2.3 | )% |
| Preferred stock dividends | |
| (1,269 | ) | |
| (1,265 | ) | |
| 4 | | |
| 0.3 | % | |
| (0.1 | )% | |
| (0.1 | )% |
| Loss attributable to common stockholders | |
$ | (60,253 | ) | |
$ | (29,270 | ) | |
$ | 30,983 | | |
| 105.9 | % | |
| (6.2 | )% | |
| (2.4 | )% |
Net Sales
The decline in our consolidated net sales for
2024 as compared to 2023 was due to a decrease in our average sales price per gallon for our alcohols and lower volumes of essential
ingredients sold at lower prices, partially offset by a higher volume of alcohol sold. Our average sales price per gallon declined primarily
due to lower fuel-grade ethanol prices largely driven by lower oil and gasoline prices in 2024 compared to the prior year.
We also produced and sold fewer tons of essential
ingredients primarily due to lower alcohol production in 2024 compared to 2023. Our average sales price for our essential ingredients
declined primarily due to lower corn prices.
Partially offsetting these declines, we sold more
total gallons for 2024 as compared to 2023 resulting primarily from an increase in our specialty alcohol gallons sold and third-party
gallons sold, partially offset by lower renewable fuel production gallons sold due to downtime at both our Magic Valley facility and
our Pekin Campus, as discussed above. We were able to produce and sell more specialty alcohol due in part to higher production from our
Pekin Campus wet mill after our biennial maintenance outage during the year.
Pekin Campus Production Segment
Net sales of alcohol from our Pekin Campus production
segment declined by $86.5 million, or 17%, to $415.7 million for 2024 as compared to $502.2 million for 2023. Our total volume of production
gallons sold, however, increased by 4.7 million gallons, or 2%, to 213.6 million gallons for 2024 as compared to 208.9 million gallons
for 2023, due to production benefits realized in second half of the year from our biennial maintenance performed in Spring 2024 resulting
in higher production rates.
At the segment’s average sales price per
gallon of $1.95 for 2024, we generated $9.1 million in additional net sales from the 4.7 million additional gallons of alcohol sold in
2024 as compared to 2023. However, a decrease of $0.45, or 19%, in the segment’s average sales price per gallon in 2024 as compared
to 2023 resulted in a $95.6 million decline in net sales as compared to 2023.
Net sales of essential ingredients declined by
$48.4 million, or 22%, to $169.3 million for 2024 as compared to $217.7 million for 2023. Our total volume of essential ingredients sold
increased by 27,900 tons, or 3%, to 906,300 tons for 2024 from 878,400 tons for 2023. Sales volumes of essential ingredients from our
Pekin Campus were higher in 2024 due to higher production rates for the year. At our average sales price per ton of $186.81 for 2024,
we generated $5.2 million in additional net sales from the 27,900 additional tons of essential ingredients sold in 2024 as compared to
2023. A decrease of $61.03, or 25%, in our average sales price per ton in 2024 as compared to 2023 resulted in a $53.6 million decline
in net sales as compared to 2023.
Marketing and Distribution Segment
Net sales of renewable fuel from our marketing
and distribution segment, excluding intersegment sales, decreased by $46.5 million, or 18%, to $216.5 million for 2024 as compared to
$263.0 million for 2023.
Our volume of third-party renewable fuel sold
reported gross by the segment increased by 5.7 million gallons, or 6%, to 108.3 million gallons for 2024 as compared to 102.6 million
gallons for 2023. This increase resulted from a shift in the source of renewable fuel from our Magic Valley facility to third-party suppliers.
At the segment’s average sales price per gallon of $2.00 for 2024, net sales were $11.4 million higher as a result of the 5.7 million
additional gallons sold in 2024 as compared to 2023. This increase was partially offset by the $0.56 decrease in our average sales price
per gallon for 2024. The decrease of $0.56, or 22%, in our average sales price per gallon in 2024 as compared to 2023 resulted in a $57.9
million decline in net sales from our third-party renewable fuel sold by the segment compared to 2023.
Western Production Segment
Net sales of alcohol from our Western production
segment declined by $51.6 million, or 31%, to $115.4 million for 2024 as compared to $167.0 million for 2023. Our total volume of gallons
sold declined by 6.5 million gallons, or 10%, to 60.5 million gallons for 2024 as compared to 67.0 million gallons for 2023. This decline
in sales volume primarily resulted from lower production from our Magic Valley facility. At the segment’s average sales price of
$1.91 per gallon for 2024, net sales were $12.4 million lower as a result of the 6.5 million fewer gallons sold in 2024 as compared to
2023. A decline of $0.58, or 23%, in our average sales price per gallon in 2024 as compared to 2023 resulted in a $39.2 million decrease
in net sales of alcohol from the segment compared to 2023.
Net sales of essential ingredients declined by
$20.3 million, or 35%, to $37.0 million for 2024 as compared to $57.3 million for 2023. Our total volume of essential ingredients sold
declined by 127,700 tons, or 20%, to 514,600 tons for 2024 from 642,300 tons for 2023. At our average sales price of $71.81 per ton for
2024, net sales were $9.2 million lower as a result of the 127,700 fewer tons sold in 2024 as compared to 2023. In addition, our sales
price declined by $17.35 per ton for 2024. The decline of $17.35, or 19%, in our average sales price per ton in 2024 as compared to 2023
resulted in a decrease of $11.1 million in net sales of essential ingredients from the segment compared to 2023.
Corporate and Other Segment
Net sales from our Corporate and other segment
declined by $4.4 million or 28% to $11.4 million for 2024 as compared to $15.8 million for 2023. These results are from Eagle Alcohol’s
business.
Cost of Goods Sold and Gross Profit
Our consolidated gross profit declined to a gross
profit of $9.7 million, representing a gross margin of 1.0% for 2024, from $15.7 million, representing a gross margin of 1.3%, for 2023.
Our consolidated gross profit declined due to lower overall commodity crush margins, particularly for renewable fuel, primarily due to
lower sales prices as well as lower margins on essential ingredients sold due to lower corn prices. We spent a total of $34.6 million
for repairs and maintenance, in-line with our 2024 estimate.
Pekin Campus Production Segment
Our Pekin Campus production segment’s gross
profit improved by $12.7 million to a gross profit of $25.9 million from $13.3 million. Of this increase, $12.1 million is attributable
to higher commodity crush margins and $0.6 million is attributable to increased sales volumes in 2024 as compared to 2023.
Marketing and Distribution Segment
Our marketing and distribution segment’s
gross profit declined by $0.2 million to a gross profit of $4.0 million for 2024 from $4.2 million for 2023. Of this decrease, $0.4 million
is attributable to lower margins from sales of third-party renewable fuel, partially offset by an increase of $0.2 million attributable
to higher marketing volumes of third-party renewable fuel sold reported gross in 2024 as compared to 2023.
Western Production Segment
Our Western production segment’s gross loss
worsened by $13.8 million to a gross loss of $19.3 million for 2024 as compared to a gross loss of $5.5 million for 2023. Of this decline,
$15.8 million is attributable to significantly lower margins for renewable fuel, partially offset by $2.0 million attributable to lower
sales volumes at negative margins in 2024 as compared to 2023.
Corporate and Other Segment
Gross profit and loss from our Corporate and other
segment was a gross loss of $0.9 million for 2024 and a gross profit of $3.7 million for 2023, primarily from Eagle Alcohol’s business.
Selling, General and Administrative Expenses
Our selling, general and administrative, or SG&A,
expenses decreased by $0.1 million to $29.7 million for 2024 as compared to $29.8 million for 2023. SG&A expenses decreased primarily
due to lower professional fees.
Acquisition-related Expenses
Our acquisition-related expenses increased by
$4.9 million to $7.7 million for 2024 as compared to $2.8 million for 2023. These expenses relate to the acceleration of stock
payments to the former owners of Eagle Alcohol.
Asset Impairments
We recorded asset impairment charges of $24.8
million for 2024 as compared $6.5 million for 2023. The 2024 impairments reflect $21.4 million for our Magic Valley asset group, as we
cold-idled the plant at the end of the year, and $3.4 million for intangible assets of Eagle Alcohol. The 2023 impairments relate to
the goodwill associated with our acquisition of Eagle Alcohol.
Interest Expense, net
Interest expense, net, increased by $0.2 million
to $7.6 million for 2024 from $7.4 million for 2023. The increase in interest expense, net, is primarily due to higher debt balances,
as well as higher interest rates under Kinergy’s line of credit.
Year Ended December 31, 2023, Compared
to the Year Ended December 31, 2022
An analysis of our financial results comparing
2023 to 2022 can be found under “Management’s Discussion and Analysis of Financial Condition and Results of Operations”
in Part II, Item 7 in our Annual Report on Form 10-K for the fiscal year ended December 31, 2023, filed with the Securities and Exchange
Commission on March 14, 2024, which is available free of charge on the Securities and Exchange Commission’s website at www.sec.gov.
Liquidity and Capital Resources
During the year ended December 31, 2024, we funded
our operations primarily from cash on hand and proceeds from Kinergy’s operating line of credit. In addition to funding our operations,
we used our capital resources to continue our capital improvement projects, make an annual cash payment related to our acquisition of
Eagle Alcohol and pay preferred stock dividends.
As of December 31, 2024, we had $35.5 million
in cash and cash equivalents and $23.1 million available for borrowing under Kinergy’s operating line of credit. In addition, we
have up to an additional $65.0 million that may be available for capital improvement projects under our Orion term loan discussed below,
subject to certain conditions. We believe we have sufficient sources of liquidity to meet our anticipated working capital, debt service,
capital expenditure and other liquidity needs for at least the next twelve months from the date of this report.
Quantitative Year-End Liquidity Status
We believe that the following amounts provide
insight into our liquidity and capital resources. The following selected financial information should be read in conjunction with our
consolidated financial statements and notes to consolidated financial statements included elsewhere in this report, and the other sections
of “Management’s Discussion and Analysis of Financial Condition and Results of Operations” contained in this report
(dollars in thousands).
| | |
December 31,
2024 | | |
December 31,
2023 | | |
Change | |
| Cash, cash equivalents and restricted cash | |
$ | 36,211 | | |
$ | 45,480 | | |
| (20 | )% |
| Current assets | |
$ | 153,118 | | |
$ | 168,770 | | |
| (9 | )% |
| Property and equipment, net | |
$ | 214,742 | | |
$ | 248,748 | | |
| (14 | )% |
| Current liabilities | |
$ | 57,804 | | |
$ | 65,288 | | |
| (11 | )% |
| Long-term debt, noncurrent portion | |
$ | 92,904 | | |
$ | 82,097 | | |
| 13 | % |
| Working capital | |
$ | 95,314 | | |
$ | 103,482 | | |
| (8 | )% |
| Working capital ratio | |
| 2.65 | | |
| 2.59 | | |
| 2 | % |
Restricted Net Assets
At December 31, 2024, we had approximately $54.1
million of net assets at our subsidiaries that were not available to be transferred to Alto Ingredients, Inc. in the form of dividends,
distributions, loans or advances due to restrictions contained in our subsidiaries’ credit facilities.
Changes in Working Capital and Cash Flows
Working capital declined to $95.3 million at December
31, 2024 from $103.5 million at December 31, 2023 as a result of a $15.7 million decrease in current assets, partially offset by a $7.5
million decrease in current liabilities.
Current assets declined primarily due to decreases
in restricted cash, inventories and other current assets. Our current liabilities declined primarily due to decreases in derivative instruments
and accrued liabilities.
Our cash, cash equivalents and restricted cash
declined by $9.3 million due to $3.5 million of cash used in our operating activities and $13.5 million of cash used in our investing
activities primarily for our capital improvement projects, partially offset by $7.7 million in cash provided by our financing activities,
primarily due to proceeds from our operating line of credit.
Cash used in our Operating Activities
We used $3.5 million in cash in our operating
activities during 2024, as compared to $22.0 million in cash generated from our operating activities in 2023. Specific factors that contributed
significantly to the change in cash generated by our operating activities include:
| ● | an
increase of $31.0 million in net loss primarily due to lower commodity crush margins and
increased asset impairments; |
| ● | a
decrease of $19.1 million related to changes in the fair value of our derivative instruments
due to changes in commodity prices at period-end 2024 as compared to 2023; |
| ● | a
decrease of $8.9 million related to accounts receivable balances primarily due to the timing
of sales and collections; and |
| ● | a
decrease of $7.3 million in inventories due to lower period-end commodity prices. |
These amounts were partially offset by:
| ● | an increase of $22.5 million related to accounts payable and
accrued expenses due to the timing of payments; and |
| ● | an increase of $18.2 million in asset impairments primarily
related to the cold-idling of our Magic Valley facility. |
Cash used in our Investing Activities
We used $13.5 million of cash in our investing
activities for 2024, of which $11.1 million was for additions to property and equipment resulting from our capital improvement projects
and $2.8 million is attributable to cash paid for our acquisition of Eagle Alcohol.
Cash provided by our Financing Activities
Cash provided by our financing activities was $7.7
million for 2024, of which $9.0 million is attributable to net proceeds from Kinergy’s line of credit, partially offset by $1.3
million of preferred stock dividends.
Kinergy’s Operating Line of Credit
Kinergy maintains an operating line of credit for
an aggregate amount of up to $100.0 million. The credit facility matures on November 7, 2027. Interest accrues under the credit facility
at a rate equal to (i) the daily Secured Overnight Financing Rate, plus (ii) a specified applicable margin ranging from 1.25% to
1.75%. The credit facility’s monthly unused line fee is 0.25% to 0.375% of the amount by which the maximum credit under the facility
exceeds the average daily principal balance during the immediately preceding month. Payments that may be made by Kinergy to Alto Ingredients,
Inc. as reimbursement for management and other services provided by Alto Ingredients, Inc. to Kinergy are limited under the terms of the
credit facility to $1.5 million per fiscal quarter. The credit facility also includes the accounts receivable of our indirect wholly-owned
subsidiary, Alto Nutrients, LLC, or Alto Nutrients, as additional collateral. Payments that may be made by Alto Nutrients to Alto Ingredients,
Inc. as reimbursement for management and other services provided by Alto Ingredients, Inc. to Alto Nutrients are limited under the terms
of the credit facility to $0.5 million per fiscal quarter. Alto Nutrients markets our essential ingredients and also provides raw material
procurement services to our subsidiaries. In addition, the amount of cash distributions that Kinergy or Alto Nutrients may make to us
is also limited to up to 75% of excess cash flow.
For all monthly periods in which excess borrowing
availability falls below a specified level, Kinergy and Alto Nutrients must collectively maintain a fixed-charge coverage ratio (calculated
as a twelve-month rolling earnings before interest, taxes, depreciation and amortization divided by the sum of interest expense, capital
expenditures, principal payments of indebtedness, indebtedness from capital leases and taxes paid during such twelve-month rolling period)
of at least 1.1 and are prohibited from incurring certain additional indebtedness (other than specific intercompany indebtedness). The
obligations of Kinergy and Alto Nutrients under the credit facility are secured by all of our tangible and intangible assets.
We believe Kinergy and Alto Nutrients are in compliance
with the fixed-charge coverage ratio covenant as of the filing of this report. The following table sets forth the fixed-charge coverage
ratio financial covenant and the actual results for the periods presented:
| | |
Years Ended
December 31, | |
| | |
2024 | | |
2023 | |
| | |
| | |
| |
| Fixed-Charge Coverage Ratio Requirement | |
| 1.10 | | |
| 1.10 | |
| Actual | |
| 3.53 | | |
| 5.22 | |
| Excess | |
| 2.43 | | |
| 4.12 | |
Alto Ingredients, Inc. has guaranteed all of Kinergy’s
obligations under the credit facility. As of December 31, 2024, Kinergy had an outstanding balance of $39.7 million and $23.1 million
of unused borrowing availability under the credit facility.
Orion Term Loan
On November 7, 2022, we entered into a credit agreement
with certain funds managed by Orion Infrastructure Capital, or Lenders, under which the Lenders extended a senior secured credit facility
in the amount of up to $125.0 million, or Term Loan. The Term Loan is secured by a first priority lien on certain of our assets and a
second priority lien on certain assets of Kinergy and Alto Nutrients. Interest accrues on the unpaid principal amount of the Term Loan
at a fixed rate of 10% per annum. The Term Loan matures on November 7, 2028, or earlier upon acceleration.
We must prepay amounts outstanding under the Term
Loan on a semi-annual basis beginning with the six-month period ending December 31, 2023 in an amount equal to a percentage of our excess
cash flow based on a specified leverage ratio, as follows: (i) if our leverage ratio is greater than or equal to 3.0x, then the mandatory
prepayment amount will equal 100% of our excess cash flow, (ii) if our leverage ratio is less than 3.0x and greater than or equal to 1.5x,
then the mandatory prepayment amount will equal 50% of our excess cash flow, and (iii) if our leverage ratio is less than 1.5x, then the
mandatory prepayment amount will equal 25% of our excess cash flow.
As of December 31, 2024 and 2023, the principal
amount outstanding under the Term Loan was $60.0 million.
Other Cash Obligations
As of December 31, 2024, we had future commitments
for certain capital projects totaling $9.1 million. These commitments are scheduled to be satisfied through 2025.
In connection with our acquisition of Eagle Alcohol,
we are committed to pay contingent payments of up to $2.7 million in the first half of 2025.
Critical Accounting Policies and Estimates
Our discussion and analysis of our financial condition
and results of operations is based on our consolidated financial statements, which have been prepared in accordance with accounting principles
generally accepted in the United States of America. The preparation of these financial statements requires us to make estimates and judgments
that affect the reported amounts of assets and liabilities and disclosure of contingent assets and liabilities at the date of the financial
statements and the reported amount of net sales and expenses for each period. The following represents a summary of our critical accounting
policies and related estimates, defined as those policies that we believe are the most important to the portrayal of our financial condition
and results of operations and that require management’s most difficult, subjective or complex judgments, often as a result of the
need to make estimates about the effects of matters that are inherently uncertain.
Accounting for Business Combinations
Determining the fair value of assets acquired and
liabilities assumed in a business combination is considered a critical accounting estimate because the allocation of the purchase price
to assets acquired and liabilities assumed based upon fair values requires significant management judgment and the use of subjective measurements.
Variability in industry conditions and changes in assumptions or subjective measurements used to allocate fair value are reasonably possible
and may have a material impact on our financial position, liquidity or results of operations.
Revenue Recognition
We recognize revenue primarily from sales of alcohols
and essential ingredients.
We have five alcohol production facilities from
which we produce and sell alcohols to our customers through our subsidiary, Kinergy. Kinergy enters into sales contracts with customers
under exclusive intercompany sales agreements with each of our five production facilities. Kinergy also acts as a principal when it purchases
third party fuel-grade ethanol which it resells to its customers. Finally, in 2022, Kinergy had exclusive sales agreements with two third-party
owned fuel-grade ethanol plants under which it sold the plants’ fuel-grade ethanol production for a fee plus the costs to deliver
the ethanol to Kinergy’s customers. Kinergy has since terminated these contracts. These sales are referred to as third-party agent
sales. Revenue from these third-party agent sales is recorded on a net basis, with Kinergy recognizing its predetermined fees and any
associated delivery costs.
We have five production facilities from which we
produce and sell essential ingredients to our customers through our subsidiary, Alto Nutrients. Alto Nutrients enters into sales contracts
with essential ingredient customers under exclusive intercompany sales agreements with each of our five production facilities.
We recognize revenue from sales of alcohols and
essential ingredients at the point in time when the customer obtains control of the products, which typically occurs upon delivery depending
on the terms of the underlying contracts. In some instances, we enter into contracts with customers that contain multiple performance
obligations to deliver volumes of alcohols or essential ingredients over a contractual period of less than 12 months. We allocate the
transaction price to each performance obligation identified in the contract based on relative standalone selling prices and recognize
the related revenue as control of each individual product is transferred to the customer in satisfaction of the corresponding performance
obligations.
When we are the agent, the supplier controls the
products before they are transferred to the customer because the supplier is primarily responsible for fulfilling the promise to provide
the product, has inventory risk before the product has been transferred to a customer and has discretion in establishing the price for
the product. When we are the principal, we control the products before they are transferred to the customer because we are primarily responsible
for fulfilling the promise to provide the products, we have inventory risk before the product has been transferred to a customer and we
have discretion in establishing the price for the product.
See “Note 4 – Segments” of the
Notes to Consolidated Financial Statements for our revenue breakdown by type of contract.
Impairment of Long-Lived Assets
Our long-lived assets have been primarily associated
with our production facilities, reflecting their original cost, adjusted for depreciation and amortization and any subsequent impairment.
We assess the impairment of long-lived assets,
including property and equipment, when events or changes in circumstances indicate that the fair value of an asset group could be less
than the net book value of the asset group. Generally, we assess long-lived assets for impairment by first determining the forecasted,
undiscounted cash flows each asset is expected to generate plus the net proceeds expected from the sale of the asset group. If the total
amount of the undiscounted cash flows is less than the carrying value of the asset group, we then determine the fair value of the asset
group. When the estimated fair value of the asset group is less than its carrying value, we recognize an impairment expense equal to the
difference between the asset group’s carrying value and estimated fair value. Forecasts of future cash flows are estimates based
on our experience and knowledge of our operations and the industry in which we operate. These estimates could be significantly affected
by future changes in market conditions, the economic environment, including inflation, and the purchasing decisions of our customers.
As a result, we recorded asset impairments of $21.4 million and $0.6 million with respect to our Magic Valley facility and right of use
assets associated with our operating leases for the years ended December 31, 2024 and 2023, respectively.
We review our intangible assets, including goodwill,
with indefinite lives at least annually or more frequently if impairment indicators arise. In our review, we determine the fair value
of these assets using market multiples and discounted cash flow modeling and compare it to the net book value of the reporting unit. Any
assessed impairments will be recorded permanently and expensed in the period in which the impairment is determined. We performed our annual
review of impairment and recognized asset impairments of $3.4 million and $6.0 million against our intangible assets and goodwill for
the years ended December 31, 2024 and 2023, respectively. We did not recognize any asset impairments for the year ended December 31, 2022.
Valuation Allowance for Deferred Taxes
We account for income taxes under the asset and
liability approach, where deferred tax assets and liabilities are determined based on differences between financial reporting and tax
bases of assets and liabilities, and are measured using enacted tax rates and laws that are expected to be in effect when the differences
reverse. Valuation allowances are established when necessary to reduce deferred tax assets to the amounts expected to be realized.
We evaluate our deferred tax asset balance for
realizability. To the extent we believe it is more likely than not that some portion or all of our deferred tax assets will not be realized,
we will establish a valuation allowance against the deferred tax assets. Realization of our deferred tax assets is dependent upon future
taxable income during the periods in which the associated temporary differences become deductible. We consider the scheduled reversal
of deferred tax liabilities, projected future taxable income and tax planning strategies in making this assessment. These changes, if
any, may require possible material adjustments to these deferred tax assets, resulting in a reduction in net income or an increase in
net loss in the period when such determinations are made.
We had pre-tax consolidated net losses of $58.8
million, $27.9 million and $39.7 million for the years ended December 31, 2024, 2023 and 2022, respectively. Based on our current and
prior results, we do not have sufficient evidence to support a conclusion that we will more likely than not be able to benefit from our
remaining deferred tax assets. As such, we have recorded a valuation allowance against our net deferred tax assets.
Derivative Instruments
We evaluate our contracts to determine whether
the contracts are derivative instruments. Management may elect to exempt certain forward contracts that meet the definition of a derivative
from derivative accounting as normal purchases or normal sales. Normal purchases and normal sales are contracts that provide for the purchase
or sale of something other than a financial instrument or derivative instrument that will be delivered in quantities expected to be used
or sold over a reasonable period in the normal course of business. Contracts that meet the requirements of normal purchases or sales are
documented as normal and exempted from the fair value accounting and reporting requirements of derivative accounting.
We enter into short-term cash, option and futures
contracts as a means of securing purchases of corn, natural gas and sales of fuel-grade ethanol and managing exposure to changes in commodity
prices. All of our exchange-traded derivatives are designated as non-hedge derivatives for accounting purposes, with changes in fair value
recognized in net income. Although the contracts are economic hedges of specified risks, they are not designated or accounted for as hedging
instruments.
Realized and unrealized gains and losses related
to exchange-traded derivative contracts are included as a component of cost of goods sold in the accompanying financial statements. The
fair values of contracts entered through commodity exchanges are presented on the accompanying balance sheet as derivative assets or liabilities.
The selection of normal purchase or sales contracts, and use of hedge accounting, are accounting policies that can change the timing of
recognition of gains and losses in the statement of operations.
Item 7A. Quantitative and Qualitative Disclosures About Market Risk.
We are exposed to various market risks, including
changes in commodity prices, as discussed below. Market risk is the potential loss arising from adverse changes in market rates and prices.
In the ordinary course of business, we may enter into various types of transactions involving financial instruments to manage and reduce
the impact of changes in commodity prices. We do not have material exposure to interest rate risk. We do not expect to have any exposure
to foreign currency risk as we conduct all of our transactions in U.S. dollars.
We produce and distribute specialty alcohol, fuel-grade
ethanol and essential ingredients. Our business is sensitive to changes in the prices of ethanol and corn. In the ordinary course of business,
we may enter into various types of transactions involving financial instruments to manage and reduce the impact of changes in ethanol
and corn prices. We do not enter into derivatives or other financial instruments for trading or speculative purposes.
We are subject to market risk with respect to ethanol
and corn pricing. Ethanol prices are sensitive to global and domestic ethanol supply; crude-oil supply and demand; crude-oil refining
capacity; carbon intensity; government regulation; and consumer demand for alternative fuels. Our ethanol sales are priced using contracts
that are either based on a fixed price or an indexed price tied to a specific market, such as Chicago Ethanol (Platts) or the Oil Price
Information Service. Under these fixed-priced arrangements, we are exposed to risk of a decrease in the market price of ethanol between
the time the price is fixed and the time the alcohol is sold.
We satisfy our physical corn needs, the principal
raw material used to produce alcohol and essential ingredients, based on purchases from our corn vendors. Generally, we determine the
purchase price of our corn at or near the time we begin to grind. Additionally, we also enter into volume contracts with our vendors to
fix the purchase price. As such, we are also subject to market risk with respect to the price of corn. The price of corn is subject to
wide fluctuations due to unpredictable factors such as weather conditions, farmer planting decisions, governmental policies with respect
to agriculture and international trade and global supply and demand. Under the fixed price arrangements, we assume the risk of a decrease
in the market price of corn between the time the price is fixed and the time the corn is utilized.
Essential ingredients are sensitive to various
demand factors such as numbers of livestock on feed, prices for feed alternatives and supply factors, primarily production of ethanol
co-products by ethanol plants and other sources.
As noted above, we may attempt to reduce the market
risk associated with fluctuations in the price of ethanol or corn by employing a variety of risk management and hedging strategies. Strategies
include the use of derivative financial instruments such as futures and options executed on the CME and/or the New York Mercantile Exchange,
as well as the daily management of physical corn.
These derivatives are not designated for special
hedge accounting treatment, and as such, the changes in the fair values of these contracts are recorded on the balance sheet and recognized
immediately in cost of goods sold. We recognized net gains of $11.0 million, net losses of $8.0 million and net gains of $19.3 million
related to the change in the fair values of these contracts for the years ended December 31, 2024, 2023 and 2022, respectively.
We prepared a sensitivity analysis as of December
31, 2024 to estimate our exposure to ethanol and corn. Market risk related to these factors was estimated as the potential change in pre-tax
income resulting from a hypothetical 10% adverse change in the prices of our expected ethanol and corn volumes. The analysis uses average
CME prices for the year and does not factor in future contracted volumes. The results of this analysis for the year ended December 31,
2024, which may differ materially from actual results, are as follows (in millions):
| Commodity | |
Volume | |
Unit of Measure | |
Approximate
Adverse Change to
Pre-Tax Income | |
| Ethanol | |
294.5 | |
Gallons | |
$ | 31.6 | |
| Corn | |
66.5 | |
Bushels | |
$ | 28.2 | |
Item 8. Financial Statements and Supplementary Data.
Reference is made to the financial statements,
which begin at page F-1 of this report.
Item 9. Changes in and Disagreements with Accountants on Accounting and Financial Disclosure.
None.
Item 9A. Controls and Procedures.
We conducted an evaluation under the supervision
and with the participation of our management, including our Chief Executive Officer and Chief Financial Officer, of the effectiveness
of the design and operation of our disclosure controls and procedures. The term “disclosure controls and procedures,” as defined
in Rules 13a-15I and 15d-15(e) under the Securities Exchange Act of 1934, as amended, or Exchange Act, means controls and other procedures
of a company that are designed to ensure that information required to be disclosed by the company in the reports it files or submits under
the Exchange Act is recorded, processed, summarized and reported, within the time periods specified in the Securities and Exchange Commission’s
rules and forms. Disclosure controls and procedures also include, without limitation, controls and procedures designed to ensure that
information required to be disclosed by a company in the reports that it files or submits under the Exchange Act is accumulated and communicated
to the company’s management, including its principal executive and principal financial officers, or persons performing similar functions,
as appropriate, to allow timely decisions regarding required disclosure. Based on this evaluation, our Chief Executive Officer and Chief
Financial Officer concluded as of December 31, 2024 that our disclosure controls and procedures were effective at a reasonable assurance
level.
Management’s Report on Internal Control
over Financial Reporting
Our management is responsible for establishing
and maintaining adequate internal control over financial reporting as defined in Rules 13a-15(f) and 15d-15(f) under the Exchange Act.
Our internal control over financial reporting is designed to provide reasonable assurance regarding the reliability of financial reporting
and the preparation of financial statements for external purposes in accordance with generally accepted accounting principles. Our internal
control over financial reporting includes those policies and procedures that:
| (i) | pertain to the maintenance of records that, in reasonable
detail, accurately and fairly reflect the transactions and dispositions of our assets; |
| (ii) | provide reasonable assurance that transactions are recorded
as necessary to permit preparation of financial statements in accordance with generally accepted accounting principles, and that our
receipts and expenditures are being made only in accordance with authorizations of our management and directors; and |
| (iii) | provide reasonable assurance regarding prevention or timely
detection of unauthorized acquisition, use or disposition of our assets that could have a material effect on our financial statements. |
Because of its inherent limitations, internal control
over financial reporting may not prevent or detect misstatements. Also, projections of any evaluation of effectiveness to future periods
are subject to the risk that controls may become inadequate because of changes in conditions, or that the degree of compliance with the
policies or procedures may deteriorate.
A material weakness is defined by the Public Company
Accounting Oversight Board’s Audit Standards AS 2201 as being a deficiency, or combination of deficiencies, in internal control
over financial reporting, such that there is a reasonable possibility that a material misstatement of the company’s annual or interim
financial statements will not be prevented or detected on a timely basis by the company’s internal controls.
Under the supervision and with the participation
of our management, including our principal executive officer and principal financial officer, we conducted an evaluation of the effectiveness
of our internal control over financial reporting based on the framework set forth in Internal Control — Integrated Framework
(2013) issued by the Committee of Sponsoring Organizations of the Treadway Commission. Based on our evaluation under the framework
set forth in Internal Control — Integrated Framework (2013), our management concluded that our internal control over financial
reporting was effective as of December 31, 2024.
RSM US LLP, an independent registered public accounting
firm, has issued an attestation report on our internal control over financial reporting as of December 31, 2024. That report is included
in Part IV of this report.
Inherent Limitations on the Effectiveness
of Controls
Management does not expect that our disclosure
controls and procedures or our internal control over financial reporting will prevent or detect all errors and all fraud. A control system,
no matter how well conceived and operated, can provide only reasonable, not absolute, assurance that the objectives of the control systems
are met. Further, the design of a control system must reflect the fact that there are resource constraints, and the benefits of controls
must be considered relative to their costs. Because of the inherent limitations in a cost-effective control system, no evaluation of internal
control over financial reporting can provide absolute assurance that misstatements due to error or fraud will not occur or that all control
issues and instances of fraud, if any, have been or will be detected.
These inherent limitations include the realities
that judgments in decision-making can be faulty and that breakdowns can occur because of a simple error or mistake. Controls can also
be circumvented by the individual acts of some persons, by collusion of two or more people, or by management override of the controls.
The design of any system of controls is based in part on certain assumptions about the likelihood of future events, and there can be no
assurance that any design will succeed in achieving its stated goals under all potential future conditions. Projections of any evaluation
of controls effectiveness to future periods are subject to risks. Over time, controls may become inadequate because of changes in conditions
or deterioration in the degree of compliance with policies or procedures.
Changes in Internal Control
over Financial Reporting
There has been no change in our internal control
over financial reporting (as defined in Rules 13a-15(f) and 15d-15(f) under the Exchange Act) during the most recently completed fiscal
quarter that has materially affected, or is reasonably likely to materially affect, our internal control over financial reporting.
Item 9B. Other Information.
During the three months ended December 31, 2024,
none of our directors or officers (as defined in Rule 16a-1(f) of the Securities Exchange Act of 1934, as amended) informed us of the
adoption, modification or termination of a Rule 10b5-1 trading arrangement or non-Rule 10b5-1 trading arrangement (as such terms are defined
in Item 408 of Regulation S-K of the Securities Act of 1933, as amended).
Item 9C. Disclosure Regarding Foreign Jurisdictions that Prevent Inspections.
Not applicable.
PART III
Item 10. Directors, Executive Officers and Corporate Governance.
The information under the captions “Information
about our Board of Directors, Board Committees and Related Matters” appearing in the Proxy Statement, is hereby incorporated by
reference.
Item 11. Executive Compensation.
The information under the caption “Executive
Compensation and Related Information,” appearing in the Proxy Statement, is hereby incorporated by reference.
Item 12. Security Ownership of Certain Beneficial Owners and Management and Related Stockholder Matters.
The information under the captions “Security
Ownership of Certain Beneficial Owners and Management” and “Equity Compensation Plan Information,” appearing in the
Proxy Statement, is hereby incorporated by reference.
Item 13. Certain Relationships and Related Transactions, and Director Independence.
The information under the captions “Certain
Relationships and Related Transactions” and “Information about our Board of Directors, Board Committees and Related Matters—Director
Independence” appearing in the Proxy Statement, is hereby incorporated by reference.
Item 14. Principal Accountant Fees and Services.
The information under the caption “Audit
Matters—Principal Accountant Fees and Services,” appearing in the Proxy Statement, is hereby incorporated by reference.
PART IV
Item 15. Exhibits and Financial Statement Schedules.
(a)(1) Financial Statements
Reference is made to the financial statements listed
on and attached following the Index to Consolidated Financial Statements contained on page F-1 of this report.
(a)(2) Financial Statement Schedules
None.
(a)(3) Exhibits
Reference is made to the exhibits listed on the
Index to Exhibits.
Item 16. Form 10-K Summary.
None.
Index
to Consolidated Financial Statements
REPORT OF INDEPENDENT REGISTERED PUBLIC ACCOUNTING
FIRM
To the Stockholders and the Board of Directors
of Alto Ingredients, Inc.
Opinion on the Financial Statements
We have audited the accompanying consolidated balance sheets of Alto
Ingredients, Inc. and its subsidiaries (the Company) as of December 31, 2024 and 2023, the related consolidated statements of operations,
comprehensive income (loss), stockholders’ equity and cash flows for each of the three years in the period ended December 31, 2024,
and the related notes to the consolidated financial statements (collectively, the financial statements). In our opinion, the financial
statements present fairly, in all material respects, the financial position of the Company as of December 31, 2024 and 2023, and the results
of its operations and its cash flows for each of the three years in the period ended December 31, 2024, in conformity with accounting
principles generally accepted in the United States of America.
We have also audited, in accordance with the standards of the Public Company
Accounting Oversight Board (United States) (PCAOB), the Company’s internal control over financial reporting as of December
31, 2024, based on criteria established in Internal Control — Integrated Framework issued by the Committee of Sponsoring
Organizations of the Treadway Commission in 2013, and our report dated March 13, 2025, expressed an unqualified opinion on the effectiveness
of the Company’s internal control over financial reporting.
Basis for Opinion
These financial statements are the responsibility of the Company’s
management. Our responsibility is to express an opinion on the Company’s financial statements based on our audits. We are a public
accounting firm registered with the PCAOB and are required to be independent with respect to the Company in accordance with U.S. federal
securities laws and the applicable rules and regulations of the Securities and Exchange Commission and the PCAOB.
We conducted our audits in accordance with the standards of the PCAOB.
Those standards require that we plan and perform the audit to obtain reasonable assurance about whether the financial statements are free
of material misstatement, whether due to error or fraud. Our audits included performing procedures to assess the risks of material misstatement
of the financial statements, whether due to error or fraud, and performing procedures that respond to those risks. Such procedures included
examining, on a test basis, evidence regarding the amounts and disclosures in the financial statements. Our audits also included evaluating
the accounting principles used and significant estimates made by management, as well as evaluating the overall presentation of the financial
statements. We believe that our audits provide a reasonable basis for our opinion.
Critical Audit Matters
The critical audit matter communicated below is a matter arising from
the current period audit of the financial statements that was communicated or required to be communicated to the audit committee and that:
(1) relates to accounts or disclosures that are material to the financial statements and (2) involved our especially challenging, subjective
or complex judgments. The communication of critical audit matters does not alter in any way our opinion on the financial statements, taken
as a whole, and we are not, by communicating the critical audit matter below, providing separate opinions on the critical audit matter
or on the accounts or disclosures to which it relates.
Long-lived asset impairment
As described in Note 1 to the financial statements, the Company assesses
the impairment of long-lived assets when events or changes in circumstances indicate that the fair value of assets could be less than
their carrying value. In such event, the Company assesses long-lived assets for impairment by first determining the forecasted, undiscounted
cash flows the asset group is expected to generate plus the net proceeds expected from the sale of the asset group. If this amount is
less than the carrying value of the asset group, the Company will then determine the fair value of the asset group. When the estimated
fair value of the asset group is less than its carrying value, the Company recognizes an impairment expense equal to the difference between
the asset group’s carrying value and estimated fair value. The Company’s assessment resulted in an asset impairment of $24,790,000
for the year ended December 31, 2024.
We identified the evaluation of the fair value of asset groups, where
fair value was required to be determined as part of the impairment analysis, as a critical audit matter because of the significant estimates
management makes when determining fair value. This required a high degree of auditor judgment when performing audit procedures to evaluate
whether management appropriately determined fair value.
Our audit procedures related to the evaluation of fair value, where
fair value was required to be determined as part of the impairment analysis, included the following, among others:
| ● | We obtained an understanding of management’s process
and the internal controls over management’s determination of fair value and tested the operating effectiveness of the controls |
| ● | We
obtained management’s determination of fair value and evaluated management’s
determination by: |
| o | Comparing
it to publicly available information related to sales of comparable asset groups sold by
the Company and others in the industry |
| o | Comparing
the sales price per nameplate production gallons to the carrying value of the asset group |
| /s/ RSM US LLP |
|
| |
|
| We have served as the Company’s auditor since 2015. |
| |
|
| Rochester, Minnesota |
|
| March 13, 2025 |
|
REPORT OF INDEPENDENT REGISTERED PUBLIC ACCOUNTING
FIRM
To the Stockholders and the Board of Directors
of Alto Ingredients, Inc.
Opinion on the Internal Control Over Financial Reporting
We have audited Alto Ingredients, Inc.’s (the Company) internal
control over financial reporting as of December 31, 2024, based on criteria established in Internal Control — Integrated Framework
issued by the Committee of Sponsoring Organizations of the Treadway Commission in 2013. In our opinion, the Company maintained, in
all material respects, effective internal control over financial reporting as of December 31, 2024, based on criteria established in
Internal Control — Integrated Framework issued by the Committee of Sponsoring Organizations of the Treadway Commission in
2013.
We have also audited, in accordance with the standards of the Public
Company Accounting Oversight Board (United States) (PCAOB), the consolidated balance sheets as of December 31, 2024 and 2023, the related
consolidated statements of operations, comprehensive income (loss), stockholders’ equity, and cash flows for each of the three
years in the period ended December 31, 2024, and the related notes to the consolidated financial statements of the Company and our report
dated March 13, 2025, expressed an unqualified opinion.
Basis for Opinion
The Company’s management is responsible for maintaining effective
internal control over financial reporting and for its assessment of the effectiveness of internal control over financial reporting in
the accompanying Management’s Report on Internal Control over Financial Reporting. Our responsibility is to express an opinion
on the Company’s internal control over financial reporting based on our audit. We are a public accounting firm registered with
the PCAOB and are required to be independent with respect to the Company in accordance with U.S. federal securities laws and the applicable
rules and regulations of the Securities and Exchange Commission and the PCAOB.
We conducted our audit in accordance with the standards of the PCAOB.
Those standards require that we plan and perform the audit to obtain reasonable assurance about whether effective internal control over
financial reporting was maintained in all material respects. Our audit included obtaining an understanding of internal control over financial
reporting, assessing the risk that a material weakness exists, and testing and evaluating the design and operating effectiveness of internal
control based on the assessed risk. Our audit also included performing such other procedures as we considered necessary in the circumstances.
We believe that our audit provides a reasonable basis for our opinion.
Definition and Limitations of Internal Control Over Financial
Reporting
A company’s internal control over financial reporting is a process
designed to provide reasonable assurance regarding the reliability of financial reporting and the preparation of financial statements
for external purposes in accordance with generally accepted accounting principles. A company’s internal control over financial reporting
includes those policies and procedures that (1) pertain to the maintenance of records that, in reasonable detail, accurately and fairly
reflect the transactions and dispositions of the assets of the company; (2) provide reasonable assurance that transactions are recorded
as necessary to permit preparation of financial statements in accordance with generally accepted accounting principles, and that receipts
and expenditures of the company are being made only in accordance with authorizations of management and directors of the company; and
(3) provide reasonable assurance regarding prevention or timely detection of unauthorized acquisition, use or disposition of the company’s
assets that could have a material effect on the financial statements.
Because of its inherent limitations, internal control over financial
reporting may not prevent or detect misstatements. Also, projections of any evaluation of effectiveness to future periods are subject
to the risk that controls may become inadequate because of changes in conditions, or that the degree of compliance with the policies
or procedures may deteriorate.
| /s/ RSM US LLP | |
| | |
| Rochester, Minnesota | |
| March 13, 2025 | |
ALTO INGREDIENTS, INC.
CONSOLIDATED BALANCE SHEETS
(in thousands, except shares and par value)
| | |
December 31, | |
| | |
2024 | | |
2023 | |
| ASSETS | |
| | |
| |
| | |
| | |
| |
| Current Assets: | |
| | |
| |
| Cash and cash equivalents | |
$ | 35,469 | | |
$ | 30,014 | |
| Restricted cash | |
| 742 | | |
| 15,466 | |
| Accounts receivable, net of allowance for credit losses of $23 and $85, respectively | |
| 58,217 | | |
| 58,729 | |
| Inventories | |
| 49,914 | | |
| 52,611 | |
| Derivative instruments | |
| 3,313 | | |
| 2,412 | |
| Other current assets | |
| 5,463 | | |
| 9,538 | |
| Total current assets | |
| 153,118 | | |
| 168,770 | |
| | |
| | | |
| | |
| Property and equipment, net | |
| 214,742 | | |
| 248,748 | |
| Other Assets: | |
| | | |
| | |
| Right of use operating lease assets, net | |
| 20,553 | | |
| 22,597 | |
| Intangible assets, net | |
| 4,509 | | |
| 8,498 | |
| Other assets | |
| 8,516 | | |
| 5,628 | |
| Total other assets | |
| 33,578 | | |
| 36,723 | |
| Total Assets | |
$ | 401,438 | | |
$ | 454,241 | |
The accompanying notes are an integral part of
these consolidated financial statements.
ALTO INGREDIENTS, INC.
CONSOLIDATED BALANCE SHEETS (CONTINUED)
(in thousands, except shares and par value)
| | |
December 31, | |
| | |
2024 | | |
2023 | |
| LIABILITIES AND STOCKHOLDERS’ EQUITY | |
| | |
| |
| | |
| | |
| |
| Current Liabilities: | |
| | |
| |
| Accounts payable | |
$ | 20,369 | | |
$ | 20,752 | |
| Accrued liabilities | |
| 24,214 | | |
| 20,205 | |
| Current portion – operating leases | |
| 4,851 | | |
| 4,333 | |
| Derivative instruments | |
| 1,177 | | |
| 13,849 | |
| Other current liabilities | |
| 7,193 | | |
| 6,149 | |
| Total current liabilities | |
| 57,804 | | |
| 65,288 | |
| | |
| | | |
| | |
| Long-term debt, net | |
| 92,904 | | |
| 82,097 | |
| Operating leases, net of current portion | |
| 16,913 | | |
| 19,029 | |
| Other liabilities | |
| 8,754 | | |
| 8,270 | |
| Total Liabilities | |
| 176,375 | | |
| 174,684 | |
| | |
| | | |
| | |
| Commitments and contingencies (Notes 1, 8, 9, 10 and 14) | |
| | | |
| | |
| | |
| | | |
| | |
| Stockholders’ Equity: | |
| | | |
| | |
| Preferred stock, $0.001 par value; 10,000,000 shares authorized: | |
| | | |
| | |
| Series A: 1,684,375 shares authorized; no shares issued and outstanding as of December 31, 2024 and 2023 | |
| — | | |
| — | |
| Series B: 1,580,790 shares authorized; 926,942 shares issued and outstanding as of December 31, 2024 and 2023; liquidation preference of $18,075 as of December 31, 2024 | |
| 1 | | |
| 1 | |
| Common stock, $0.001 par value; 300,000,000 shares authorized; 76,565,072 and 75,703,100 shares issued and outstanding as of December 31, 2024 and 2023, respectively | |
| 77 | | |
| 76 | |
| Non-voting common stock, $0.001 par value; 3,553,000 shares authorized; 896 shares issued and outstanding as of December 31, 2024 and 2023 | |
| — | | |
| — | |
| Additional paid-in capital | |
| 1,044,176 | | |
| 1,040,912 | |
| Accumulated other comprehensive income | |
| 4,975 | | |
| 2,481 | |
| Accumulated deficit | |
| (824,166 | ) | |
| (763,913 | ) |
| Total stockholders’ equity | |
| 225,063 | | |
| 279,557 | |
| Total Liabilities and Stockholders’ Equity | |
$ | 401,438 | | |
$ | 454,241 | |
The accompanying notes are an integral part of
these consolidated financial statements.
ALTO INGREDIENTS, INC.
CONSOLIDATED STATEMENTS OF OPERATIONS
(in thousands, except per share data)
| | |
Years Ended December 31, | |
| | |
2024 | | |
2023 | | |
2022 | |
| Net sales | |
$ | 965,258 | | |
$ | 1,222,940 | | |
$ | 1,335,621 | |
| Cost of goods sold | |
| 955,536 | | |
| 1,207,287 | | |
| 1,363,171 | |
| Gross profit (loss) | |
| 9,722 | | |
| 15,653 | | |
| (27,550 | ) |
| Selling, general and administrative expenses | |
| (29,736 | ) | |
| (29,864 | ) | |
| (28,079 | ) |
| Acquisition-related expenses | |
| (7,701 | ) | |
| (2,800 | ) | |
| (3,500 | ) |
| Gain (loss) on sale or disposal of assets | |
| 830 | | |
| (293 | ) | |
| (2,230 | ) |
| Asset impairments | |
| (24,790 | ) | |
| (6,544 | ) | |
| — | |
| Loss from operations | |
| (51,675 | ) | |
| (23,848 | ) | |
| (61,359 | ) |
| Income from cash grant | |
| — | | |
| 2,812 | | |
| 22,652 | |
| Interest expense, net | |
| (7,644 | ) | |
| (7,425 | ) | |
| (1,827 | ) |
| Other income, net | |
| 508 | | |
| 553 | | |
| 862 | |
| Loss before provision for income taxes | |
| (58,811 | ) | |
| (27,908 | ) | |
| (39,672 | ) |
| Provision for income taxes | |
| 173 | | |
| 97 | | |
| 1,925 | |
| Consolidated net loss | |
$ | (58,984 | ) | |
$ | (28,005 | ) | |
$ | (41,597 | ) |
| Preferred stock dividends | |
$ | (1,269 | ) | |
$ | (1,265 | ) | |
$ | (1,265 | ) |
| Loss attributable to common stockholders | |
$ | (60,253 | ) | |
$ | (29,270 | ) | |
$ | (42,862 | ) |
| Loss per share, basic and diluted | |
$ | (0.82 | ) | |
$ | (0.40 | ) | |
$ | (0.60 | ) |
| Weighted-average shares outstanding, basic and diluted | |
| 73,482 | | |
| 73,339 | | |
| 71,944 | |
The accompanying notes are an integral part of
these consolidated financial statements.
ALTO INGREDIENTS, INC.
CONSOLIDATED STATEMENTS OF COMPREHENSIVE INCOME (LOSS)
(in thousands)
| | |
Years Ended December 31, | |
| | |
2024 | | |
2023 | | |
2022 | |
| Consolidated net loss | |
$ | (58,984 | ) | |
$ | (28,005 | ) | |
$ | (41,597 | ) |
| Other comprehensive income– net gain arising during the period on defined benefit pension plans | |
| 2,494 | | |
| 659 | | |
| 2,106 | |
| Total comprehensive loss | |
$ | (56,490 | ) | |
$ | (27,346 | ) | |
$ | (39,491 | ) |
The accompanying notes are an integral part of
these consolidated financial statements.
ALTO INGREDIENTS, INC.
CONSOLIDATED STATEMENTS OF STOCKHOLDERS’ EQUITY
(in thousands)
| | |
| | |
| | |
Common Stock and | | |
Additional | | |
| | |
Accum. Other | | |
| |
| | |
Preferred Stock | | |
Non-Voting Common | | |
Paid-In | | |
Accumulated | | |
Comprehensive | | |
| |
| | |
Shares | | |
Amount | | |
Shares | | |
Amount | | |
Capital | | |
Deficit | | |
Income (Loss) | | |
Total | |
| Balances, December 31, 2021 | |
| 927 | | |
$ | 1 | | |
| 72,778 | | |
$ | 73 | | |
$ | 1,037,205 | | |
$ | (691,781 | ) | |
$ | (284 | ) | |
$ | 345,214 | |
| Stock-based compensation | |
| — | | |
| — | | |
| — | | |
| — | | |
| 3,333 | | |
| — | | |
| — | | |
| 3,333 | |
| Restricted stock issued to employees and directors, net of cancellations and tax | |
| — | | |
| — | | |
| 496 | | |
| — | | |
| (2,291 | ) | |
| — | | |
| — | | |
| (2,291 | ) |
| Shares issued for Eagle | |
| — | | |
| — | | |
| 949 | | |
| 1 | | |
| — | | |
| — | | |
| — | | |
| 1 | |
| Shares issued to Orion | |
| — | | |
| — | | |
| 1,282 | | |
| 1 | | |
| 3,912 | | |
| — | | |
| — | | |
| 3,913 | |
| Stock repurchases | |
| — | | |
| — | | |
| (351 | ) | |
| — | | |
| (1,325 | ) | |
| — | | |
| — | | |
| (1,325 | ) |
| Pension plan adjustment | |
| — | | |
| — | | |
| — | | |
| — | | |
| — | | |
| — | | |
| 2,106 | | |
| 2,106 | |
| Preferred stock dividends | |
| — | | |
| — | | |
| — | | |
| — | | |
| — | | |
| (1,265 | ) | |
| — | | |
| (1,265 | ) |
| Net loss | |
| — | | |
| — | | |
| — | | |
| — | | |
| — | | |
| (41,597 | ) | |
| — | | |
| (41,597 | ) |
| Balances, December 31, 2022 | |
| 927 | | |
$ | 1 | | |
| 75,154 | | |
$ | 75 | | |
$ | 1,040,834 | | |
$ | (734,643 | ) | |
$ | 1,822 | | |
$ | 308,089 | |
| Stock-based compensation | |
| — | | |
| — | | |
| — | | |
| — | | |
| 3,896 | | |
| — | | |
| — | | |
| 3,896 | |
| Restricted stock issued to employees and directors, net of cancellations and tax | |
| — | | |
| — | | |
| 2,234 | | |
| 2 | | |
| (145 | ) | |
| — | | |
| — | | |
| (143 | ) |
| Stock repurchases | |
| — | | |
| — | | |
| (1,685 | ) | |
| (1 | ) | |
| (3,673 | ) | |
| — | | |
| — | | |
| (3,674 | ) |
| Pension plan adjustment | |
| — | | |
| — | | |
| — | | |
| — | | |
| — | | |
| — | | |
| 659 | | |
| 659 | |
| Preferred stock dividends | |
| — | | |
| — | | |
| — | | |
| — | | |
| — | | |
| (1,265 | ) | |
| — | | |
| (1,265 | ) |
| Net loss | |
| — | | |
| — | | |
| — | | |
| — | | |
| — | | |
| (28,005 | ) | |
| — | | |
| (28,005 | ) |
| Balances, December 31, 2023 | |
| 927 | | |
$ | 1 | | |
| 75,703 | | |
$ | 76 | | |
$ | 1,040,912 | | |
$ | (763,913 | ) | |
$ | 2,481 | | |
$ | 279,557 | |
| Stock-based compensation | |
| — | | |
| — | | |
| — | | |
| — | | |
| 4,357 | | |
| — | | |
| — | | |
| 4,357 | |
| Restricted stock issued to employees and directors, net of cancellations and tax | |
| — | | |
| — | | |
| 862 | | |
| 1 | | |
| (1,093 | ) | |
| — | | |
| — | | |
| (1,092 | ) |
| Pension plan adjustment | |
| — | | |
| — | | |
| — | | |
| — | | |
| — | | |
| — | | |
| 2,494 | | |
| 2,494 | |
| Preferred stock dividends | |
| — | | |
| — | | |
| — | | |
| — | | |
| — | | |
| (1,269 | ) | |
| — | | |
| (1,269 | ) |
| Net loss | |
| — | | |
| — | | |
| — | | |
| — | | |
| — | | |
| (58,984 | ) | |
| — | | |
| (58,984 | ) |
| Balances, December 31, 2024 | |
| 927 | | |
$ | 1 | | |
| 76,565 | | |
$ | 77 | | |
$ | 1,044,176 | | |
$ | (824,166 | ) | |
$ | 4,975 | | |
$ | 225,063 | |
The accompanying notes are an integral part of
these consolidated financial statements.
ALTO INGREDIENTS, INC.
CONSOLIDATED STATEMENTS OF CASH FLOWS
(in thousands)
| | |
For the
Years Ended December 31, | |
| | |
2024 | | |
2023 | | |
2022 | |
| Operating Activities: | |
| | |
| | |
| |
| Consolidated net loss | |
$ | (58,984 | ) | |
$ | (28,005 | ) | |
$ | (41,597 | ) |
| Adjustments to reconcile consolidated net loss to cash (used in) provided by operating activities: | |
| | | |
| | | |
| | |
| Depreciation and amortization of intangibles | |
| 24,408 | | |
| 23,080 | | |
| 25,095 | |
| Asset impairments | |
| 24,790 | | |
| 6,544 | | |
| — | |
| (Gain) loss on sale or disposal of assets | |
| (830 | ) | |
| 293 | | |
| 2,230 | |
| Inventory valuation | |
| 2,050 | | |
| 2,201 | | |
| 4,612 | |
| Losses (gains) on derivative instruments | |
| (11,045 | ) | |
| 8,031 | | |
| (19,263 | ) |
| Amortization of deferred financing costs | |
| 1,016 | | |
| 1,048 | | |
| 177 | |
| Amortization of debt discounts | |
| 804 | | |
| 801 | | |
| 126 | |
| Stock-based compensation | |
| 4,357 | | |
| 3,896 | | |
| 3,333 | |
| Bad debt (recovery) expense | |
| (50 | ) | |
| 427 | | |
| (217 | ) |
| Changes in operating assets and liabilities: | |
| | | |
| | | |
| | |
| Accounts receivable | |
| 562 | | |
| 9,499 | | |
| 23,967 | |
| Inventories | |
| 4,484 | | |
| 11,816 | | |
| (15,479 | ) |
| Other current assets | |
| 931 | | |
| 310 | | |
| 7,690 | |
| Operating leases | |
| (5,965 | ) | |
| (5,362 | ) | |
| (5,128 | ) |
| Accounts payable and accrued expenses | |
| 9,951 | | |
| (12,554 | ) | |
| 20,503 | |
| Net cash (used in) provided by operating activities | |
$ | (3,521 | ) | |
$ | 22,025 | | |
$ | 6,049 | |
| Investing Activities: | |
| | | |
| | | |
| | |
| Additions to property and equipment | |
$ | (11,066 | ) | |
$ | (29,531 | ) | |
$ | (37,744 | ) |
| Deferred purchase price payments for Eagle Alcohol | |
| (2,800 | ) | |
| (3,500 | ) | |
| — | |
| Proceeds from sale of assets | |
| 400 | | |
| — | | |
| — | |
| Purchase of Eagle Alcohol, net of cash acquired | |
| — | | |
| — | | |
| (14,685 | ) |
| Proceeds from principal payments on notes receivable | |
| — | | |
| — | | |
| 14,766 | |
| Net cash used in investing activities | |
$ | (13,466 | ) | |
$ | (33,031 | ) | |
$ | (37,663 | ) |
| Financing Activities: | |
| | | |
| | | |
| | |
| Net proceeds from (payments on) Kinergy’s line of credit | |
$ | 8,987 | | |
$ | 12,614 | | |
$ | (32,325 | ) |
| Net proceeds from term loan | |
| — | | |
| — | | |
| 59,100 | |
| Stock repurchases | |
| — | | |
| (3,674 | ) | |
| (1,325 | ) |
| Debt issuance costs | |
| — | | |
| (714 | ) | |
| (5,171 | ) |
| Preferred stock dividend payments | |
| (1,269 | ) | |
| (1,265 | ) | |
| (1,265 | ) |
| Net cash provided by financing activities | |
$ | 7,718 | | |
$ | 6,961 | | |
$ | 19,014 | |
| Net decrease in cash, cash equivalents and restricted cash | |
| (9,269 | ) | |
| (4,045 | ) | |
| (12,600 | ) |
| Cash, cash equivalents and restricted cash at beginning of period | |
| 45,480 | | |
| 49,525 | | |
| 62,125 | |
| Cash, cash equivalents and restricted cash at end of period | |
$ | 36,211 | | |
$ | 45,480 | | |
$ | 49,525 | |
| |
|
|
|
|
|
|
|
|
|
|
|
|
| Reconciliation of total cash, cash
equivalents and restricted cash: |
|
|
|
|
|
|
|
|
|
|
|
|
|
Cash and cash equivalents | |
$ |
35,469 |
|
|
$ |
30,014 |
|
|
$ |
36,456 |
|
| Restricted cash |
|
|
742 |
|
|
|
15,466 |
|
|
|
13,069 |
|
| Total cash, cash equivalents and restricted cash |
|
$ |
36,211 |
|
|
$ |
45,480 |
|
|
$ |
49,525 |
|
| |
|
|
|
|
|
|
|
|
|
|
|
|
| Supplemental Information: |
|
|
|
|
|
|
|
|
|
|
|
|
| Interest paid (net of capitalized interest) |
|
$ |
8,319 |
|
|
$ |
7,923 |
|
|
$ |
2,208 |
|
| Capitalized interest |
|
$ |
2,517 |
|
|
$ |
2,454 |
|
|
$ |
720 |
|
| Income tax refunds (payments) |
|
$ |
627 |
|
|
$ |
(324 |
) |
|
$ |
(2,262 |
) |
The
accompanying notes are an integral part of these consolidated financial statements.
ALTO INGREDIENTS, INC.
NOTES TO CONSOLIDATED
FINANCIAL STATEMENTS
1. ORGANIZATION AND SIGNIFICANT ACCOUNTING POLICIES.
Organization and Business – The
consolidated financial statements include, for all periods presented, the accounts of Alto Ingredients, Inc., a Delaware corporation (“Alto
Ingredients”), and its direct and indirect wholly-owned subsidiaries (collectively, the “Company”), including Kinergy
Marketing LLC, an Oregon limited liability company (“Kinergy”), Alto Nutrients, LLC, a California limited liability company
(“Alto Nutrients”), Alto Op Co., a Delaware corporation, Alto Pekin, LLC, a Delaware limited liability company (“Alto
Pekin”) and Alto ICP, LLC, a Delaware limited liability company (“ICP”), and the Company’s production facilities
in Oregon and Idaho.
As discussed in Note 2, on January 14, 2022, the Company acquired Eagle
Alcohol Company LLC, a Missouri limited liability company (“Eagle Alcohol”). On that date, Eagle Alcohol became a wholly-owned
subsidiary of the Company. Eagle Alcohol specializes in break bulk distribution of specialty alcohols.
As discussed in Note 16, On January 1, 2025, the Company’s wholly-owned
subsidiary, Alto Carbonic, LLC (“Alto Carbonic”), acquired Kodiak Carbonic, LLC, a beverage-grade liquid CO2 processor
for $7.6 million. Alto Carbonic is co-located at the Company’s Columbia ethanol facility. The Company plans to report the results
of Alto Carbonic in the Company’s Western Production segment beginning January 1, 2025.
The Company produces and distributes renewable fuels,
essential ingredients and specialty alcohols. The Company also markets fuel-grade ethanol produced by third parties. The Company’s
production facilities in Pekin, Illinois are located in the heart of the Corn Belt. The Company’s two production facilities in Oregon
and Idaho are located in close proximity to both feed and fuel-grade ethanol customers.
The Company has a combined alcohol production capacity
of 350 million gallons per year and produces, on an annualized basis, over 1.4 million tons of essential ingredients, such as dried yeast,
corn protein meal, corn protein feed, corn germ, and distillers grains and liquid feed used in commercial animal feed and pet foods. In
addition, the Company markets and distributes fuel-grade ethanol produced by third parties.
The Company focuses on Health, Home & Beauty;
Food & Beverage; Industry & Agriculture; Essential Ingredients; and Renewable Fuels markets. Products for
the Health, Home & Beauty market include specialty alcohols used in mouthwash, cosmetics, pharmaceuticals, hand sanitizers, disinfectants
and cleaners. Products for the Food & Beverage markets include grain neutral spirits used in alcoholic beverages and vinegar as well
as corn germ used for corn oils. Products for Industry & Agriculture markets include alcohols and other products for paint applications
and fertilizers. Products for Essential Ingredients markets include dried yeast, corn protein meal, corn protein feed, corn germ, and
distillers grains and liquid feed used in commercial animal feed and pet foods. Products for Renewable Fuels markets include fuel-grade
ethanol and distillers corn oil used as a feedstock for renewable diesel and biodiesel fuels.
The Company’s production facilities, other than its Magic Valley
plant, were operating for all periods presented subject to scheduled and unscheduled downtimes to address facility repair and maintenance.
In January 2024, the Company temporarily hot-idled its Magic Valley facility to minimize losses from negative regional crush margins and
to expedite the installation of additional equipment to achieve the intended production rate, quality and consistency from the Company’s
corn oil and high protein system at the facility. The Company restarted its Magic Valley facility in July 2024 and by October 2024, the
facility consistently achieved average ethanol production rates at full capacity, the protein content yield from the plant reached 50%
or greater, and the Company was able to expand its corn oil yields. Increases in regional corn basis and declining market prices for protein
and corn oil resulted in overall margin compression, outweighing the economic benefits of these plant improvements. As a consequence,
the Company cold-idled its Magic Valley facility on December 31, 2024 to minimize financial losses. The Company continues to provide terminal
services at the plant and intends to resume operations at the facility when the economic environment in the region sustainably improves.
Basis of Presentation – The consolidated financial
statements and related notes have been prepared in accordance with accounting principles generally accepted in the United States (“GAAP”)
and include the accounts of the Company. All significant intercompany accounts and transactions have been eliminated in consolidation.
ALTO INGREDIENTS, INC.
NOTES TO CONSOLIDATED
FINANCIAL STATEMENTS
Segments – A segment is a component of an enterprise whose operating
results are regularly reviewed by the enterprise’s chief operating decision maker (“CODM”) to make decisions about resources
to be allocated to the segment and assess its performance, and for which discrete financial information is available. The Company determines
and discloses its segments in accordance with the Financial Accounting Standards Board’s (“FASB”) Accounting Standards
Codification (“ASC”) Section 280, Segment Reporting, which defines how to determine segments. The Company has adopted
the guidance issued under ASU 2023-07, Segment Reporting (Topic 280), which enhances disclosures about the Company’s segments.
The Company’s CODM is the Company’s executive committee, which is led by the Company’s Chief Executive Officer (“CEO”)
and includes its Chief Financial Officer, Chief Operating Officer, Chief Commercial Officer and Chief Legal Officer (“Executive
Committee”). The Company manages and assesses the performance of its reportable segments by its gross profit (loss). As part of the
Executive Committee’s review of segment-level performance, each member of the Executive Committee reviews the gross profit of the
Company’s reportable segments and provides expertise and analysis from their respective areas which drive the evaluation of the
performance of the Company’s reportable segments and allocation of resources to those segments. Even though the CEO has the authority
to override the other members for strategic or other reasons, key decisions are made jointly by the Executive Committee.
The Company reports financial and operating performance in three reportable
segments (1) Pekin production, which includes the entire campus in Pekin, Illinois (“Pekin Campus”), (2) marketing and distribution,
which includes marketing and merchant trading for Company-produced specialty alcohols, fuel-grade ethanol and essential ingredients, and
sales of fuel-grade ethanol sourced from third parties, and (3) Western production, which includes the Company’s two western production
facilities and, beginning in 2025, its liquid CO2 plant on an aggregated basis (“Western production”).
Cash and Cash Equivalents – The Company considers
all highly-liquid investments with an original maturity of three months or less to be cash equivalents. The Company maintains its accounts
at several financial institutions. These cash balances regularly exceed amounts insured by the Federal Deposit Insurance Corporation;
however, the Company does not believe it is exposed to any significant credit risk on these balances.
Restricted Cash – The Company’s restricted
cash comprises cash collateral balances held in derivative brokerage accounts.
Accounts Receivable and Allowance for Credit Losses –
Trade accounts receivable are presented at original invoice amount, net of the allowance for credit losses. The Company sells specialty
alcohols to large consumer product companies, sells fuel-grade ethanol to gasoline refining and distribution companies, sells essential
ingredients to animal feed customers, including distillers grains and other feed co-products to dairy operators and animal feedlots and
corn oil to poultry and renewable diesel and biodiesel customers, in each case generally without requiring collateral. Due to a limited
number of customers, the Company had significant concentrations of credit risk from sales as of December 31, 2024 and 2023, as described
below.
The carrying amount of accounts receivable is reduced by a valuation
allowance that reflects the Company’s best estimate of the amounts that will not be collected. The Company regularly reviews accounts
receivable and based on assessments of current customer creditworthiness, estimates the portion, if any, of the customer balance that
will not be collected.
Of the accounts receivable balance, approximately $44,750,000 and $51,315,000
at December 31, 2024 and 2023, respectively, were used as collateral under Kinergy’s operating line of credit. The allowance for
credit losses was $23,000 and $85,000 as of December 31, 2024 and 2023, respectively. The Company recorded a bad debt recovery of $50,000,
bad debt expense of $427,000 and a bad debt recovery of $217,000 for the years ended December 31, 2024, 2023 and 2022, respectively. The
Company does not have any off-balance sheet credit exposure related to its customers.
Concentration Risks – Credit risk represents the
accounting loss that would be recognized at the reporting date if counterparties failed completely to perform as contracted. Concentrations
of credit risk, whether on- or off-balance sheet, that arise from financial instruments exist for groups of customers or counterparties
when they have similar economic characteristics that would cause their ability to meet contractual obligations to be similarly affected
by changes in economic or other conditions described below. Financial instruments that subject the Company to credit risk consist of cash
balances maintained in excess of federal depository insurance limits and accounts receivable which have no collateral or security. The
Company has not experienced any significant losses in such accounts.
ALTO INGREDIENTS, INC.
NOTES TO CONSOLIDATED
FINANCIAL STATEMENTS
The Company sells specialty alcohols to consumer product companies
and fuel-grade ethanol to gasoline refining and distribution companies. The Company sold to customers representing 10% or more of the
Company’s total net sales, as follows.
| | |
Years Ended December 31, | |
| | |
2024 | | |
2023 | | |
2022 | |
| Customer A | |
| 11 | % | |
| 9 | % | |
| 10 | % |
| Customer B | |
| 7 | % | |
| 7 | % | |
| 10 | % |
The Company had accounts receivable due from these customers totaling
$5,187,000 and $4,302,000, representing 9% and 7% of total accounts receivable, as of December 31, 2024 and 2023, respectively.
The Company purchases corn, its largest cost component in producing
alcohols, from its suppliers. The Company purchased corn from suppliers representing 10% or more of the Company’s total corn purchases,
as follows:
| | |
Years
Ended December 31, | |
| | |
2024 | | |
2023 | | |
2022 | |
| Supplier A | |
| 16 | % | |
| 14 | % | |
| 11 | % |
| Supplier B | |
| 13 | % | |
| 12 | % | |
| 12 | % |
| Supplier C | |
| — | % | |
| — | % | |
| 15 | % |
As of December 31, 2024, approximately 44% of the Company’s employees
were covered by a collective bargaining agreement.
Inventories – Inventories consisted primarily of
bulk ethanol, specialty alcohols, corn, essential ingredients and unleaded fuel, and are valued at the lower of cost or net realizable
value, with cost determined on a first-in, first-out basis. Inventory is net of valuation adjustments of $2,050,000 and $2,201,000 as
of December 31, 2024 and 2023, respectively. Of the inventory balance, approximately $35,495,000 and $41,041,000 at December 31, 2024
and 2023, respectively, were used as collateral under Kinergy’s operating line of credit. Inventory balances consisted of the following
(in thousands):
| | |
December 31, | |
| | |
2024 | | |
2023 | |
| Finished goods | |
$ | 31,120 | | |
$ | 35,765 | |
| Work in progress | |
| 4,203 | | |
| 5,063 | |
| Raw materials | |
| 8,989 | | |
| 10,313 | |
| Other | |
| 5,602 | | |
| 1,470 | |
| Total | |
$ | 49,914 | | |
$ | 52,611 | |
Property and Equipment – Property and equipment
are stated at cost. Depreciation is computed using the straight-line method over the following estimated useful lives:
| Buildings | |
| 40 years | |
| Facilities and plant equipment | |
| 10 – 25 years | |
| Other equipment, vehicles and furniture | |
| 5 – 10 years | |
The cost of normal maintenance and repairs is charged to operations
as incurred. Significant capital expenditures that increase the life of an asset are capitalized and depreciated over the estimated remaining
useful life of the asset. The cost of property and equipment sold, or otherwise disposed of, and the related accumulated depreciation
or amortization are removed from the accounts, and any resulting gains or losses are reflected in current operations.
ALTO INGREDIENTS, INC.
NOTES TO CONSOLIDATED
FINANCIAL STATEMENTS
Intangible Assets – The Company amortizes intangible
assets with definite lives using the straight-line method over their estimated lives of 10-12 years. Additionally, the Company assesses
indefinite-lived intangible assets for impairment annually, or more frequently if circumstances indicate impairment may have occurred.
If the carrying value of an indefinite-lived intangible asset exceeds its fair value, an impairment loss is recognized in an amount equal
to that excess. If the Company determines that an impairment charge is needed, the charge will be recorded as an asset impairment in the
consolidated statements of operations.
Leases – The Company accounts for leases under
ASC Section 842, Leases (“ASC 842), whereby lessees are required to recognize the following for all leases (with the exception
of short-term leases) at the commencement date: (1) a lease liability, which is a lessee’s obligation to make lease payments arising
from a lease, measured on a discounted cash flow basis; and (2) a “right of use” asset, which is an asset that represents
the lessee’s right to use the specified asset for the lease term. See Note 9 for further information.
Derivative Instruments and Hedging Activities –
Derivative transactions, which can include exchange-traded futures contracts, options and futures positions on the New York Mercantile
Exchange or the Chicago Mercantile Exchange, are recorded on the balance sheet as assets and liabilities based on the derivative’s
fair value. Changes in the fair value of derivative contracts are recognized currently in income unless specific hedge accounting criteria
are met. If derivatives meet those criteria, and hedge accounting is elected, effective gains and losses are deferred in accumulated other
comprehensive income (loss) and later recorded together with the hedged item in consolidated income (loss). For derivatives designated
as a cash flow hedge, the Company formally documents the hedge and assesses the effectiveness with associated transactions. The Company
has designated and documented contracts for the physical delivery of commodity products to and from counterparties as normal purchases
and normal sales.
Revenue Recognition – The Company recognizes revenue
under ASC Section 606, Revenue from Contracts with Customers (“ASC 606”). The provisions of ASC 606 include a five-step
process by which an entity will determine revenue recognition, depicting the transfer of goods or services to customers in amounts reflecting
the payment to which an entity expects to be entitled in exchange for those goods or services. ASC 606 requires the Company to apply the
following steps: (1) identify the contract with the customer; (2) identify the performance obligations in the contract; (3) determine
the transaction price; (4) allocate the transaction price to the performance obligations in the contract; and (5) recognize revenue when,
or as, the Company satisfies the performance obligation.
The Company recognizes revenue primarily from sales of alcohols and
essential ingredients.
The Company has five production facilities from which it produces and
sells alcohols to its customers through Kinergy. Kinergy enters into back-to-back sales contracts with its customers under exclusive intercompany
sales agreements with each of the Company’s five production facilities. Kinergy also acts as a principal when it purchases third
party fuel-grade ethanol which it resells to its customers. Finally, for the year ended December 31, 2022, Kinergy had exclusive sales
agreements with certain third-party owned fuel-grade ethanol production facilities under which it sold the facilities’ fuel-grade
ethanol for a fee plus the costs to deliver the ethanol to Kinergy’s customers. These sales were referred to as third-party agent
sales. Revenue from these third-party agent sales was recorded on a net basis, with Kinergy recognizing its predetermined fees and any
associated delivery costs. Kinergy has terminated these contracts, and as a result, did not have any related sales for the year ended
December 31, 2024 and 2023. The Company’s balances of accounts receivable, net of allowance for credit losses, were $58,217,000,
$58,729,000 and $68,655,000, as of December 31, 2024, 2023 and 2022, respectively.
The Company has five production facilities from which it produces and
sells essential ingredients to its customers through Alto Nutrients. Alto Nutrients enters into sales contracts with essential ingredient
customers under exclusive intercompany sales agreements with each of the Company’s five production facilities.
The Company recognizes revenue from sales of alcohols and essential
ingredients at the point in time when the customer obtains control of the products, which typically occurs upon delivery depending on
the terms of the underlying contracts. In some instances, the Company enters into contracts with customers that contain multiple performance
obligations to deliver volumes of alcohols or essential ingredients over a contractual period of less than 12 months. The Company allocates
the transaction price to each performance obligation identified in the contract based on relative standalone selling prices and recognizes
the related revenue as control of each individual product is transferred to the customer in satisfaction of the corresponding performance
obligations.
ALTO INGREDIENTS, INC.
NOTES TO CONSOLIDATED
FINANCIAL STATEMENTS
When the Company is the agent, the supplier controls the products before
they are transferred to the customer because the supplier is primarily responsible for fulfilling the promise to provide the product,
has inventory risk before the product has been transferred to a customer and has discretion in establishing the price for the product.
When the Company is the principal, the Company controls the products before they are transferred to the customer because the Company is
primarily responsible for fulfilling the promise to provide the products, has inventory risk before the product has been transferred to
a customer and has discretion in establishing the price for the product.
See the tables in Note 4 for the Company’s revenue by type of
contracts.
Shipping and Handling Costs – The Company accounts
for shipping and handling costs relating to contracts with customers as costs to fulfill its promise to transfer its products. Accordingly,
the costs are classified as a component of cost of goods sold in the accompanying consolidated statements of operations.
Selling Costs – Selling costs associated with the
Company’s product sales are classified as a component of selling, general and administrative expenses in the accompanying consolidated
statements of operations.
Stock-Based Compensation – The Company accounts
for the cost of employee services received in exchange for the award of equity instruments based on the fair value of the award, determined
on the date of grant. The expense is recognized over the period during which an employee is required to provide services in exchange for
the award. The Company accounts for forfeitures as they occur. The Company recognizes stock-based compensation expense as a component
of either cost of goods sold or selling, general and administrative expenses in the consolidated statements of operations.
Goodwill – Goodwill represents the excess of cost
of an acquired entity over the net of the amounts assigned to net assets acquired and liabilities assumed. Annually, or more frequently,
if indications of impairment arise, the Company performs a review for impairment. This review includes the determination of each reporting
unit’s fair value using market multiples and discounted cash flow modeling. The estimates of future cash flows are judgments based
on management’s experience and knowledge of the Company’s operations and the industries in which the Company operates. These
estimates can be significantly affected by future changes in market conditions, the economic environment, including inflation, and capital
spending decisions of the Company’s customers. Any assessed impairments will be permanent and expensed in the period in which the
impairment is determined. If the Company determines through its assessment process that any of its goodwill requires impairment charges,
the charges will be recorded in asset impairment expenses in the consolidated statements of operations.
The Company performed its annual review of impairment of goodwill and
recognized an asset impairment loss of $6.0 million for the year ended December 31, 2023. No impairment losses for goodwill were
recognized for the year ended December 31, 2024 and 2022.
Impairment of Long-Lived Assets
– The Company assesses the impairment of long-lived assets, including property and equipment, internally developed software and
purchased intangibles subject to amortization, when events or changes in circumstances indicate that the fair value of assets could be
less than their net book value. In such event, the Company assesses long-lived assets for impairment by first determining the forecasted,
undiscounted cash flows the asset group is expected to generate plus the net proceeds expected from the sale of the asset group. If this
amount is less than the carrying value of the asset, the Company will then determine the fair value of the asset group. When the estimated
fair value of the asset group is less than its carrying value, the Company recognizes an impairment expense equal to the difference between
the asset group’s carrying value and estimated fair value. Forecasts of future cash flows are judgments based on the Company’s
experience and knowledge of its operations and the industries in which it operates. These forecasts could be significantly affected by
future changes in market conditions, the economic environment, including inflation, and purchasing decisions of the Company’s customers.
The Company’s assessment resulted in an asset impairment of $24,790,000 primarily from the cold-idling of the Company’s Magic
Valley facility due to increased regional corn basis and overall margin compression and the Company’s changes to its Eagle Alcohol
business, for the year ended December 31, 2024. The Company’s assessment resulted in an asset impairment of $574,000 related to
amendments to certain of the Company’s lease agreements, for the year ended December 31, 2023. The Company’s impairment analysis
performed during the year ended December 31, 2022 did not result in an impairment charge.
ALTO INGREDIENTS, INC.
NOTES TO CONSOLIDATED
FINANCIAL STATEMENTS
Deferred Financing Costs – Deferred financing costs
are costs incurred to obtain debt financing, including all related fees, and are amortized as interest expense over the term of the related
financing using the straight-line method, which approximates the effective interest rate method. Amortization of deferred financing costs,
included in interest expense, net, in the accompanying consolidated statements of operations, was approximately $1,016,000, $1,048,000
and $177,000 for the years ended December 31, 2024, 2023 and 2022, respectively. Unamortized deferred financing costs were approximately
$3,684,000 and $4,700,000 as of December 31, 2024 and 2023, respectively, and are recorded as a reduction of long-term debt in the consolidated
balance sheets.
Provision for Income Taxes – Income taxes are accounted
for under the asset and liability approach, where deferred tax assets and liabilities are determined based on differences between financial
reporting and tax basis of assets and liabilities and are measured using enacted tax rates and laws that are expected to be in effect
when the differences reverse. Valuation allowances are established when necessary to reduce deferred tax assets to the amounts expected
to be realized.
The Company accounts for uncertainty in income taxes using a two-step
approach to recognizing and measuring uncertain tax positions. The first step is to evaluate the tax position for recognition by determining
whether it is more likely than not that the position will be sustained on audit, including resolution of related appeals or litigation
processes, if any. The second step is to measure the tax benefit as the largest amount which is more than 50% likely of being realized
upon ultimate settlement. An uncertain tax position is considered effectively settled on completion of an examination by a taxing authority
if certain other conditions are satisfied. Should the Company incur interest and penalties relating to tax uncertainties, such amounts
would be classified as a component of interest expense, net, and other income (expense), net, respectively. Deferred tax assets and liabilities
are classified as noncurrent in the Company’s consolidated balance sheets.
The Company files a consolidated federal income tax return. This return
includes all wholly owned subsidiaries as well as the Company’s pro-rata share of taxable income from pass-through entities in which
the Company owns less than 100%. State tax returns are filed on a consolidated, combined or separate basis depending on the applicable
laws relating to the Company and its subsidiaries. The Company does not have any foreign operations.
Loss Per Share – Basic loss per share is computed
on the basis of the weighted-average number of shares of common stock outstanding during the period. Preferred dividends are deducted
from net loss attributed to Alto Ingredients, Inc. and are considered in the calculation of loss attributable to common stockholders in
computing basic loss per share. Common stock equivalents to preferred stock are considered participating securities and are also included
in this calculation when dilutive.
The following tables compute basic and diluted loss per share (in thousands,
except per share data):
| | |
Year Ended December 31, 2024 | |
| | |
Loss
Numerator | | |
Shares Denominator | | |
Per-Share Amount | |
| Consolidated net loss | |
$ | (58,984 | ) | |
| | | |
| | |
| Less: Preferred stock dividends | |
| (1,269 | ) | |
| | | |
| | |
| Basic and diluted loss per share: | |
| | | |
| | | |
| | |
| Loss attributable to common stockholders | |
$ | (60,253 | ) | |
| 73,482 | | |
$ | (0.82 | ) |
| | |
Year Ended December 31, 2023 | |
| | |
Loss
Numerator | | |
Shares Denominator | | |
Per-Share Amount | |
| Consolidated net loss | |
$ | (28,005 | ) | |
| | | |
| | |
| Less: Preferred stock dividends | |
| (1,265 | ) | |
| | | |
| | |
| Basic and diluted loss per share: | |
| | | |
| | | |
| | |
| Loss attributable to common stockholders | |
$ | (29,270 | ) | |
| 73,339 | | |
$ | (0.40 | ) |
| | |
Year Ended December 31, 2022 | |
| | |
Loss
Numerator | | |
Shares Denominator | | |
Per-Share Amount | |
| Consolidated net loss | |
$ | (41,597 | ) | |
| | | |
| | |
| Less: Preferred stock dividends | |
| (1,265 | ) | |
| | | |
| | |
| Basic and diluted loss per share: | |
| | | |
| | | |
| | |
| Loss attributable to common stockholders | |
$ | (42,862 | ) | |
| 71,944 | | |
$ | (0.60 | ) |
ALTO INGREDIENTS, INC.
NOTES TO CONSOLIDATED
FINANCIAL STATEMENTS
There were an aggregate of 981,000, 981,000 and 964,000 potentially
dilutive shares from convertible securities outstanding for the years ended December 31, 2024, 2023 and 2022, respectively. These convertible
securities were not considered in calculating diluted loss per common share for the years ended December 31, 2024, 2023 and 2022 as their
effect would be anti-dilutive. In addition, there were an aggregate of 3,188,000 weighted-average anti-dilutive shares from outstanding
out-of-the-money warrants for the year ended December 31, 2022.
Financial Instruments – The carrying values of
cash and cash equivalents, restricted cash, accounts receivable, derivative instruments, accounts payable and accrued liabilities are
reasonable estimates of their fair values because of the short maturity of these items. The Company believes the carrying value of its
long-term debt instruments are not considered materially different than fair value.
Business Combinations – Business acquisitions
are accounted for in accordance with ASC Section 805, Business Combinations. ASC 805 requires the reporting entity to identify
the acquirer, determine the acquisition date, recognize and measure the identifiable tangible and intangible assets acquired and liabilities
assumed and recognize and measure goodwill or a gain from the purchase. Assets acquired and liabilities assumed are recorded at their
fair values and the excess of the purchase price over the amounts assigned is recorded as goodwill. Adjustments to fair value assessments
are recorded to goodwill over the measurement period (not longer than twelve months).
Income from Cash Grant – For the years ended
December 31, 2023 and 2022, the Company received $2,812,000 and $22,652,000, respectively, in cash from the USDA’s Biofuel Producer
Program. The Company did not receive any cash from this program for the year ended December 31, 2024. The program was created as part
of the CARES Act of 2020, which allocated $700,000,000 to support biofuel producers who experienced market losses due to the pandemic.
The Company is not required to repay the grants. Since these funds are provided to subsidize historical losses of the Company, and are
not required to be repaid, the Company accounted for the proceeds by analogy to International Accounting Standards 20, Accounting for
Government Grants and Disclosure of Government Assistance, and reported the amount as income from cash grant in the accompanying consolidated
statements of operations.
Employment-related Benefits – Employment-related
benefits associated with pensions and postretirement health care are expensed based on actuarial analysis. The recognition of expense
is affected by estimates made by management, such as discount rates used to value certain liabilities, investment rates of return on plan
assets, increases in future wage amounts and future health care costs. Discount rates are determined based on a spot yield curve that
includes bonds with maturities that match the expected timing of benefit payments under the plan.
Share Repurchase Program – On September 12,
2022, the Company announced a share repurchase program under which it may repurchase up to $50,000,000 of its common stock with an initial
purchase authorization of $10,000,000. The Company’s lender has further limited the Company’s purchase authorization to $5,000,000.
Amounts in excess of the purchase authorization of $5,000,000 will require additional lender consent and amounts in excess of the initial
purchase authorization of $10,000,000 will require additional board and preferred stockholder authorization. The share repurchase program
does not have an expiration date, does not require the repurchase of any particular amount of shares, and may be implemented, modified,
suspended or discontinued in whole or in part at any time and without further notice. As repurchases are made, the Company will retire
the shares, resulting in a reduction of issued and outstanding shares. For the years ended December 31, 2023 and 2022, the Company repurchased
an aggregate of 1,685,000 shares and 351,000 shares for $3,674,000 and $1,325,000 in cash, respectively. No shares were repurchased during
the year ended December 31, 2024.
Nonvoting Common Stock – In 2015, the Company issued
nonvoting common stock convertible at a holder’s election into voting common stock. As of December 31, 2024, an aggregate of 3,539,236
shares of nonvoting common stock had been converted into an equal number of shares of the Company’s voting common stock. As of December
31, 2024, there were 896 shares of nonvoting common stock outstanding.
ALTO INGREDIENTS, INC.
NOTES TO CONSOLIDATED
FINANCIAL STATEMENTS
Estimates and Assumptions – The preparation of
the consolidated financial statements in conformity with GAAP requires management to make estimates and assumptions that affect the reported
amounts of assets and liabilities and disclosure of contingent assets and liabilities at the date of the financial statements and the
reported amounts of revenues and expenses during the reporting period. Significant estimates are required as part of determining net realizable
value of inventory, long-lived asset impairments, goodwill impairment, valuation allowances on deferred income taxes and the potential
outcome of future tax consequences of events recognized in the Company’s financial statements or tax returns, and the valuation
of assets acquired and liabilities assumed as a result of business combinations. Actual results and outcomes may materially differ from
management’s estimates and assumptions.
Recent Accounting Pronouncements – In November
2024, the FASB issued ASU 2024-03, Income Statement – Reporting Comprehensive Income – Expense Disaggregation Disclosures
(Subtopic 220-40), which provides for more detailed information about the types of expenses aggregated in common expense captions
in the statement of operations. ASU 2024-03 is effective for the Company for the year ended December 31, 2027, with early adoption permitted.
The Company is currently evaluating the impact of this ASU.
Subsequent Events – Management evaluates, as of
each reporting period, events or transactions that occur after the balance sheet date through the date that the financial statements are
issued for either disclosure or adjustment to the consolidated financial results. See Note 16.
2. ACQUISITION OF EAGLE ALCOHOL.
On January 14, 2022, the Company purchased 100%
of the membership interests of Eagle Alcohol. The purchase price was $14.0 million in cash plus an estimated net working capital adjustment
of $1.3 million in cash. The selling members of Eagle Alcohol were eligible to receive up to an additional $14.0 million of contingent
consideration, payable through a combination of $9.0 million in cash over the succeeding three years and an aggregate of $5.0 million
in the Company’s common stock on the fourth- and fifth-year anniversaries of the closing date, subject to the satisfaction of certain
conditions. Subsequently, the Company made organizational changes at Eagle Alcohol, and accelerated the vesting of the Company’s
common stock under the terms of the purchase agreement. With respect to these payments, the Company accrued $7.7 million and $2.8 million
in other current liabilities in the accompanying consolidated balance sheets as of December 31, 2024 and 2023, respectively, with the
expense included in acquisition-related expenses in the accompanying consolidated statements of operations for the years then ended.
Eagle Alcohol specializes in break bulk distribution of specialty alcohols.
Eagle Alcohol delivers products to customers
in the beverage, food, industrial and related-process industries via its own dedicated trucking fleet and common carriers.
As part of the Company’s original allocation of purchase price
for its acquisition of Eagle Alcohol, the Company recorded a customer relationships intangible asset of $6.5 million, a trade name intangible
asset of $0.4 million and goodwill of $6.0 million. See Note 6.
ALTO INGREDIENTS, INC.
NOTES TO CONSOLIDATED
FINANCIAL STATEMENTS
3. INTERCOMPANY AGREEMENTS.
The Company, directly or through one of its subsidiaries, has entered
into the following management and marketing agreements:
Affiliate Management Agreement – Alto Ingredients
entered into an Affiliate Management Agreement (“AMA”) with its operating subsidiaries under which Alto Ingredients agreed
to provide operational, administrative and staff support services. These services generally include, but are not limited to, administering
the subsidiaries’ compliance with their credit agreements and performing billing, collection, record keeping and other administrative
and ministerial tasks. Alto Ingredients agreed to supply all labor and personnel required to perform its services under the AMA, including
the labor and personnel required to operate and maintain the production facilities and marketing activities. These services are billed
at a predetermined amount per subsidiary each month plus out of pocket costs such as employee wages and benefits.
The AMAs had an initial term of one year and have automatic successive
one year renewal periods. Alto Ingredients may terminate the AMA, and any subsidiary may terminate the AMA, at any time by providing at
least 90 days prior notice of termination.
Alto Ingredients recorded revenues of approximately
$18,000,000, $13,200,000 and $12,403,000 related to the AMAs in place for the years ended December 31, 2024, 2023 and 2022, respectively.
These amounts have been eliminated upon consolidation.
Ethanol Marketing Agreements –
Kinergy entered into separate marketing agreements with each of the Company’s production facilities which granted Kinergy the exclusive
right to purchase, market and sell the alcohols produced at those facilities. Under the terms of the marketing agreements, within ten
days after delivering alcohol to Kinergy, an amount is paid to Kinergy equal to (i) the estimated purchase price payable by the third-party
purchaser of the alcohol, minus (ii) the estimated amount of transportation costs to be incurred, minus (iii) the estimated incentive
fee payable to Kinergy, which equals 1% of the aggregate third-party purchase price, provided that the marketing fee shall not be less
than $0.015 per gallon and not more than $0.0225 per gallon. Each of the marketing agreements had an initial term of one year and has
successive one year renewal periods at the option of the production facility.
Kinergy recorded revenues of approximately $5,407,000,
$5,431,000 and $5,746,000 related to the marketing agreements for the years ended December 31, 2024, 2023 and 2022, respectively. These
amounts have been eliminated upon consolidation.
Corn Procurement and Handling Agreements – Alto
Nutrients entered into separate corn procurement and handling agreements with each of the Company’s production facilities. Under
the terms of the corn procurement and handling agreements, each facility appointed Alto Nutrients as its exclusive agent to solicit, negotiate,
enter into and administer, on its behalf, corn supply arrangements to procure the corn necessary to operate the facility. Alto Nutrients
also provides grain handling services including, but not limited to, receiving, unloading and conveying corn into the facility’s
storage and, in the case of whole corn delivered, processing and hammering the whole corn.
Under these agreements, Alto Nutrients receives a
fee of $0.03 per bushel of corn delivered to each production facility as consideration for its procurement and handling services, payable
monthly. Each corn procurement and handling agreement had an initial term of one year and successive one year renewal periods at the option
of the individual facility. Alto Nutrients recorded revenues of approximately $2,910,000, $3,007,000 and $3,207,000 related to the corn
procurement and handling agreements for the years ended December 31, 2024, 2023 and 2022, respectively. These amounts have been eliminated
upon consolidation.
ALTO INGREDIENTS, INC.
NOTES TO CONSOLIDATED
FINANCIAL STATEMENTS
Essential Ingredients Marketing Agreements
– Alto Nutrients entered into separate marketing agreements with each of the Company’s production facilities (except for the
Company’s Magic Valley facility), which grant Alto Nutrients the exclusive right to market, purchase and sell the various essential
ingredients produced at each facility. Under the terms of the marketing agreements, within ten days after a facility delivers essential
ingredients to Alto Nutrients, the production facility is paid an amount equal to (i) the estimated purchase price payable by the third-party
purchaser of the essential ingredients, minus (ii) the estimated amount of transportation costs to be incurred, minus (iii) the estimated
amount of fees and taxes payable to governmental authorities in connection with the tonnage of the essential ingredients produced or marketed,
minus (iv) the estimated incentive fee payable to the Company, which equals (a) 5% of the aggregate third-party purchase price for wet
corn protein feed, wet distillers grains, corn condensed distillers solubles and distillers grains with solubles, or (b) 1% of the aggregate
third-party purchase price for corn protein meal, dry corn protein feed, dry distillers grains, corn germ and corn oil. Each marketing
agreement had an initial term of one year and has successive one year renewal periods at the option of the production facility.
Alto Nutrients recorded revenues of approximately
$2,516,000, $3,216,500 and $3,505,000 related to the marketing agreements for the years ended December 31, 2024, 2023 and 2022, respectively.
These amounts have been eliminated upon consolidation.
The Company reports its financial and operating
performance in three segments: (1) Pekin Campus production, which includes the production and sale of alcohols and essential ingredients
produced at the Company’s Pekin, Illinois campus, (2) marketing and distribution, which includes marketing and merchant trading
for Company-produced alcohols and essential ingredients on an aggregated basis, and sales of fuel-grade ethanol sourced from third parties,
and (3) Western production, which includes the production and sale of fuel-grade ethanol and essential ingredients, including liquid CO2,
produced at the Company’s two western production facilities and its liquid CO2 plant on an aggregated basis, none of
which are individually so significant to be considered a separately reportable segment.
The Company manages and assesses the performance
of its reportable segments by its gross profit (loss). As part of the Executive Committee’s review of segment-level performance,
each member of the Executive Committee reviews the gross profit of the Company’s reportable segments and provides expertise and
analysis from their respective areas which drive the evaluation of the performance of the Company’s reportable segments and allocation
of resources to those segments. Even though the CEO has the authority to override the other members for strategic or other reasons, key
decisions are made jointly by the Executive Committee.
Included in income (loss) before provision for income taxes are management
fees charged by Alto Ingredients to each of the segments. The Pekin Campus production segment incurred $7,200,000, $5,280,000 and $5,046,000
in management fees for the years ended December 31, 2024, 2023 and 2022, respectively. The marketing and distribution segment incurred
$5,400,000, $3,960,000 and $3,840,000 in management fees for the years ended December 31, 2024, 2023 and 2022, respectively. The Western
production segment incurred $3,600,000, $2,640,000 and $2,400,000 in management fees for the years ended December 31, 2024, 2023 and 2022,
respectively. Corporate and other includes the results of Eagle Alcohol and selling, general and administrative expenses, consisting primarily
of corporate employee compensation, professional fees and overhead costs not directly related to a specific operating segment.
During the normal course of business, the segments do business with
each other. The preponderance of this activity occurs when the Company’s marketing and distribution segment markets alcohol produced
by the production segments for a marketing fee, as discussed in Note 3. These intersegment activities are considered arms’-length
transactions. Consequently, although these transactions impact segment performance, they do not impact the Company’s consolidated
results since all revenues and corresponding costs are eliminated upon consolidation.
For the years ended December 31, 2024, 2023 and 2022, capital expenditures
incurred by the Pekin Campus segment were approximately $6.8 million, $17.7 million and $25.7 million, and capital expenditures incurred
by the Western production segment were approximately $4.3 million, $11.8 million and $12.3 million, respectively.
ALTO INGREDIENTS, INC.
NOTES TO CONSOLIDATED
FINANCIAL STATEMENTS
The following tables set forth certain financial data for the Company’s
operating segments (in thousands):
| | |
Years Ended December 31, | |
| Net Sales | |
2024 | | |
2023 | | |
2022 | |
| Pekin Campus production, recorded as gross: | |
| | |
| | |
| |
| Alcohol sales | |
$ | 415,710 | | |
$ | 502,217 | | |
$ | 521,273 | |
| Essential ingredient sales | |
| 169,308 | | |
| 217,702 | | |
| 225,871 | |
| Intersegment sales | |
| 1,243 | | |
| 1,427 | | |
| 1,212 | |
| Total Pekin Campus sales | |
| 586,261 | | |
| 721,346 | | |
| 748,356 | |
| | |
| | | |
| | | |
| | |
| Marketing and distribution: | |
| | | |
| | | |
| | |
| Alcohol sales, gross | |
$ | 216,295 | | |
$ | 262,587 | | |
$ | 227,626 | |
| Alcohol sales, net | |
| 229 | | |
| 365 | | |
| 1,225 | |
| Intersegment sales | |
| 10,833 | | |
| 11,654 | | |
| 12,459 | |
| Total marketing and distribution sales | |
| 227,357 | | |
| 274,606 | | |
| 241,310 | |
| | |
| | | |
| | | |
| | |
| Western Production, recorded as gross: | |
| | | |
| | | |
| | |
| Alcohol sales | |
$ | 115,389 | | |
$ | 166,971 | | |
$ | 253,605 | |
| Essential ingredient sales | |
| 36,953 | | |
| 57,264 | | |
| 90,209 | |
| Intersegment sales | |
| (122 | ) | |
| 134 | | |
| 22 | |
| Total Western production sales | |
| 152,220 | | |
| 224,369 | | |
| 343,836 | |
| | |
| | | |
| | | |
| | |
| Corporate and other | |
| 11,374 | | |
| 15,834 | | |
| 15,812 | |
| Intersegment eliminations | |
| (11,954 | ) | |
| (13,215 | ) | |
| (13,693 | ) |
| Net sales as reported | |
$ | 965,258 | | |
$ | 1,222,940 | | |
$ | 1,335,621 | |
| | |
| | | |
| | | |
| | |
| Cost of goods sold: | |
| | |
| | |
| |
| Pekin Campus production | |
$ | 563,033 | | |
$ | 710,088 | | |
$ | 772,755 | |
| Marketing and distribution | |
| 213,023 | | |
| 259,234 | | |
| 229,288 | |
| Western production | |
| 172,209 | | |
| 230,445 | | |
| 353,775 | |
| Corporate and other | |
| 12,285 | | |
| 12,122 | | |
| 12,167 | |
| Intersegment eliminations | |
| (5,014 | ) | |
| (4,602 | ) | |
| (4,814 | ) |
| Cost of goods sold as reported | |
$ | 955,536 | | |
$ | 1,207,287 | | |
$ | 1,363,171 | |
| | |
| | |
| | |
| |
| Gross profit (loss): | |
| | |
| | |
| |
| Pekin Campus production | |
$ | 23,228 | | |
$ | 11,258 | | |
$ | (24,399 | ) |
| Marketing and distribution | |
| 14,334 | | |
| 15,372 | | |
| 12,022 | |
| Western production | |
| (19,989 | ) | |
| (6,076 | ) | |
| (9,939 | ) |
| Corporate and other | |
| (911 | ) | |
| 3,712 | | |
| 3,645 | |
| Intersegment eliminations | |
| (6,940 | ) | |
| (8,613 | ) | |
| (8,879 | ) |
| | |
$ | 9,722 | | |
$ | 15,653 | | |
$ | (27,550 | ) |
| Income (loss) before provision for income taxes: | |
| | | |
| | | |
| | |
| Pekin Campus production | |
$ | 6,308 | | |
$ | (1,560 | ) | |
$ | (27,376 | ) |
| Marketing and distribution | |
| 5,261 | | |
| 7,644 | | |
| 3,748 | |
| Western production | |
| (51,086 | ) | |
| (13,506 | ) | |
| (7,209 | ) |
| Corporate and other | |
| (19,294 | ) | |
| (20,486 | ) | |
| (8,835 | ) |
| | |
$ | (58,811 | ) | |
$ | (27,908 | ) | |
$ | (39,672 | ) |
| Asset impairments: | |
| | | |
| | | |
| | |
| Western production | |
$ | 21,389 | | |
$ | — | | |
$ | — | |
| Corporate and other | |
| 3,401 | | |
| 6,544 | | |
| — | |
| | |
$ | 24,790 | | |
$ | 6,544 | | |
$ | — | |
| Depreciation and amortization expense: | |
| | | |
| | | |
| | |
| Pekin Campus production | |
$ | 21,017 | | |
$ | 19,789 | | |
$ | 19,136 | |
| Western production | |
| 2,409 | | |
| 2,381 | | |
| 5,085 | |
| Corporate and other | |
| 982 | | |
| 910 | | |
| 874 | |
| | |
$ | 24,408 | | |
$ | 23,080 | | |
$ | 25,095 | |
| Interest expense, net of capitalized interest: | |
| | |
| | |
| |
| Pekin Campus production | |
$ | 1,765 | | |
$ | (207 | ) | |
$ | (381 | ) |
| Marketing and distribution | |
| 389 | | |
| 822 | | |
| 1,658 | |
| Western production | |
| 2,829 | | |
| 1,164 | | |
| (339 | ) |
| Corporate and other | |
| 2,661 | | |
| 5,646 | | |
| 889 | |
| | |
$ | 7,644 | | |
$ | 7,425 | | |
$ | 1,827 | |
ALTO INGREDIENTS, INC.
NOTES TO CONSOLIDATED FINANCIAL STATEMENTS
The following table sets forth the Company’s total assets by
operating segment (in thousands):
| | |
December 31, | |
| | |
2024 | | |
2023 | |
| Total assets: | |
| | |
| |
| Pekin Campus production | |
$ | 223,934 | | |
| 251,048 | |
| Marketing and distribution | |
| 102,895 | | |
| 101,196 | |
| Western production | |
| 44,992 | | |
| 57,533 | |
| Corporate and other | |
| 29,617 | | |
| 44,464 | |
| | |
$ | 401,438 | | |
$ | 454,241 | |
5. PROPERTY AND EQUIPMENT.
Property and equipment consisted of the following (in thousands):
| | |
December 31, | |
| | |
2024 | | |
2023 | |
| Facilities and plant equipment | |
$ | 420,456 | | |
$ | 405,010 | |
| Land | |
| 3,594 | | |
| 3,687 | |
| Other equipment, vehicles and furniture | |
| 20,636 | | |
| 9,719 | |
| Construction in progress | |
| 11,154 | | |
| 50,505 | |
| | |
| 455,840 | | |
| 468,921 | |
| Accumulated depreciation | |
| (241,098 | ) | |
| (220,173 | ) |
| | |
$ | 214,742 | | |
$ | 248,748 | |
Depreciation expense was $23,820,000, $22,492,000
and $24,528,000 for the years ended December 31, 2024, 2023 and 2022, respectively. The Company capitalized interest of $2,517,000, $2,454,000
and $720,000 for the years ended December 31, 2024, 2023 and 2022, respectively, related to its capital investment activities. The Company
recorded an asset impairment of $19,000,000 for the year ended December 31, 2024. The Company did not record any impairment on its property
and equipment for the years ended December 31, 2023 and 2022.
The Company’s property and equipment are substantially
pledged as collateral under the Company’s Term Loan.
ALTO INGREDIENTS, INC.
NOTES TO CONSOLIDATED
FINANCIAL STATEMENTS
6. INTANGIBLE ASSETS.
Intangible assets, including goodwill, consisted of the following (in
thousands):
| | | | | | December 31, 2024 | | | December 31, 2023 | |
| | | Useful
Life
(Years) | | | Gross | | | Accumulated
Amortization/
Impairment | | | Net Book
Value | | | Gross | | | Accumulated
Amortization/
Impairment | | | Net Book
Value | |
| Non-Amortizing: | | | | | | | | | | | | | | | | | | | | | |
| Goodwill | | | | | | $ | 5,970 | | | $ | (5,970 | ) | | $ | — | | | $ | 5,970 | | | $ | (5,970 | ) | | $ | — | |
| Kinergy tradename | | | | | | | 2,678 | | | | — | | | | 2,678 | | | | 2,678 | | | | — | | | | 2,678 | |
| Amortizing: | | | | | | | | | | | | | | | | | | | | | | | | | | | | |
| Customer relationships | | | 12 | | | | 6,556 | | | | (5,021 | ) | | | 1,535 | | | | 6,556 | | | | (1,074 | ) | | | 5,482 | |
| Eagle Alcohol tradename | | | 10 | | | | 420 | | | | (124 | ) | | | 296 | | | | 420 | | | | (82 | ) | | | 338 | |
| Total goodwill and intangible assets | | | | | | $ | 15,624 | | | $ | (11,115 | ) | | $ | 4,509 | | | $ | 15,624 | | | $ | (7,126 | ) | | $ | 8,498 | |
Goodwill – The Company recorded goodwill of $5,970,000
in its Corporate and other segment resulted from the Company’s acquisition of Eagle Alcohol. As part of the Company’s annual
goodwill testing, it impaired the full amount of goodwill of $5,970,000 and recognized the amount in asset impairments in the consolidated
statements of operations for the year ended December 31, 2023. The Company did not record any goodwill impairment for the years ended
December 31, 2024 and 2022.
Kinergy Tradename – The Company recorded tradename
of $2,678,000 as part of the Company’s merger with Kinergy in 2006. The Company determined that the tradename has an indefinite
life and therefore, rather than being amortized, will be tested annually for impairment. The Company did not record any impairment on
its tradename for the years ended December 31, 2024, 2023 and 2022.
Customer Relationships – The Company recorded customer
relationships of $6,556,000 from the Company’s acquisition of Eagle Alcohol. As part of the Company’s impairment testing,
it impaired this intangible asset by $3,401,000 and recognized the amount in asset impairments in the consolidated statement of operations
for the year ended December 31, 2024. The Company did not record any asset impairment on its customer relationships for the years ended
December 31, 2023 and 2022.
Eagle Alcohol Tradename – The Company recorded
tradename of $420,000 from the Company’s acquisition of Eagle Alcohol. The Company did not record any tradename impairment for the
years ended December 31, 2024, 2023 and 2022.
Amortization expense associated with intangible assets totaled $588,000,
$588,000 and $567,000 for the years ended December 31, 2024, 2023 and 2022. The weighted-average unamortized life of the customer
relationships and tradename is 8.7 years.
The expected amortization expense relating to amortizable intangible
assets in each of the five years after December 31, 2024 are (in thousands):
| Years Ended December 31, | |
Amount | |
| 2025 | |
$ | 213 | |
| 2026 | |
| 213 | |
| 2027 | |
| 213 | |
| 2028 | |
| 213 | |
| 2029 | |
| 213 | |
| Thereafter | |
| 766 | |
| Total | |
$ | 1,831 | |
ALTO INGREDIENTS, INC.
NOTES TO CONSOLIDATED FINANCIAL STATEMENTS
7. DERIVATIVES.
The business and activities of the Company expose it to a variety of
market risks, including risks related to changes in commodity prices. The Company monitors and manages these financial exposures as an
integral part of its risk management program. This program recognizes the unpredictability of financial markets and seeks to reduce the
potentially adverse effects that market volatility could have on operating results.
Commodity Risk – Cash Flow Hedges
– The Company uses derivative instruments to protect cash flows from fluctuations caused by volatility in commodity prices for periods
of up to twelve months in order to protect gross profit margins from potentially adverse effects of market and price volatility on alcohol
sales and purchase commitments where the prices are set at a future date and/or if the contracts specify a floating or index-based price.
In addition, the Company hedges anticipated sales of alcohol to minimize its exposure to the potentially adverse effects of price volatility.
These derivatives may be designated and documented as cash flow hedges and effectiveness is evaluated by assessing the probability of
the anticipated transactions and regressing commodity futures prices against the Company’s purchase and sales prices. Ineffectiveness,
which is defined as the degree to which the derivative does not offset the underlying exposure, is recognized immediately in cost of goods
sold. For the years ended December 31, 2024, 2023 and 2022, the Company did not designate any of its derivatives as cash flow hedges.
Commodity Risk – Non-Designated Hedges –
The Company uses derivative instruments to lock in prices for certain amounts of corn and alcohols by entering into exchange-traded futures
contracts or options for those commodities. These derivatives are not designated for hedge accounting treatment. The changes in fair value
of these contracts are recorded on the balance sheet and recognized immediately in cost of goods sold. The Company recognized net gains
of $11,045,000, net losses of $8,031,000 and net gains of $19,263,000 as the change in the fair value of these contracts for the years
ended December 31, 2024, 2023 and 2022, respectively.
Non-Designated Derivative Instruments – The classification
and amounts of the Company’s derivatives not designated as hedging instruments, and related cash collateral balances, are as follows
(in thousands):
| | |
As of December 31, 2024 |
| | |
Assets | |
Liabilities |
| Type of Instrument | |
Balance Sheet Location | |
Fair Value | | |
Balance Sheet Location | |
Fair Value | |
| | |
| |
| | |
| |
| |
| Cash collateral balance | |
Restricted cash | |
$ | 742 | | |
| |
| | |
| Commodity contracts | |
Derivative instruments | |
$ | 3,313 | | |
Derivative instruments | |
$ | 1,177 | |
| | |
As of December 31, 2024 |
| | |
Assets | |
Liabilities |
| Type of Instrument | |
Balance Sheet Location | |
Fair Value | | |
Balance Sheet Location | |
Fair Value | |
| | |
| |
| | |
| |
| |
| Cash collateral balance | |
Restricted cash | |
$ | 15,466 | | |
| |
| | |
| Commodity contracts | |
Derivative instruments | |
$ | 2,412 | | |
Derivative instruments | |
$ | 13,849 | |
The above amounts represent the gross balances of the contracts; however,
the Company does have a right of offset with each of its derivative brokers, but the Company’s intent is to close out positions
individually, therefore the positions are reported at gross.
ALTO INGREDIENTS, INC.
NOTES TO CONSOLIDATED FINANCIAL STATEMENTS
The classification and amounts of the Company’s recognized gains
(losses) for its derivatives not designated as hedging instruments are as follows (in thousands):
| | |
| |
Realized Gains (Losses) | |
| | |
| |
For the Years Ended December 31, | |
| Type of Instrument | |
Statements of Operations Location | |
2024 | | |
2023 | | |
2022 | |
| | |
| |
| | |
| | |
| |
| Commodity contracts | |
Cost of goods sold | |
$ | (2,529 | ) | |
$ | 1,647 | | |
$ | 23,280 | |
| | |
| |
$ | (2,529 | ) | |
$ | 1,647 | | |
$ | 23,280 | |
| | |
| |
Unrealized Gains (Losses) | |
| | |
| |
For the Years Ended December 31, | |
| Type of Instrument | |
Statements of Operations Location | |
2024 | | |
2023 | | |
2022 | |
| | |
| |
| | |
| | |
| |
| Commodity contracts | |
Cost of goods sold | |
$ | 13,574 | | |
$ | (9,678 | ) | |
$ | (4,017 | ) |
| | |
| |
$ | 13,574 | | |
$ | (9,678 | ) | |
$ | (4,017 | ) |
8. DEBT.
Long-term borrowings are summarized as follows (in thousands):
| | |
December 31,
2024 | | |
December 31,
2023 | |
| Kinergy line of credit | |
$ | 39,677 | | |
$ | 30,690 | |
| Orion term loan | |
| 60,000 | | |
| 60,000 | |
| | |
| 99,677 | | |
| 90,690 | |
| Less unamortized debt discount | |
| (3,089 | ) | |
| (3,893 | ) |
| Less unamortized debt financing costs | |
| (3,684 | ) | |
| (4,700 | ) |
| Less current portion | |
| — | | |
| — | |
| Long-term debt | |
$ | 92,904 | | |
$ | 82,097 | |
Kinergy Line of Credit – Kinergy
has an operating line of credit for an aggregate amount of up to $100,000,000. The line of credit matures on November 7, 2027. The credit
facility is based on Kinergy’s eligible accounts receivable and inventory levels, subject to certain concentration reserves. The
credit facility is subject to certain other sublimits, including inventory loan limits. Interest accrues under the line of credit at a
rate equal to (i) the daily Secured Overnight Financing Rate, plus (ii) a specified applicable margin ranging between 1.25% and 1.75%.
The applicable margin was 1.50%, for a total rate of 6.06%, at December 31, 2024. The credit facility’s monthly unused line fee
is an annual rate equal to 0.25% to 0.375% depending on the average daily principal balance during the immediately preceding month. Payments
that may be made by Kinergy to the Company as reimbursement for management and other services provided by the Company to Kinergy are limited
under the terms of the credit facility to $1,500,000 per fiscal quarter. The credit facility also includes the accounts receivable of
Alto Nutrients as additional collateral. Payments that may be made by Alto Nutrients to the Company as reimbursement for management and
other services provided by the Company to Alto Nutrients are limited under the terms of the credit facility to $500,000 per fiscal quarter.
Kinergy and Alto Nutrients may also make distributions to the Company of up to 75% of their excess cash flow.
If the monthly excess borrowing availability of Kinergy and Alto Nutrients
falls below certain thresholds, they are collectively required to maintain a fixed-charge coverage ratio (calculated as a twelve-month
rolling earnings before interest, taxes, depreciation and amortization divided by the sum of interest expense, capital expenditures, principal
payments of indebtedness, indebtedness from capital leases and taxes paid during such twelve-month rolling period) of at least 1.1 and
are prohibited from incurring certain additional indebtedness (other than specific intercompany indebtedness).
ALTO INGREDIENTS, INC.
NOTES TO CONSOLIDATED FINANCIAL STATEMENTS
The obligations of Kinergy and Alto Nutrients under
the credit facility are secured by first-priority security interests in all of their assets in favor of the lender. Alto Ingredients has
guaranteed all of Kinergy’s obligations under the line of credit. As of December 31, 2024, Kinergy had $23.1 million in unused borrowing
availability under the credit facility.
Orion Term Loan – On November 7, 2022, the Company
entered into a credit agreement with certain funds managed by Orion Infrastructure Capital (collectively, the “Lenders”),
and OIC Investment Agent, LLC, as administrative agent and collateral agent (“OIC”), under which the Lenders agreed to extend
a senior secured credit facility in the amount of up to $125,000,000 (the “Term Loan”). The Term Loan is secured by a first
priority lien on certain assets of the Company and a second priority lien on certain assets of Kinergy and Alto Nutrients.
The Lenders agreed to advance to the Company up to $100,000,000, with
up to $25,000,000 more upon the satisfaction of certain additional conditions. The Company also agreed to issue to the Lenders upon its
first funding request, an aggregate of 1,282,051 shares of the Company’s common stock, and up to an additional 320,513 shares of
the Company’s common stock upon additional funding or fundings.
On November 23, 2022, the Company received its initial funding of $60,000,000
and issued 1,282,051 shares of common stock. As of December 31, 2024, 2023 and 2022, the principal amount outstanding under the Term Loan
was $60,000,000. The Company allocated $3,912,000 of the loan proceeds to additional paid-in capital for the common stock issued based
on the relative fair values of the debt and equity instruments and recorded a corresponding amount as a debt issuance discount that will
be amortized to interest expense over the term of the loan.
As of December 31, 2024, interest accrued on the unpaid principal amount
of the Term Loan at a fixed rate of 10% per annum. On January 1, 2025, the annual fixed rate of interest on the Term Loan increased to
10.75% in connection with the Company’s amendment of various terms under the Term Loan. The Term Loan matures on November 7, 2028,
or earlier upon acceleration.
The Company must prepay amounts outstanding under the Term Loan on
a semi-annual basis beginning with the six-month period ended December 31, 2023 in an amount equal to a percentage of the Company’s
excess cash flow based on a specified leverage ratio, as follows: (i) if the leverage ratio is greater than or equal to 3.0x, then the
mandatory prepayment amount will equal 100% of the Company’s excess cash flow, (ii) if the leverage ratio is less than 3.0x and
greater than or equal to 1.5x, then the mandatory prepayment amount will equal 50% of the Company’s excess cash flow and (iii) if
the leverage ratio is less than 1.5x, then the mandatory prepayment amount will equal 25% of the Company’s excess cash flow.
The terms and conditions of the Term Loan also contain customary and
other representations, warranties, covenants and obligations, including events of default, and other terms and conditions.
Registration Rights Agreement - On November 7, 2022,
the Company entered into a registration rights agreement with the Lenders and agreed to register for resale with the Securities and Exchange
Commission the shares of common stock issued to the Lenders under the Term Loan. The related registration statement has been declared
effective by the Securities and Exchange Commission.
Maturities of Long-term Debt – The Company’s
long-term debt matures as follows (in thousands):
| December 31: | |
| |
| 2027 | |
$ | 39,677 | |
| 2028 | |
| 60,000 | |
| | |
$ | 99,677 | |
ALTO INGREDIENTS, INC.
NOTES TO CONSOLIDATED FINANCIAL STATEMENTS
9. LEASES.
The Company leases equipment and land for certain of its facilities.
Operating lease right of use assets and liabilities are recognized at commencement date based on the present value of lease payments over
the lease term. The Company uses its estimated incremental borrowing rate, unless an implicit rate is readily determinable, as the discount
rate for each lease in determining the present value of lease payments. For the years ended December 31, 2024 and 2023, the Company’s
weighted-average discount rate was approximately 7.78%. Operating lease expense is recognized on a straight-line basis over the lease
term.
Upon the adoption of ASC 842, the Company elected the following practical
expedients allowable under the guidance: not to reassess whether any expired or existing contracts are or contain leases; not to reassess
the lease classification for any expired or existing leases; not to reassess initial direct costs for any existing leases; not to separately
identify lease and non-lease components; and not to evaluate historical land easements. Additionally, the Company elected the short-term
lease exemption policy, applying the requirements of ASC 842 to only long-term (greater than 1 year) leases.
The Company determines if an arrangement is a lease or contains a lease
at inception. The Company’s leases have remaining lease terms of approximately 1 year to 51 years, which includes options to extend
the lease when it is reasonably certain the Company will exercise those options. For the year ended December 31, 2024, the weighted-average
remaining lease terms of equipment and land-related leases were 4.14 years and 16.42 years, respectively. For the year ended December
31, 2023, the weighted-average remaining lease terms of equipment and land-related leases were 4.73 years and 15.41 years, respectively.
The Company does not have lease arrangements with residual value guarantees, sale-leaseback terms or material restrictive covenants. The
Company does not have any material finance lease obligations nor sublease agreements.
Leases consist of the following (in thousands):
| | | Classification | | December 31, | |
| Assets | | | | 2024 | | | 2023 | |
| Operating | | Right of use operating lease assets, net | | $ | 20,553 | | | $ | 22,597 | |
| Liabilites | | | | | | | | | | |
| Operating - Current | | Current portion, operating leases | | $ | 4,851 | | | $ | 4,333 | |
| Operating - Noncurrent | | Operating leases, net of current portion | | $ | 16,913 | | | $ | 19,029 | |
The Components of lease costs were as follows (in thousands):
| | |
Years Ended December 31, | |
| | |
2024 | | |
2023 | | |
2022 | |
| | |
| | |
| | |
| |
| Fixed lease cost | |
$ | 5,989 | | |
$ | 5,722 | | |
$ | 5,224 | |
| Variable lease cost | |
| 529 | | |
| 871 | | |
| 124 | |
| Net lease cost | |
$ | 6,518 | | |
$ | 6,593 | | |
$ | 5,348 | |
ALTO INGREDIENTS, INC.
NOTES TO CONSOLIDATED FINANCIAL STATEMENTS
The following table summarizes the remaining maturities
of the Company’s operating lease liabilities, assuming all land lease extensions are taken, as of December 31, 2024 (in thousands):
| Year Ended: |
|
Equipment |
|
|
Land Related |
|
| 2025 |
|
$ |
5,334 |
|
|
$ |
1,060 |
|
| 2026 |
|
|
4,761 |
|
|
|
1,037 |
|
| 2027 |
|
|
4,152 |
|
|
|
1,011 |
|
| 2028 |
|
|
3,368 |
|
|
|
1,024 |
|
| 2029 |
|
|
1,992 |
|
|
|
660 |
|
| 2030-76 |
|
|
119 |
|
|
|
3,881 |
|
| Less interest |
|
|
(3,299 |
) |
|
|
(3,336 |
) |
| |
|
$ |
16,427 |
|
|
$ |
5,337 |
|
10. PENSION PLANS.
Retirement Plan - The Company sponsors
a defined benefit pension plan (the “Retirement Plan”) that is noncontributory, and covers only “grandfathered”
unionized employees at its Alto Pekin production facilities. Benefits are based on a prescribed formula based upon the employee’s
years of service. Employees hired after November 1, 2010, are not eligible to participate in the Retirement Plan. The Company uses a December
31st measurement date for its Retirement Plan. The Company’s funding policy is to make the minimum annual contribution
required by applicable regulations.
Information related to the Retirement Plan as of
and for the years ended December 31, 2024 and 2023 is presented below (dollars in thousands):
| | |
2024 | | |
2023 | |
| Changes in plan assets: | |
| | |
| |
| Fair value of plan assets, beginning | |
$ | 18,485 | | |
$ | 16,688 | |
| Actual gains | |
| 1,711 | | |
| 2,376 | |
| Benefits paid | |
| (829 | ) | |
| (834 | ) |
| Company contributions | |
| 800 | | |
| 255 | |
| Participant contributions | |
| — | | |
| — | |
| Fair value of plan assets, ending | |
$ | 20,167 | | |
$ | 18,485 | |
| Less: projected accumulated benefit obligation | |
$ | 17,530 | | |
$ | 18,590 | |
| Funded status, overfunded (underfunded) | |
$ | 2,637 | | |
$ | (105 | ) |
| | |
| | | |
| | |
| Amounts recognized in the consolidated balance sheets: | |
| | | |
| | |
| Other assets | |
$ | 2,637 | | |
$ | — | |
| Other liabilities | |
$ | — | | |
$ | (105 | ) |
| Accumulated other comprehensive income | |
$ | (4,167 | ) | |
$ | (2,231 | ) |
| | |
| | | |
| | |
| Assumptions used in computation of benefit obligations: | |
| | | |
| | |
| Discount rate | |
| 5.50 | % | |
| 4.90 | % |
| Expected long-term return on plan assets | |
| 6.50 | % | |
| 6.50 | % |
| Rate of compensation increase | |
| — | | |
| — | |
| | |
Years Ended December 31, | |
| | |
2024 | | |
2023 | | |
2022 | |
| Components of net periodic benefit costs are as follows: | |
| | |
| | |
| |
| Service cost | |
$ | 267 | | |
$ | 249 | | |
$ | 404 | |
| Interest cost | |
| 887 | | |
| 900 | | |
| 655 | |
| Expected return on plan assets | |
| (1,103 | ) | |
| (993 | ) | |
| (1,090 | ) |
| Net periodic cost (benefit) | |
$ | 51 | | |
$ | 156 | | |
$ | (31 | ) |
ALTO INGREDIENTS, INC.
NOTES TO CONSOLIDATED FINANCIAL STATEMENTS
The Company does not expect to make any contributions
in the year ending December 31, 2025. Net periodic benefit for 2025 is estimated to be approximately $0.5 million.
The following table summarizes the expected benefit
payments for the Company’s Retirement Plan for each of the next five fiscal years and in the aggregate for the five fiscal years
thereafter (in thousands):
| December 31: |
|
|
|
| 2025 |
|
$ |
1,000 |
|
| 2026 |
|
|
1,040 |
|
| 2027 |
|
|
1,080 |
|
| 2028 |
|
|
1,130 |
|
| 2029 |
|
|
1,160 |
|
| 2030-34 |
|
|
6,480 |
|
| |
|
$ |
11,890 |
|
See Note 15 for discussion of the Retirement Plan’s fair value
disclosures.
Historical and future expected returns of multiple
asset classes were analyzed to develop a risk-free real rate of return and risk premiums for each asset class. The overall rate for each
asset class was developed by combining a long-term inflation component, the risk-free real rate of return, and the associated risk premium.
A weighted-average rate was developed based on those overall rates and the target asset allocation of the Retirement Plan.
The Company’s pension committee is responsible
for overseeing the investment of pension plan assets. The pension committee is responsible for determining and monitoring the appropriate
asset allocations and for selecting or replacing investment managers, trustees, and custodians. The Retirement Plan’s current investment
target allocations are 50% equities and 50% debt. The pension committee periodically reviews the actual asset allocation in light of these
targets and rebalances investments as necessary. The pension committee also evaluates the performance of investment managers as compared
to the performance of specified benchmarks and peers and monitors the investment managers to ensure adherence to their stated investment
style and to the Retirement Plan’s investment guidelines.
Postretirement Plan - The Company also
sponsors a health care plan and life insurance plan (the “Postretirement Plan”) that provides postretirement medical benefits
and life insurance to certain “grandfathered” unionized employees at its Alto Pekin production facilities. Employees hired
after December 31, 2000, are not eligible to participate in the Postretirement Plan. The plan is contributory, with contributions required
at the same rate as active employees. Benefit eligibility under the plan reduces at age 65 from a defined benefit to a defined dollar
cap based upon years of service.
Information related to the Postretirement Plan as of December 31, 2024
and 2023 is presented below (dollars in thousands):
| | |
2024 | | |
2023 | |
| Amounts at the end of the year: | |
| | |
| |
| Accumulated/projected benefit obligation | |
$ | 3,783 | | |
$ | 4,294 | |
| Fair value of plan assets | |
| — | | |
| — | |
| Funded status, underfunded | |
$ | (3,783 | ) | |
$ | (4,294 | ) |
| | |
| | | |
| | |
| Amounts recognized in the consolidated balance sheets: | |
| | | |
| | |
| Accrued liabilities | |
$ | (280 | ) | |
$ | (320 | ) |
| Other liabilities | |
$ | (3,503 | ) | |
$ | (3,974 | ) |
| Accumulated other comprehensive income | |
$ | (808 | ) | |
$ | (250 | ) |
| | |
| | | |
| | |
| Discount rate used in computation of benefit obligations | |
| 5.30 | % | |
| 4.75 | % |
ALTO INGREDIENTS, INC.
NOTES TO CONSOLIDATED FINANCIAL STATEMENTS
| | |
Years Ended December 31, | |
| | |
2024 | | |
2023 | | |
2022 | |
| Components of net periodic benefit costs are as follows: | |
| | |
| | |
| |
| Service cost | |
$ | 19 | | |
$ | 14 | | |
$ | 26 | |
| Interest cost | |
| 196 | | |
| 186 | | |
| 105 | |
| Amortization of prior service cost | |
| — | | |
| (53 | ) | |
| — | |
| Net periodic benefit cost | |
$ | 215 | | |
$ | 147 | | |
$ | 131 | |
| Amounts recognized in the plan for the year: | |
| | | |
| | | |
| | |
| Participant contributions | |
$ | 35 | | |
$ | 36 | | |
$ | 43 | |
| Benefits paid | |
$ | 204 | | |
$ | 201 | | |
$ | 215 | |
The Company does not expect to recognize any amortization
of net actuarial loss during the year ended December 31, 2025.
The following table summarizes the expected benefit
payments for the Company’s Postretirement Plan for each of the next five fiscal years and in the aggregate for the five fiscal years
thereafter (in thousands):
| December 31: |
|
|
|
| 2025 |
|
$ |
280 |
|
| 2026 |
|
|
360 |
|
| 2027 |
|
|
390 |
|
| 2028 |
|
|
420 |
|
| 2029 |
|
|
400 |
|
| 2030-2034 |
|
|
1,780 |
|
| |
|
$ |
3,630 |
|
For purposes of determining the cost and obligation
for pre-Medicare postretirement medical benefits, a 8.50% annual rate of increase in the per capita cost of covered benefits (i.e., health
care trend rate) was assumed for the Postretirement Plan in 2026, adjusted to a rate of 4.50% in 2035. Assumed health care cost trend
rates have a significant effect on the amounts reported for health care plans.
11. INCOME TAXES.
The Company recorded a provision for income taxes as follows (in thousands):
| | |
Years
Ended December 31, | |
| | |
2024 | | |
2023 | | |
2022 | |
| Current provision | |
$ | 173 | | |
$ | 97 | | |
$ | 1,925 | |
| Deferred provision | |
| — | | |
| — | | |
| — | |
| Total | |
$ | 173 | | |
$ | 97 | | |
$ | 1,925 | |
ALTO INGREDIENTS, INC.
NOTES TO CONSOLIDATED FINANCIAL STATEMENTS
A reconciliation of the differences between the United States statutory
federal income tax rate and the effective tax rate as provided in the consolidated statements of operations is as follows:
| | |
Years
Ended December 31, | |
| | |
2024 | | |
2023 | | |
2022 | |
| Statutory rate | |
| 21.0 | % | |
| 21.0 | % | |
| 21.0 | % |
| State income taxes, net of federal benefit | |
| 5.5 | | |
| 4.6 | | |
| 5.8 | |
| Change in valuation allowance | |
| (29.3 | ) | |
| (23.4 | ) | |
| (33.9 | ) |
| Stock-based compensation | |
| (0.4 | ) | |
| (2.3 | ) | |
| 3.1 | |
| Non-deductible items | |
| (0.1 | ) | |
| 0.8 | | |
| (1.6 | ) |
| Other | |
| 3.0 | | |
| (1.0 | ) | |
| 0.6 | |
| Effective
rate | |
| (0.3 | )% | |
| (0.3 | )% | |
| (5.0 | )% |
Deferred income taxes are provided using the asset and liability method
to reflect temporary differences between the financial statement carrying amounts and the tax bases of assets and liabilities using presently
enacted tax rates and laws. The components of deferred income taxes included in the consolidated balance sheets were as follows (in thousands):
| | |
December 31, | |
| | |
2024 | | |
2023 | |
| Deferred tax assets: | |
| | |
| |
| Net operating loss carryforwards | |
$ | 64,901 | | |
$ | 57,870 | |
| Capital loss | |
| 26,692 | | |
| 26,518 | |
| Disallowed interest | |
| 5,048 | | |
| 3,457 | |
| R&D, Energy and AMT credits | |
| 3,742 | | |
| 3,742 | |
| Derivatives | |
| — | | |
| 3,051 | |
| Intangibles | |
| 2,981 | | |
| 1,201 | |
| Pension liability | |
| 1,016 | | |
| 1,173 | |
| Railcar contracts | |
| 1,090 | | |
| 818 | |
| Stock-based compensation | |
| 803 | | |
| 696 | |
| Allowance for credit losses and other assets | |
| 1,059 | | |
| 296 | |
| Other | |
| 4,971 | | |
| 3,340 | |
| Total gross deferred tax assets | |
| 112,303 | | |
| 102,162 | |
| Less: valuation allowance | |
| (110,687 | ) | |
| (93,506 | ) |
| Total deferred tax assets, net of valuation allowance | |
| 1,616 | | |
| 8,656 | |
| | |
| | | |
| | |
| Deferred tax liabilities: | |
| | | |
| | |
| Property and equipment | |
| (703 | ) | |
| (7,720 | ) |
| Derivatives | |
| (574 | ) | |
| — | |
| Other | |
| (575 | ) | |
| (1,172 | ) |
| Total deferred tax liabilities | |
| (1,852 | ) | |
| (8,892 | ) |
| | |
| | | |
| | |
| Net deferred tax liabilities, included in other liabilities | |
$ | (236 | ) | |
$ | (236 | ) |
ALTO INGREDIENTS, INC.
NOTES TO CONSOLIDATED FINANCIAL STATEMENTS
A portion of the Company’s net operating loss carryforwards are
subject to provisions of the tax law that limit the use of losses incurred by a corporation prior to the date certain ownership changes
occur. These limitations also apply to certain depreciation deductions associated with assets on hand at the time of the ownership change
and otherwise allowable during the five-year period following the ownership change. As the five-year limitation period lapsed in 2019,
these disallowed deductions are reflected in property and equipment in the schedule above but continue to be subject to the annual limitation
that applies to the pre-change net operating losses. Due to the limitation on the use of net operating losses and depreciation deductions,
a significant portion of these carryforwards will expire regardless of whether the Company generates future taxable income. After reducing
these net operating loss carryforwards for the amount which will expire due to this limitation, the Company had remaining federal net
operating loss carryforwards of approximately $227,673,000 and state net operating loss carryforwards of approximately $276,424,000 at
December 31, 2024. These net operating loss carryforwards expire as follows (in thousands):
| Tax Years | |
Federal | | |
State | |
| 2025–2029 | |
$ | — | | |
$ | 30,603 | |
| 2030–2034 | |
| 15,126 | | |
| 76,920 | |
| 2035–2039 | |
| 83,771 | | |
| 112,608 | |
| 2040 and after* | |
| 128,776 | | |
| 56,293 | |
| Total NOLs | |
$ | 227,673 | | |
$ | 276,424 | |
Approximately $155,452,000 is available to utilize against federal
taxable income for 2025.
To the extent amounts are not utilized in any year, they may be carried
forward to the next year until expiration. These amounts may change if there are future additional limitations on their utilization.
Federal capital loss of $100,487,000 may be carried forward for 5 years
and will expire in 2025. State capital loss of $95,469,000 may be carried forward for 5 years for most of the states in which the Company
files returns and will expire in 2025.
In assessing whether the deferred tax assets are realizable, a more
likely than not standard is applied. If it is determined that it is more likely than not that deferred tax assets will not be realized,
a valuation allowance must be established against the deferred tax assets. The ultimate realization of deferred tax assets is dependent
upon the generation of future taxable income during the periods in which the associated temporary differences become deductible. Management
considers the scheduled reversal of deferred tax liabilities, projected future taxable income and tax planning strategies in making this
assessment.
A valuation allowance was established in the amount of $110,687,000
and $93,506,000 as of December 31, 2024 and 2023, respectively, based on the Company’s assessment of the future realizability
of certain deferred tax assets. The valuation allowance on deferred tax assets is related to future deductible temporary differences and
net operating loss carryforwards for which the Company has concluded it is more likely than not that these items will not be realized
in the ordinary course of operations.
ALTO INGREDIENTS, INC.
NOTES TO CONSOLIDATED FINANCIAL STATEMENTS
For the year ended December 31, 2024, the Company recorded an increase
in valuation allowance of $17,181,000. This was primarily related to additional net operating losses accumulated for the year. For the
year ended December 31, 2023, the Company recorded an increase in valuation allowance of $5,557,000. This was primarily related to additional
net operating losses accumulated for the year. For the year ended December 31, 2022, the Company recorded an increase in valuation allowance
of $12,365,000. This was primarily related to additional net operating losses accumulated for the year.
Unrecognized Tax Benefits
A reconciliation of the beginning balance and the ending balance of
gross unrecognized tax benefits, before interest and penalties, for the period presented is as follows (in thousands):
| | |
December 31, | |
| | |
2024 | | |
2023 | |
| Unrecognized tax benefits at beginning of year | |
$ | 739 | | |
$ | 739 | |
| Increases related to current year tax positions | |
| — | | |
| — | |
| Decreases related to current year tax positions | |
| — | | |
| — | |
| Increases related to prior year tax positions | |
| — | | |
| — | |
| Decreases related to prior year tax positions | |
| — | | |
| — | |
| Decreases related to expiration of prior year tax positions | |
| — | | |
| — | |
| Decreases related to settlements of prior year tax positions | |
| — | | |
| — | |
| Unrecognized tax benefits at end of year | |
$ | 739 | | |
$ | 739 | |
The Company recorded unrecognized tax benefits for
uncertain tax positions of approximately $739,000 as of December 31, 2024 and 2023, of which $739,000 would impact the effective tax rate,
if recognized.
The Company recognizes interest and penalties related
to income tax matters as a component of interest expense and other income, net, respectively. As of December 31, 2024, the Company accrued
penalties of $74,000 and interest of $134,000 related to uncertain tax positions. The Company does not expect the unrecognized tax benefits
to change significantly over the next 12 months.
ALTO INGREDIENTS, INC.
NOTES TO CONSOLIDATED FINANCIAL STATEMENTS
The Company is subject to income tax in the United
States federal jurisdiction and various state jurisdictions and has identified its federal tax return and tax returns in state jurisdictions
below as “major” tax filings. These jurisdictions, along with the years still open to audit under the applicable statutes
of limitation, are as follows:
| Jurisdiction | | Tax Years |
| Federal | | 2021 – 2023 |
| Alabama | | 2021 – 2023 |
| Arizona | | 2020 – 2023 |
| Arkansas | | 2021 – 2023 |
| California | | 2020 – 2023 |
| Colorado | | 2020 – 2023 |
| Connecticut | | 2021 – 2023 |
| Georgia | | 2021 – 2023 |
| Idaho | | 2021 – 2023 |
| Illinois | | 2021 – 2023 |
| Indiana | | 2021 – 2023 |
| Iowa | | 2021 – 2023 |
| Kansas | | 2021 – 2023 |
| Louisiana | | 2021 – 2023 |
| Michigan | | 2021 – 2023 |
| Minnesota | | 2021 – 2023 |
| Mississippi | | 2021 – 2023 |
| Missouri | | 2021 – 2023 |
| Nebraska | | 2021 – 2023 |
| New Mexico | | 2021 – 2023 |
| Oklahoma | | 2021 – 2023 |
| Oregon | | 2021 – 2023 |
| Pennsylvania | | 2021 – 2023 |
| Rhode Island | | 2021 – 2023 |
| South Carolina | | 2021 – 2023 |
| Tennessee | | 2021 – 2023 |
| Texas | | 2020 – 2023 |
However, because the Company had net operating losses and credits carried
forward in several of the jurisdictions, including the United States federal and California jurisdictions, certain items attributable
to closed tax years are still subject to adjustment by applicable taxing authorities through an adjustment to tax attributes carried forward
to open years.
12. PREFERRED STOCK.
The Company has 6,734,835 undesignated shares of authorized and unissued
preferred stock, which may be designated and issued in the future on the authority of the Company’s Board of Directors. As of December
31, 2024, the Company had the following designated classes of preferred stock:
Series A Preferred Stock – The Company has authorized
1,684,375 shares of Series A Cumulative Redeemable Convertible Preferred Stock (“Series A Preferred Stock”), with none outstanding
at December 31, 2024 and 2023. Shares of Series A Preferred Stock that are converted into shares of the Company’s common stock revert
to undesignated shares of authorized and unissued preferred stock.
ALTO INGREDIENTS, INC.
NOTES TO CONSOLIDATED FINANCIAL STATEMENTS
Upon any issuance, the Series A Preferred Stock would rank senior
in liquidation and dividend preferences to the Company’s common stock. Holders of Series A Preferred Stock would be entitled to
quarterly cumulative dividends payable in arrears in cash in an amount equal to 5% per annum of the purchase price per share of the Series
A Preferred Stock. The holders of the Series A Preferred Stock would have conversion rights initially equivalent to two shares of common
stock for each share of Series A Preferred Stock, subject to customary antidilution adjustments. Certain specified issuances will not
result in antidilution adjustments. The shares of Series A Preferred Stock would also be subject to forced conversion upon the occurrence
of a transaction that would result in an internal rate of return to the holders of the Series A Preferred Stock of 25% or more. Accrued
but unpaid dividends on the Series A Preferred Stock are to be paid in cash upon any conversion of the Series A Preferred Stock.
The holders of Series A Preferred Stock would have a liquidation preference
over the holders of the Company’s common stock equivalent to the purchase price per share of the Series A Preferred Stock plus
any accrued and unpaid dividends on the Series A Preferred Stock. A liquidation would be deemed to occur upon the happening of customary
events, including transfer of all or substantially all of the Company’s capital stock or assets or a merger, consolidation, share
exchange, reorganization or other transaction or series of related transactions, unless holders of 66 2/3% of the Series A Preferred
Stock vote affirmatively in favor of or otherwise consent to such transaction.
Series B Preferred Stock – The Company has authorized
1,580,790 shares of Series B Cumulative Convertible Preferred Stock (“Series B Preferred Stock”), with 926,942 shares outstanding
at December 31, 2024 and 2023. Shares of Series B Preferred Stock that are converted into shares of the Company’s common stock
revert to undesignated shares of authorized and unissued preferred stock.
The Series B Preferred Stock ranks senior in liquidation
and dividend preferences to the Company’s common stock. Holders of Series B Preferred Stock are entitled to quarterly cumulative
dividends payable in arrears in cash in an amount equal to 7.00% per annum of the purchase price per share of the Series B Preferred
Stock; however, subject to the provisions of the Letter Agreement described below, such dividends may, at the option of the Company,
be paid in additional shares of Series B Preferred Stock based initially on the liquidation value of the Series B Preferred Stock. In
addition to the quarterly cumulative dividends, holders of the Series B Preferred Stock are entitled to participate in any common stock
dividends declared by the Company to its common stockholders. The holders of Series B Preferred Stock have a liquidation preference over
the holders of the Company’s common stock initially equivalent to $19.50 per share of the Series B Preferred Stock plus any accrued
and unpaid dividends on the Series B Preferred Stock. A liquidation will be deemed to occur upon the happening of customary events, including
the transfer of all or substantially all of the capital stock or assets of the Company or a merger, consolidation, share exchange, reorganization
or other transaction or series of related transactions (each, a “transaction”), unless holders of 66 2/3% of the Series B
Preferred Stock vote affirmatively in favor of or otherwise consent that such transaction shall not be treated as a liquidation. The
Company believes that such liquidation events are within its control and therefore has classified the Series B Preferred Stock in stockholders’
equity.
As of December 31, 2024, the Series B Preferred
Stock was convertible into 980,712 shares of the Company’s common stock. The conversion ratio is subject to customary antidilution
adjustments. In addition, antidilution adjustments are to occur in the event that the Company issues equity securities, including derivative
securities convertible into equity securities (on an as-converted or as-exercised basis), at a price less than the conversion price then
in effect. The shares of Series B Preferred Stock are also subject to forced conversion upon the occurrence of a transaction that would
result in an internal rate of return to the holders of the Series B Preferred Stock of 25% or more. The forced conversion is to be based
upon the conversion ratio as last adjusted. Accrued but unpaid dividends on the Series B Preferred Stock are to be paid in cash upon
any conversion of the Series B Preferred Stock.
ALTO INGREDIENTS, INC.
NOTES TO CONSOLIDATED FINANCIAL STATEMENTS
The holders of Series B Preferred Stock vote together
as a single class with the holders of the Company’s common stock on all actions to be taken by the Company’s stockholders.
Each share of Series B Preferred Stock entitles the holder to approximately 0.03 votes per share on all matters to be voted on by the
stockholders of the Company. Notwithstanding the foregoing, the holders of Series B Preferred Stock are afforded numerous customary protective
provisions with respect to certain actions that may only be approved by holders of a majority of the shares of Series B Preferred Stock,
including, among other provisions, the right to approve any transaction that does not result in an internal rate of return of at least
25% to the holders of the Series B Preferred Stock.
In 2008, the Company entered into Letter Agreements
with Lyles United LLC (“Lyles United”) and other purchasers under which the Company expressly waived its rights under the
Certificate of Designations relating to the Series B Preferred Stock to make dividend payments in additional shares of Series B Preferred
Stock in lieu of cash dividend payments without the prior written consent of Lyles United and the other purchasers.
Registration Rights Agreement –
In connection with the sale of its Series B Preferred Stock, the Company entered into a registration rights agreement with Lyles United.
The registration rights agreement is effective until the holders of the Series B Preferred Stock, and their affiliates, as a group, own
less than 10% for each of the series issued, including common stock into which such Series B Preferred Stock has been converted. The
registration rights agreement provides that holders of a majority of the Series B Preferred Stock, including common stock into which
such Series B Preferred Stock has been converted, may demand and cause the Company to register on their behalf the shares of common stock
issued, issuable or that may be issuable upon conversion of the Preferred Stock and as payment of dividends thereon, and upon exercise
of the related warrants (collectively, the “Registrable Securities”). The Company is required to keep such registration statement
effective until such time as all of the Registrable Securities are sold or until such holders may avail themselves of Rule 144 for sales
of Registrable Securities without registration under the Securities Act of 1933, as amended. The holders are entitled to two demand registrations
on Form S-1 and unlimited demand registrations on Form S-3; provided, however, that the Company is not obligated to effect more than
one demand registration on Form S-3 in any calendar year. In addition to the demand registration rights afforded the holders under the
registration rights agreement, the holders are entitled to unlimited “piggyback” registration rights. These rights entitle
the holders who so elect to be included in registration statements to be filed by the Company with respect to other registrations of
equity securities. The Company is responsible for all costs of registration, plus reasonable fees of one legal counsel for the holders,
which fees are not to exceed $25,000 per registration. The registration rights agreement includes customary representations and warranties
on the part of both the Company and the holders and other customary terms and conditions.
ALTO INGREDIENTS, INC.
NOTES TO CONSOLIDATED FINANCIAL STATEMENTS
13. STOCK-BASED COMPENSATION.
On June 16, 2016, the Company’s shareholders approved the 2016
Stock Incentive Plan, which authorizes the issuance of incentive stock options and non-qualified stock options, restricted stock, restricted
stock units, stock appreciation rights, direct stock issuances and other stock-based awards to the Company’s officers, directors
or key employees or to consultants that do business with the Company initially for up to an aggregate of 1,150,000 shares of common stock.
On June 14, 2018, the Company’s shareholders approved an increase to the aggregate number of shares authorized under the 2016 Stock
Incentive Plan to 3,650,000 shares. On November 7, 2019, the Company’s shareholders approved an increase to the aggregate number
of shares authorized under the 2016 Stock Incentive Plan to 5,650,000 shares. On November 18, 2020, the Company’s shareholders
approved an increase to the aggregate number of shares authorized under the 2016 Stock Incentive Plan to 7,400,000 shares. On June 23,
2022, the Company’s shareholders approved an increase to the aggregate number of shares authorized under the 2016 Stock Incentive
Plan to 8,900,000 shares. On June 22, 2023, the Company’s shareholders approved an increase to the aggregate number of shares authorized
under the 2016 Stock Incentive Plan to 11,400,000 shares. On June 20, 2024, the Company’s shareholders approved an increase to
the aggregate number of shares authorized under the 2016 Stock Incentive Plan to 15,200,000 shares.
Restricted Stock – A summary
of unvested restricted stock activity is as follows (shares in thousands):
| | |
Number of
Shares | | |
Weighted-
Average
Grant Date
Fair Value
Per Share | |
| Unvested at December 31, 2022 | |
| 1,169 | | |
$ | 5.95 | |
| Issued | |
| 2,375 | | |
$ | 1.87 | |
| Vested | |
| (547 | ) | |
$ | 5.61 | |
| Canceled | |
| (56 | ) | |
$ | 3.14 | |
| Unvested at December 31, 2023 | |
| 2,941 | | |
$ | 2.77 | |
| | |
| | | |
| | |
| Issued | |
| 1,530 | | |
$ | 1.91 | |
| Vested | |
| (1,597 | ) | |
$ | 3.08 | |
| Canceled | |
| (143 | ) | |
$ | 2.16 | |
| Unvested at December 31, 2024 | |
| 2,731 | | |
$ | 2.14 | |
The fair value of the common stock at vesting aggregated $3,142,000,
$929,000 and $6,900,000 for the years ended December 31, 2024, 2023 and 2022, respectively. Stock-based compensation expense related
to employee and non-employee restricted stock and option grants recognized in the accompanying consolidated statements of operations,
was as follows (in thousands):
| | |
Years Ended December 31, | |
| | |
2024 | | |
2023 | | |
2022 | |
| Employees | |
$ | 3,960 | | |
$ | 3,345 | | |
$ | 2,689 | |
| Non-employees | |
| 397 | | |
| 551 | | |
| 644 | |
| Total stock-based compensation expense | |
$ | 4,357 | | |
$ | 3,896 | | |
$ | 3,333 | |
Employee grants typically have a two or three-year vesting schedule,
while non-employee grants have a one-year vesting schedule. At December 31, 2024, the total compensation expense related to unvested
awards which had not been recognized was $3,678,000 and the associated weighted-average period over which the compensation expense attributable
to those unvested awards will be recognized was approximately 0.67 years.
ALTO INGREDIENTS, INC.
NOTES TO CONSOLIDATED FINANCIAL STATEMENTS
14. COMMITMENTS AND CONTINGENCIES.
Commitments – The following is a description of
significant commitments at December 31, 2024:
Sales Commitments – At December 31, 2024, the
Company had entered into sales contracts with its major customers to sell certain quantities of alcohol and essential ingredients. The
Company had open alcohol indexed-price contracts for 74,375,000 gallons as of December 31, 2024 and open fixed-price alcohol sales
contracts totaling $166,794,000 as of December 31, 2024. The Company had open fixed-price sales contracts for essential ingredients totaling
$5,952,000 and open indexed-price sales contracts of essential ingredients for 47,000 tons as of December 31, 2024. These sales contracts
are scheduled for completion over the next twelve months.
Purchase Commitments – At December 31, 2024, the
Company had indexed-price purchase contracts to purchase 23,028,000 gallons of alcohol and fixed-price purchase contracts to purchase
$220,000 of alcohol from its suppliers. The Company had fixed-price purchase contracts to purchase $34,731,000 of corn from its suppliers
as of December 31, 2024. The Company had indexed-price purchase contracts for 2,520,000 MMBTU of natural gas. The Company had future
commitments for certain capital projects totaling $9,059,000. The Company also had a future commitment for $7,250,000 for the purchase
of Kodiak Carbonic, LLC. See Note 16. These purchase commitments are scheduled to be satisfied through 2025.
Contingencies – The following is a description
of significant contingencies at December 31, 2024:
Litigation – The Company is subject to various
claims and contingencies in the ordinary course of its business, including those related to litigation, business transactions, employee-related
matters, and others. When the Company is aware of a claim or potential claim, it assesses the likelihood of any loss or exposure. If
it is probable that a loss will result and the amount of the loss can be reasonably estimated, the Company will record a liability for
the loss. If the loss is not probable or the amount of the loss cannot be reasonably estimated, the Company discloses the claim if the
likelihood of a potential loss is reasonably possible, and the amount involved could be material. While the Company can provide no assurances,
the Company does not expect that any of its pending legal proceedings will have a material financial impact on the Company’s operating
results.
| 15. | FAIR VALUE MEASUREMENTS. |
The fair value hierarchy prioritizes the inputs used in valuation
techniques into three levels, as follows:
| ● | Level
1 – Observable inputs – unadjusted quoted prices in active markets for identical
assets and liabilities; |
| ● | Level
2 – Observable inputs other than quoted prices included in Level 1 that are observable
for the asset or liability through corroboration with market data; and |
| ● | Level
3 – Unobservable inputs – includes amounts derived from valuation models where
one or more significant inputs are unobservable. For fair value measurements using significant
unobservable inputs, a description of the inputs and the information used to develop the
inputs is required along with a reconciliation of Level 3 values from the prior reporting
period. |
ALTO INGREDIENTS, INC.
NOTES TO CONSOLIDATED FINANCIAL STATEMENTS
Pooled Separate Accounts – Pooled separate accounts
invest primarily in domestic and international stocks, commercial paper or single mutual funds. The net asset value is used as a practical
expedient to determine fair value for these accounts. Each pooled separate account provides for redemptions by the Retirement Plan at
reported net asset values per share, with little to no advance notice requirement, therefore these funds are classified within Level
2 of the valuation hierarchy.
Derivative Instruments – The Company’s derivative
instruments consist of commodity positions. The fair values of the commodity positions are based on quoted prices on the commodity exchanges
and are designated as Level 1 inputs.
Long-Lived Assets – Long-lived assets consist
of the Company’s estimated fair value associated with its Magic Valley facility. See Note 1 for additional information. The fair
value of the long-lived assets are based on present value of estimated future cash flows and are designated as Level 3 inputs.
The following table summarizes recurring and nonrecurring fair value
measurements by level at December 31, 2024 (in thousands):
| | |
| | |
| | |
| | |
| | |
Benefit Plan | |
| | |
| | |
| | |
| | |
| | |
Percentage | |
| | |
Fair Value | | |
Level
1 | | |
Level
2 | | |
Level
3 | | |
Allocation | |
| Assets: | |
| | |
| | |
| | |
| | |
| |
| Derivative
financial instruments | |
$ | 3,313 | | |
$ | 3,313 | | |
$ | — | | |
$ | — | | |
| | |
| Long-lived assets –
Magic Valley | |
| 19,397 | | |
| — | | |
| — | | |
| 19,397 | | |
| | |
| Defined
benefit plan assets(1) (pooled separate accounts): | |
| | | |
| | | |
| | | |
| | | |
| | |
| Large U.S. Equity(2) | |
| 6,962 | | |
| — | | |
| 6,962 | | |
| — | | |
| 34 | % |
| Small/Mid U.S. Equity(3) | |
| 3,636 | | |
| — | | |
| 3,636 | | |
| — | | |
| 18 | % |
| International Equity(4) | |
| 2,762 | | |
| — | | |
| 2,762 | | |
| — | | |
| 14 | % |
| Fixed Income(5) | |
| 6,807 | | |
| — | | |
| 6,807 | | |
| — | | |
| 34 | % |
| | |
$ | 42,877 | | |
$ | 3,313 | | |
$ | 20,167 | | |
$ | 19,397 | | |
| | |
| | |
| | | |
| | | |
| | | |
| | | |
| | |
| Liabilities: | |
| | | |
| | | |
| | | |
| | | |
| | |
| Derivative
financial instruments | |
$ | 1,177 | | |
$ | 1,177 | | |
$ | — | | |
$ | — | | |
| | |
ALTO INGREDIENTS, INC.
NOTES TO CONSOLIDATED FINANCIAL STATEMENTS
The following table summarizes recurring and nonrecurring fair value
measurements by level at December 31, 2023 (in thousands):
| | |
| | |
| | |
| | |
| | |
Benefit Plan | |
| | |
Fair | | |
| | |
| | |
| | |
Percentage | |
| | |
Value | | |
Level 1 | | |
Level 2 | | |
Level 3 | | |
Allocation | |
| Assets: | |
| | |
| | |
| | |
| | |
| |
| Derivative financial instruments | |
$ | 2,412 | | |
$ | 2,412 | | |
$ | — | | |
$ | — | | |
| | |
| Defined benefit plan assets(1) (pooled separate accounts): | |
| | | |
| | | |
| | | |
| | | |
| | |
| Large U.S. Equity(2) | |
| 5,608 | | |
| — | | |
| 5,608 | | |
| — | | |
| 30 | % |
| Small/Mid U.S. Equity(3) | |
| 3,350 | | |
| — | | |
| 3,350 | | |
| — | | |
| 18 | % |
| International Equity(4) | |
| 2,682 | | |
| — | | |
| 2,682 | | |
| — | | |
| 15 | % |
| Fixed Income(5) | |
| 6,845 | | |
| — | | |
| 6,845 | | |
| — | | |
| 37 | % |
| | |
$ | 20,897 | | |
$ | 2,412 | | |
$ | 18,485 | | |
$ | — | | |
| | |
| | |
| | | |
| | | |
| | | |
| | | |
| | |
| Liabilities: | |
| | | |
| | | |
| | | |
| | | |
| | |
| Derivative financial instruments | |
$ | 13,849 | | |
$ | 13,849 | | |
$ | — | | |
$ | — | | |
| | |
On January 1, 2025, the Company’s wholly-owned subsidiary, Alto
Carbonic, LLC, acquired 100% of the equity interests in Kodiak Carbonic, LLC, a beverage-grade liquid CO2 processor for $7.6
million in cash. The transaction also involved an improved, long-term sales contract with a third party for the sale of beverage-grade
liquid CO2, which will improve the financial results of the production facility. Alto Carbonic’s facility is co-located
at the Columbia ethanol facility. Based on its preliminary assessment, the Company expects to record at fair value $3.9 million in property
and equipment and $3.7 million of intangible assets related to the long-term sales contract. The Company does not expect to record any
goodwill with the transaction and plans to report the results of Alto Carbonic in the Company’s Western Production segment.
INDEX TO EXHIBITS
| | |
| |
Where Located |
Exhibit
Number | |
Description* | |
Form | |
File
Number | |
Exhibit
Number | |
Filing Date | |
Filed
Herewith |
| | |
| |
| |
| |
| |
| |
|
| 3.1 | |
Certificate of Incorporation | |
10-Q | |
000-21467 | |
3.1 | |
11/06/2015 | |
|
| | |
| |
| |
| |
| |
| |
|
| 3.2 | |
Certificate of Designations, Powers, Preferences and Rights of the Series A Cumulative Redeemable Convertible Preferred Stock | |
10-Q | |
000-21467 | |
3.2 | |
11/06/2015 | |
|
| | |
| |
| |
| |
| |
| |
|
| 3.3 | |
Certificate of Designations, Powers, Preferences and Rights of the Series B Cumulative Convertible Preferred Stock | |
10-Q | |
000-21467 | |
3.3 | |
11/06/2015 | |
|
| | |
| |
| |
| |
| |
| |
|
| 3.4 | |
Certificate of Amendment to Certificate of Incorporation dated June 3, 2010 | |
10-Q | |
000-21467 | |
3.4 | |
11/06/2015 | |
|
| | |
| |
| |
| |
| |
| |
|
| 3.5 | |
Certificate of Amendment to Certificate of Incorporation effective June 8, 2011 | |
10-Q | |
000-21467 | |
3.5 | |
11/06/2015 | |
|
| | |
| |
| |
| |
| |
| |
|
| 3.6 | |
Certificate of Amendment to Certificate of Incorporation effective May 14, 2013 | |
10-Q | |
000-21467 | |
3.6 | |
11/06/2015 | |
|
| | |
| |
| |
| |
| |
| |
|
| 3.7 | |
Certificate of Amendment to Certificate of Incorporation effective July 1, 2015 | |
10-Q | |
000-21467 | |
3.7 | |
11/06/2015 | |
|
| | |
| |
| |
| |
| |
| |
|
| 3.8 | |
Certificate of Amendment to Certificate of Incorporation effective January 12, 2021 | |
8-K | |
000-21467 | |
3.1 | |
01/13/2021 | |
|
| | |
| |
| |
| |
| |
| |
|
| 3.9 | |
Amended and Restated Bylaws | |
8-K | |
000-21467 | |
3.1 | |
03/06/2024 | |
|
| | |
| |
| |
| |
| |
| |
|
| 4.1 | |
Description of Securities Registered Pursuant to Section 12 of the Securities Exchange Act of 1934 | |
10-K | |
000-21467 | |
4.1 | |
03/30/2020 | |
|
| | |
| |
| |
| |
| |
| |
|
| 10.1 | |
2016 Stock Incentive Plan, as amended# | |
S-8 | |
333-280351 | |
4.11 | |
06/20/2024 | |
|
| | |
| |
| |
| |
| |
| |
|
| 10.2 | |
Form of Employee Restricted Stock Agreement under 2016 Stock Incentive Plan# | |
10-K | |
000-21467 | |
10.5 | |
03/15/2018 | |
|
| | |
| |
| |
| |
| |
| |
|
| 10.3 | |
Form of Non-Employee Director Restricted Stock Agreement under 2016 Stock Incentive Plan# | |
10-K | |
000-21467 | |
10.6 | |
03/15/2017 | |
|
| | |
| |
| |
| |
| |
| |
|
| 10.4 | |
Form of Performance Share Agreement under 2016 Stock Incentive Plan# | |
10-Q | |
000-21467 | |
10.3 | |
05/08/2024 | |
|
| | |
| |
| |
| |
| |
| |
|
| 10.5 | |
Second Amended and Restated Executive Employment Agreement dated September 17, 2023 between the Registrant and Bryon T. McGregor# | |
8-K | |
000-21467 | |
10.1 | |
09/20/2023 | |
|
| | |
| |
| |
| |
| |
| |
|
| 10.6 | |
Amended and Restated Executive Employment Agreement dated November 7, 2016 between the Registrant and James R. Sneed# | |
10-K | |
000-21467 | |
10.12 | |
03/15/2017 | |
|
| | |
| |
Where Located |
Exhibit
Number | |
Description* | |
Form | |
File
Number | |
Exhibit
Number | |
Filing Date | |
Filed
Herewith |
| | |
| |
| |
| |
| |
| |
|
| 10.7 | |
Second Amended and Restated Employment Agreement dated April 1, 2024 between the Registrant and Todd E. Benton# | |
8-K | |
000-21467 | |
10.1 | |
03/21/2024 | |
|
| | |
| |
| |
| |
| |
| |
|
| 10.8 | |
Employment Agreement dated February 1, 2022 between the Registrant and Auste M. Graham# | |
10-K | |
000-21467 | |
10.9 | |
03/15/2022 | |
|
| | |
| |
| |
| |
| |
| |
|
| 10.9 | |
Second Amended and Restated Employment Agreement dated September 17, 2023 between the Registrant and Robert R. Olander# | |
8-K | |
000-21467 | |
10.3 | |
09/20/2023 | |
|
| | |
| |
| |
| |
| |
| |
|
| 10.10 | |
Form of Indemnity Agreement between the Registrant and each of its Executive Officers and Directors# | |
10-K | |
000-21467 | |
10.46 | |
03/31/2010 | |
|
| | |
| |
| |
| |
| |
| |
|
| 10.11 | |
Policy for Recoupment of Incentive Compensation dated March 29, 2018# | |
10-K | |
000-21467 | |
10.17 | |
03/18/2019 | |
|
| | |
| |
| |
| |
| |
| |
|
| 10.12 | |
Form of Clawback Policy Acknowledgement and Agreement# | |
10-K | |
000-21467 | |
10.18 | |
03/18/2019 | |
|
| | |
| |
| |
| |
| |
| |
|
| 10.13 | |
Registration Rights Agreement dated March 27, 2008 between the Registrant and Lyles United, LLC | |
8-K | |
000-21467 | |
10.4 | |
03/27/2008 | |
|
| | |
| |
| |
| |
| |
| |
|
| 10.14 | |
Letter Agreement dated March 27, 2008 between the Registrant and Lyles United, LLC | |
8-K | |
000-21467 | |
10.5 | |
03/27/2008 | |
|
| | |
| |
| |
| |
| |
| |
|
| 10.15 | |
Letter Agreement dated May 22, 2008 among the Registrant, Neil M. Koehler, Bill Jones, Paul P. Koehler and Thomas D. Koehler# | |
8-K | |
000-21467 | |
10.3 | |
05/23/2008 | |
|
| | |
| |
| |
| |
| |
| |
|
| 10.16 | |
Second Amended and Restated Credit Agreement dated August 2, 2017 among Kinergy Marketing LLC, Pacific Ag. Products, LLC, Wells Fargo Bank, National Association, and the parties thereto from time to time as lenders | |
8-K | |
000-21467 | |
10.1 | |
08/08/2017 | |
|
| | |
| |
| |
| |
| |
| |
|
| 10.17 | |
Amendment No. 1 to Second Amended and Restated Credit Agreement dated March 27, 2019 by and among Kinergy Marketing LLC, Pacific Ag. Products, LLC and Wells Fargo Bank, National Association | |
10-Q | |
000-21467 | |
10.7 | |
05/03/2019 | |
|
| | |
| |
| |
| |
| |
| |
|
| 10.18 | |
Amendment No. 2 to Second Amended and Restated Credit Agreement dated July 31, 2019 by and among Kinergy Marketing LLC, Pacific Ag. Products, LLC, the parties thereto from time to time as lenders and Wells Fargo Bank, National Association | |
8-K | |
000-21467 | |
10.1 | |
08/06/2019 | |
|
| | |
| |
| |
| |
| |
| |
|
| 10.19 | |
Amendment No. 3 to Second Amended and Restated Credit Agreement dated November 19, 2019 by and among Kinergy Marketing LLC, Pacific Ag. Products, LLC, the parties thereto from time to time as lenders and Wells Fargo Bank, National Association | |
10-K | |
000-21467 | |
10.61 | |
03/30/2020 | |
|
| | |
| |
Where Located |
Exhibit
Number | |
Description* | |
Form | |
File
Number | |
Exhibit
Number | |
Filing Date | |
Filed
Herewith |
| | |
| |
| |
| |
| |
| |
|
| 10.20 | |
Waiver, Consent and Amendment No. 4 to Second Amended and Restated Credit Agreement dated March 8, 2021 by and among Kinergy Marketing LLC, Alto Nutrients, LLC and Wells Fargo Bank, National Association | |
10-K | |
000-21467 | |
10.20 | |
03/15/2022 | |
|
| | |
| |
| |
| |
| |
| |
|
| 10.21 | |
Waiver, Consent, and Amendment No. 5 to Second Amended and Restated Credit Agreement dated June 10, 2021 by and among Kinergy Marketing LLC, Alto Nutrients, LLC and Wells Fargo Bank, National Association | |
10-K | |
000-21467 | |
10.21 | |
03/15/2022 | |
|
| | |
| |
| |
| |
| |
| |
|
| 10.22 | |
Amendment No. 6 to Second Amended and Restated Credit Agreement dated November 7, 2022 by and among Kinergy Marketing LLC, Alto Nutrients, LLC and Wells Fargo Bank, National Association | |
8-K | |
000-21467 | |
10.2 | |
11/14/2022 | |
|
| | |
| |
| |
| |
| |
| |
|
| 10.23 | |
Second Amended and Restated Guarantee dated August 2, 2017 by the Registrant in favor of Wells Fargo Bank, National Association, for and on behalf of the lenders | |
8-K | |
000-21467 | |
10.2 | |
08/08/2017 | |
|
| | |
| |
| |
| |
| |
| |
|
| 10.24 | |
Credit Agreement dated November 7, 2022 by and among the Registrant, the subsidiary guarantors signatory thereto, Orion Energy Credit Opportunities Fund III, L.P., Orion Energy Credit Opportunities Fund III GPFA PV, L.P., Orion Energy Credit Opportunities Fund III GPFA, L.P., Orion Energy Credit Opportunities Fund III PV, L.P., and OIC Investment Agent, LLC | |
8-K | |
000-21467 | |
10.1 | |
11/14/2022 | |
|
| | |
| |
| |
| |
| |
| |
|
| 10.25 | |
First Amendment to Credit Agreement dated November 6, 2023 between the Registrant and OIC Investment Agent, LLC | |
10-K | |
000-21467 | |
10.24 | |
03/14/2024 | |
|
| | |
| |
| |
| |
| |
| |
|
| 10.26 | |
Second Amendment to Credit Agreement dated November 6, 2024 between the Registrant and OIC Investment Agent, LLC | |
| |
| |
| |
| |
X |
| | |
| |
| |
| |
| |
| |
|
| 10.27 | |
Consent and Third Amendment to Credit Agreement dated January 1, 2025 between the Registrant and OIC Investment Agent, LLC | |
| |
| |
| |
| |
X |
| | |
| |
| |
| |
| |
| |
|
| 10.28 | |
Registration Rights Agreement dated November 7, 2022 by and among the Registrant, Orion Energy Credit Opportunities Fund III, L.P., Orion Energy Credit Opportunities Fund III GPFA PV, L.P., Orion Energy Credit Opportunities Fund III GPFA, L.P. and Orion Energy Credit Opportunities Fund III PV, L.P. | |
8-K | |
000-21467 | |
10.3 | |
11/14/2022 | |
|
| | |
| |
| |
| |
| |
| |
|
| 10.29 | |
CO2 Transportation and Sequestration Agreement dated November 4, 2024 between Alto Pekin, LLC and Vault Dragon CCS Holdings LP | |
8-K | |
000-21467 | |
10.1 | |
11/12/2024 | |
|
| (#) | A contract, compensatory plan or arrangement to which a director or executive
officer is a party or in which one or more directors or executive officers are eligible to
participate. |
| (*) | Certain of the agreements filed as exhibits contain representations and
warranties made by the parties thereto. The assertions embodied in such representations and
warranties are not necessarily assertions of fact, but a mechanism for the parties to allocate
risk. Accordingly, investors should not rely on the representations and warranties as characterizations
of the actual state of facts or for any other purpose at the time they were made or otherwise. |
SIGNATURES
Pursuant to the requirements of Section 13 or
15(d) of the Securities Exchange Act of 1934, the Registrant has duly caused this report to be signed on its behalf by the undersigned,
thereunto duly authorized on this 13th day of March, 2025.
| |
ALTO INGREDIENTS, INC. |
| |
|
| |
/s/ BRYON T. MCGREGOR |
| |
Bryon T. McGregor |
| |
President and Chief Executive Officer |
Pursuant to the requirements of the Securities
Exchange Act of 1934, this report has been signed below by the following persons on behalf of the Registrant and in the capacities and
on the dates indicated.
| Signature |
|
Title |
|
Date |
| |
|
|
|
|
| /s/ DOUGLAS L. KIETA |
|
Chairman of the Board and Director |
|
March 13, 2025 |
| Douglas L. Kieta |
|
|
|
|
| |
|
|
|
|
| /s/ BRYON T. MCGREGOR |
|
President, Chief Executive Officer |
|
March 13, 2025 |
| Bryon T. McGregor |
|
(Principal Executive Officer) and Director |
|
|
| |
|
|
|
|
| /s/ ROBERT R. OLANDER |
|
Chief Financial Officer |
|
March 13, 2025 |
| Robert R. Olander |
|
(Principal Financial and Accounting Officer) |
|
|
| |
|
|
|
|
| /s/ MICHAEL D. KANDRIS |
|
Director |
|
March 13, 2025 |
| Michael D. Kandris |
|
|
|
|
| |
|
|
|
|
| /s/ GILBERT E. NATHAN |
|
Director |
|
March 13, 2025 |
| Gilbert E. Nathan |
|
|
|
|
| |
|
|
|
|
| /s/ DIANNE S. NURY |
|
Director |
|
March 13, 2025 |
| Dianne S. Nury |
|
|
|
|
| |
|
|
|
|
| /s/ MARIA G. GRAY |
|
Director |
|
March 13, 2025 |
| Maria G. Gray |
|
|
|
|
-60-
http://fasb.org/us-gaap/2024#OperatingLeaseRightOfUseAsset
http://fasb.org/us-gaap/2024#OperatingLeaseRightOfUseAsset
http://fasb.org/us-gaap/2024#OperatingLeaseLiabilityCurrent
http://fasb.org/us-gaap/2024#OperatingLeaseLiabilityCurrent
http://fasb.org/us-gaap/2024#OperatingLeaseLiabilityNoncurrent
http://fasb.org/us-gaap/2024#OperatingLeaseLiabilityNoncurrent
0000778164
false
FY
0000778164
2024-01-01
2024-12-31
0000778164
2024-06-28
0000778164
2025-03-12
0000778164
2024-12-31
0000778164
2023-12-31
0000778164
us-gaap:SeriesAPreferredStockMember
2024-12-31
0000778164
us-gaap:SeriesAPreferredStockMember
2023-12-31
0000778164
us-gaap:SeriesBPreferredStockMember
2024-12-31
0000778164
us-gaap:SeriesBPreferredStockMember
2023-12-31
0000778164
us-gaap:NonvotingCommonStockMember
2024-12-31
0000778164
us-gaap:NonvotingCommonStockMember
2023-12-31
0000778164
2023-01-01
2023-12-31
0000778164
2022-01-01
2022-12-31
0000778164
us-gaap:PreferredStockMember
2021-12-31
0000778164
alto:CommonStockAndNonVotingCommonMember
2021-12-31
0000778164
us-gaap:AdditionalPaidInCapitalMember
2021-12-31
0000778164
us-gaap:RetainedEarningsMember
2021-12-31
0000778164
us-gaap:AccumulatedOtherComprehensiveIncomeMember
2021-12-31
0000778164
2021-12-31
0000778164
us-gaap:PreferredStockMember
2022-01-01
2022-12-31
0000778164
alto:CommonStockAndNonVotingCommonMember
2022-01-01
2022-12-31
0000778164
us-gaap:AdditionalPaidInCapitalMember
2022-01-01
2022-12-31
0000778164
us-gaap:RetainedEarningsMember
2022-01-01
2022-12-31
0000778164
us-gaap:AccumulatedOtherComprehensiveIncomeMember
2022-01-01
2022-12-31
0000778164
us-gaap:PreferredStockMember
2022-12-31
0000778164
alto:CommonStockAndNonVotingCommonMember
2022-12-31
0000778164
us-gaap:AdditionalPaidInCapitalMember
2022-12-31
0000778164
us-gaap:RetainedEarningsMember
2022-12-31
0000778164
us-gaap:AccumulatedOtherComprehensiveIncomeMember
2022-12-31
0000778164
2022-12-31
0000778164
us-gaap:PreferredStockMember
2023-01-01
2023-12-31
0000778164
alto:CommonStockAndNonVotingCommonMember
2023-01-01
2023-12-31
0000778164
us-gaap:AdditionalPaidInCapitalMember
2023-01-01
2023-12-31
0000778164
us-gaap:RetainedEarningsMember
2023-01-01
2023-12-31
0000778164
us-gaap:AccumulatedOtherComprehensiveIncomeMember
2023-01-01
2023-12-31
0000778164
us-gaap:PreferredStockMember
2023-12-31
0000778164
alto:CommonStockAndNonVotingCommonMember
2023-12-31
0000778164
us-gaap:AdditionalPaidInCapitalMember
2023-12-31
0000778164
us-gaap:RetainedEarningsMember
2023-12-31
0000778164
us-gaap:AccumulatedOtherComprehensiveIncomeMember
2023-12-31
0000778164
us-gaap:PreferredStockMember
2024-01-01
2024-12-31
0000778164
alto:CommonStockAndNonVotingCommonMember
2024-01-01
2024-12-31
0000778164
us-gaap:AdditionalPaidInCapitalMember
2024-01-01
2024-12-31
0000778164
us-gaap:RetainedEarningsMember
2024-01-01
2024-12-31
0000778164
us-gaap:AccumulatedOtherComprehensiveIncomeMember
2024-01-01
2024-12-31
0000778164
us-gaap:PreferredStockMember
2024-12-31
0000778164
alto:CommonStockAndNonVotingCommonMember
2024-12-31
0000778164
us-gaap:AdditionalPaidInCapitalMember
2024-12-31
0000778164
us-gaap:RetainedEarningsMember
2024-12-31
0000778164
us-gaap:AccumulatedOtherComprehensiveIncomeMember
2024-12-31
0000778164
2024-10-01
2024-12-31
0000778164
us-gaap:SubsequentEventMember
2025-01-01
2025-01-01
0000778164
us-gaap:OtherCustomerMember
us-gaap:AccountsReceivableMember
us-gaap:CustomerConcentrationRiskMember
2024-01-01
2024-12-31
0000778164
us-gaap:OtherCustomerMember
us-gaap:AccountsReceivableMember
us-gaap:CustomerConcentrationRiskMember
2023-01-01
2023-12-31
0000778164
us-gaap:CollectiveBargainingArrangementOtherMember
us-gaap:SupplierConcentrationRiskMember
alto:SuppliersMember
2024-01-01
2024-12-31
0000778164
us-gaap:InventoriesMember
2024-12-31
0000778164
us-gaap:InventoriesMember
2023-12-31
0000778164
srt:MinimumMember
2024-12-31
0000778164
srt:MaximumMember
2024-12-31
0000778164
alto:EquityMethodInvestmentMember
2024-12-31
0000778164
2022-09-12
0000778164
2022-09-12
2022-09-12
0000778164
us-gaap:NonvotingCommonStockMember
us-gaap:CommonStockMember
2024-12-31
0000778164
alto:CustomerAMember
us-gaap:SalesMember
us-gaap:CustomerConcentrationRiskMember
2024-01-01
2024-12-31
0000778164
alto:CustomerAMember
us-gaap:SalesMember
us-gaap:CustomerConcentrationRiskMember
2023-01-01
2023-12-31
0000778164
alto:CustomerAMember
us-gaap:SalesMember
us-gaap:CustomerConcentrationRiskMember
2022-01-01
2022-12-31
0000778164
alto:CustomerBMember
us-gaap:SalesMember
us-gaap:CustomerConcentrationRiskMember
2024-01-01
2024-12-31
0000778164
alto:CustomerBMember
us-gaap:SalesMember
us-gaap:CustomerConcentrationRiskMember
2023-01-01
2023-12-31
0000778164
alto:CustomerBMember
us-gaap:SalesMember
us-gaap:CustomerConcentrationRiskMember
2022-01-01
2022-12-31
0000778164
alto:PurchaseMember
us-gaap:CustomerConcentrationRiskMember
alto:SupplierAMember
2024-01-01
2024-12-31
0000778164
alto:PurchaseMember
us-gaap:CustomerConcentrationRiskMember
alto:SupplierAMember
2023-01-01
2023-12-31
0000778164
alto:PurchaseMember
us-gaap:CustomerConcentrationRiskMember
alto:SupplierAMember
2022-01-01
2022-12-31
0000778164
alto:PurchaseMember
us-gaap:CustomerConcentrationRiskMember
alto:SupplierBMember
2024-01-01
2024-12-31
0000778164
alto:PurchaseMember
us-gaap:CustomerConcentrationRiskMember
alto:SupplierBMember
2023-01-01
2023-12-31
0000778164
alto:PurchaseMember
us-gaap:CustomerConcentrationRiskMember
alto:SupplierBMember
2022-01-01
2022-12-31
0000778164
alto:PurchaseMember
us-gaap:CustomerConcentrationRiskMember
alto:SupplierCMember
2024-01-01
2024-12-31
0000778164
alto:PurchaseMember
us-gaap:CustomerConcentrationRiskMember
alto:SupplierCMember
2023-01-01
2023-12-31
0000778164
alto:PurchaseMember
us-gaap:CustomerConcentrationRiskMember
alto:SupplierCMember
2022-01-01
2022-12-31
0000778164
us-gaap:BuildingMember
2024-12-31
0000778164
srt:MinimumMember
us-gaap:EquipmentMember
2024-12-31
0000778164
srt:MaximumMember
us-gaap:EquipmentMember
2024-12-31
0000778164
srt:MinimumMember
alto:OtherEquipmentVehiclesandFurnitureMember
2024-12-31
0000778164
srt:MaximumMember
alto:OtherEquipmentVehiclesandFurnitureMember
2024-12-31
0000778164
alto:AcquisitionOfEagleAlcoholMember
2022-01-14
0000778164
alto:AcquisitionOfEagleAlcoholMember
2022-01-14
2022-01-14
0000778164
alto:AcquisitionOfEagleAlcoholMember
2024-12-31
0000778164
alto:AcquisitionOfEagleAlcoholMember
2023-12-31
0000778164
alto:AffiliateManagementAgreementMember
2024-01-01
2024-12-31
0000778164
alto:AltoIngredientsIncMember
2023-01-01
2023-12-31
0000778164
alto:AltoIngredientsIncMember
2022-01-01
2022-12-31
0000778164
alto:EthanolMarketingAgreementsMember
2024-01-01
2024-12-31
0000778164
alto:EthanolMarketingAgreementsMember
2023-01-01
2023-12-31
0000778164
alto:EthanolMarketingAgreementsMember
2022-01-01
2022-12-31
0000778164
alto:CornProcurementAndHandlingAgreementsMember
2024-01-01
2024-12-31
0000778164
alto:CornProcurementAndHandlingAgreementsMember
2023-01-01
2023-12-31
0000778164
alto:CornProcurementAndHandlingAgreementsMember
2022-01-01
2022-12-31
0000778164
alto:EssentialIngredientsMarketingAgreementsMember
2024-01-01
2024-12-31
0000778164
alto:EssentialIngredientsMarketingAgreementsMember
2023-01-01
2023-12-31
0000778164
alto:EssentialIngredientsMarketingAgreementsMember
2022-01-01
2022-12-31
0000778164
alto:PekinCampusProductionSegmentMember
2024-01-01
2024-12-31
0000778164
alto:PekinCampusProductionSegmentMember
2023-01-01
2023-12-31
0000778164
alto:PekinCampusProductionSegmentMember
2022-01-01
2022-12-31
0000778164
alto:MarketingAndDistributionSegmentMember
2024-01-01
2024-12-31
0000778164
alto:MarketingAndDistributionSegmentMember
2023-01-01
2023-12-31
0000778164
alto:MarketingAndDistributionSegmentMember
2022-01-01
2022-12-31
0000778164
alto:WesternProductionSegmentMember
2024-01-01
2024-12-31
0000778164
alto:WesternProductionSegmentMember
2023-01-01
2023-12-31
0000778164
alto:WesternProductionSegmentMember
2022-01-01
2022-12-31
0000778164
alto:PekinCampusSegmentMember
2024-01-01
2024-12-31
0000778164
alto:PekinCampusSegmentMember
2023-01-01
2023-12-31
0000778164
alto:PekinCampusSegmentMember
2022-01-01
2022-12-31
0000778164
alto:EthanolAlcoholSalesMember
alto:PekinCampusProductionMember
2024-01-01
2024-12-31
0000778164
alto:EthanolAlcoholSalesMember
alto:PekinCampusProductionMember
2023-01-01
2023-12-31
0000778164
alto:EthanolAlcoholSalesMember
alto:PekinCampusProductionMember
2022-01-01
2022-12-31
0000778164
alto:EssentialIngredientSalesMember
alto:PekinCampusProductionMember
2024-01-01
2024-12-31
0000778164
alto:EssentialIngredientSalesMember
alto:PekinCampusProductionMember
2023-01-01
2023-12-31
0000778164
alto:EssentialIngredientSalesMember
alto:PekinCampusProductionMember
2022-01-01
2022-12-31
0000778164
alto:IntersegmentSaleMember
alto:PekinCampusProductionMember
2024-01-01
2024-12-31
0000778164
alto:IntersegmentSaleMember
alto:PekinCampusProductionMember
2023-01-01
2023-12-31
0000778164
alto:IntersegmentSaleMember
alto:PekinCampusProductionMember
2022-01-01
2022-12-31
0000778164
alto:IntersegmentSaleMember
alto:TotalPekinCampusSalesMember
2024-01-01
2024-12-31
0000778164
alto:IntersegmentSaleMember
alto:TotalPekinCampusSalesMember
2023-01-01
2023-12-31
0000778164
alto:IntersegmentSaleMember
alto:TotalPekinCampusSalesMember
2022-01-01
2022-12-31
0000778164
alto:AlcoholSalesGrossMember
alto:MarketingAndDistributionsMember
2024-01-01
2024-12-31
0000778164
alto:AlcoholSalesGrossMember
alto:MarketingAndDistributionsMember
2023-01-01
2023-12-31
0000778164
alto:AlcoholSalesGrossMember
alto:MarketingAndDistributionsMember
2022-01-01
2022-12-31
0000778164
alto:AlcoholSalesNetMember
alto:MarketingAndDistributionsMember
2024-01-01
2024-12-31
0000778164
alto:AlcoholSalesNetMember
alto:MarketingAndDistributionsMember
2023-01-01
2023-12-31
0000778164
alto:AlcoholSalesNetMember
alto:MarketingAndDistributionsMember
2022-01-01
2022-12-31
0000778164
alto:IntersegmentSaleMember
alto:MarketingAndDistributionsMember
2024-01-01
2024-12-31
0000778164
alto:IntersegmentSaleMember
alto:MarketingAndDistributionsMember
2023-01-01
2023-12-31
0000778164
alto:IntersegmentSaleMember
alto:MarketingAndDistributionsMember
2022-01-01
2022-12-31
0000778164
alto:IntersegmentSaleMember
alto:TotalMarketingAndDistributionSalesMember
2024-01-01
2024-12-31
0000778164
alto:IntersegmentSaleMember
alto:TotalMarketingAndDistributionSalesMember
2023-01-01
2023-12-31
0000778164
alto:IntersegmentSaleMember
alto:TotalMarketingAndDistributionSalesMember
2022-01-01
2022-12-31
0000778164
alto:AlcoholSalesMember
alto:WesternProductionSegmentMember
2024-01-01
2024-12-31
0000778164
alto:AlcoholSalesMember
alto:WesternProductionSegmentMember
2023-01-01
2023-12-31
0000778164
alto:AlcoholSalesMember
alto:WesternProductionSegmentMember
2022-01-01
2022-12-31
0000778164
alto:EssentialIngredientSalesMember
alto:WesternProductionSegmentMember
2024-01-01
2024-12-31
0000778164
alto:EssentialIngredientSalesMember
alto:WesternProductionSegmentMember
2023-01-01
2023-12-31
0000778164
alto:EssentialIngredientSalesMember
alto:WesternProductionSegmentMember
2022-01-01
2022-12-31
0000778164
alto:IntersegmentSaleMember
alto:WesternProductionSegmentMember
2024-01-01
2024-12-31
0000778164
alto:IntersegmentSaleMember
alto:WesternProductionSegmentMember
2023-01-01
2023-12-31
0000778164
alto:IntersegmentSaleMember
alto:WesternProductionSegmentMember
2022-01-01
2022-12-31
0000778164
alto:IntersegmentSaleMember
alto:WesternProductionSegmentMember
alto:TotalWesternProductionSalesMember
2024-01-01
2024-12-31
0000778164
alto:IntersegmentSaleMember
alto:WesternProductionSegmentMember
alto:TotalWesternProductionSalesMember
2023-01-01
2023-12-31
0000778164
alto:IntersegmentSaleMember
alto:WesternProductionSegmentMember
alto:TotalWesternProductionSalesMember
2022-01-01
2022-12-31
0000778164
us-gaap:CorporateAndOtherMember
2024-01-01
2024-12-31
0000778164
us-gaap:CorporateAndOtherMember
2023-01-01
2023-12-31
0000778164
us-gaap:CorporateAndOtherMember
2022-01-01
2022-12-31
0000778164
alto:IntersegmentEliminationsMember
2024-01-01
2024-12-31
0000778164
alto:IntersegmentEliminationsMember
2023-01-01
2023-12-31
0000778164
alto:IntersegmentEliminationsMember
2022-01-01
2022-12-31
0000778164
alto:PekinCampusProductionMember
2024-01-01
2024-12-31
0000778164
alto:PekinCampusProductionMember
2023-01-01
2023-12-31
0000778164
alto:PekinCampusProductionMember
2022-01-01
2022-12-31
0000778164
alto:MarketingAndDistributionsMember
2024-01-01
2024-12-31
0000778164
alto:MarketingAndDistributionsMember
2023-01-01
2023-12-31
0000778164
alto:MarketingAndDistributionsMember
2022-01-01
2022-12-31
0000778164
alto:WesternProductionMember
2024-01-01
2024-12-31
0000778164
alto:WesternProductionMember
2023-01-01
2023-12-31
0000778164
alto:WesternProductionMember
2022-01-01
2022-12-31
0000778164
alto:PekinCampusProductionMember
2024-12-31
0000778164
alto:PekinCampusProductionMember
2023-12-31
0000778164
alto:MarketingAndDistributionsMember
2024-12-31
0000778164
alto:MarketingAndDistributionsMember
2023-12-31
0000778164
alto:WesternProductionMember
2024-12-31
0000778164
alto:WesternProductionMember
2023-12-31
0000778164
us-gaap:CorporateAndOtherMember
2024-12-31
0000778164
us-gaap:CorporateAndOtherMember
2023-12-31
0000778164
alto:KinergyTradenameMember
2024-01-01
2024-12-31
0000778164
us-gaap:CustomerRelationshipsMember
2024-01-01
2024-12-31
0000778164
alto:EagleAlcoholTradenameMember
2024-01-01
2024-12-31
0000778164
alto:CustomerRelationshipsAndTradenameMember
2024-01-01
2024-12-31
0000778164
us-gaap:GoodwillMember
2024-12-31
0000778164
us-gaap:GoodwillMember
2023-12-31
0000778164
alto:KinergyTradenameMember
2024-12-31
0000778164
alto:KinergyTradenameMember
2023-12-31
0000778164
us-gaap:CustomerRelationshipsMember
2024-12-31
0000778164
us-gaap:CustomerRelationshipsMember
2023-12-31
0000778164
alto:EagleAlcoholTradenameMember
2024-12-31
0000778164
alto:EagleAlcoholTradenameMember
2023-12-31
0000778164
alto:CashCollateralBalanceMember
2024-12-31
0000778164
us-gaap:CommodityContractMember
2024-12-31
0000778164
alto:CashCollateralBalanceMember
2023-12-31
0000778164
us-gaap:CommodityContractMember
2023-12-31
0000778164
alto:RealizedGainsLossesMember
us-gaap:CommodityContractMember
us-gaap:CostOfSalesMember
2024-01-01
2024-12-31
0000778164
alto:RealizedGainsLossesMember
us-gaap:CommodityContractMember
us-gaap:CostOfSalesMember
2023-01-01
2023-12-31
0000778164
alto:RealizedGainsLossesMember
us-gaap:CommodityContractMember
us-gaap:CostOfSalesMember
2022-01-01
2022-12-31
0000778164
alto:RealizedGainsLossesMember
us-gaap:CostOfSalesMember
2024-01-01
2024-12-31
0000778164
alto:RealizedGainsLossesMember
us-gaap:CostOfSalesMember
2023-01-01
2023-12-31
0000778164
alto:RealizedGainsLossesMember
us-gaap:CostOfSalesMember
2022-01-01
2022-12-31
0000778164
alto:UnrealizedGainsLossesMember
us-gaap:CommodityContractMember
us-gaap:CostOfSalesMember
2024-01-01
2024-12-31
0000778164
alto:UnrealizedGainsLossesMember
us-gaap:CommodityContractMember
us-gaap:CostOfSalesMember
2023-01-01
2023-12-31
0000778164
alto:UnrealizedGainsLossesMember
us-gaap:CommodityContractMember
us-gaap:CostOfSalesMember
2022-01-01
2022-12-31
0000778164
alto:UnrealizedGainsLossesMember
us-gaap:CostOfSalesMember
2024-01-01
2024-12-31
0000778164
alto:UnrealizedGainsLossesMember
us-gaap:CostOfSalesMember
2023-01-01
2023-12-31
0000778164
alto:UnrealizedGainsLossesMember
us-gaap:CostOfSalesMember
2022-01-01
2022-12-31
0000778164
srt:ScenarioForecastMember
alto:KinergyLineOfCreditMember
2027-11-07
0000778164
srt:MinimumMember
2024-01-01
2024-12-31
0000778164
srt:MaximumMember
2024-01-01
2024-12-31
0000778164
alto:KinergyLineOfCreditMember
2024-12-31
0000778164
alto:KinergyMember
2024-01-01
2024-12-31
0000778164
alto:AltoNutrientsMember
2024-01-01
2024-12-31
0000778164
alto:OrionTermLoanMember
2024-01-01
2024-12-31
0000778164
2022-11-23
2022-11-23
0000778164
2022-11-23
0000778164
alto:OrionTermLoanMember
2024-12-31
0000778164
2025-01-01
2025-01-01
0000778164
alto:IfLeverageRatioIsGreaterThanOrEqualToThreePointZeroxMember
2024-01-01
2024-12-31
0000778164
alto:IfTheLeverageRatioIsLessThanThreePointZeroxAndGreaterThanOrEqualToOnePointFivexMember
2024-01-01
2024-12-31
0000778164
alto:IfTheLeverageRatioIsLessThan15xMember
2024-01-01
2024-12-31
0000778164
alto:KinergyLineOfCreditMember
2023-12-31
0000778164
alto:OrionTermLoanMember
2023-12-31
0000778164
us-gaap:EquipmentMember
2024-12-31
0000778164
us-gaap:LandMember
2024-12-31
0000778164
us-gaap:EquipmentMember
2023-12-31
0000778164
us-gaap:LandMember
2023-12-31
0000778164
us-gaap:EquipmentMember
2024-12-31
0000778164
alto:LandRelatedMember
2024-12-31
0000778164
srt:ScenarioForecastMember
2025-01-01
2025-12-31
0000778164
us-gaap:DefinedBenefitPlanEquitySecuritiesMember
2024-12-31
0000778164
us-gaap:DefinedBenefitPlanDebtSecurityMember
2024-12-31
0000778164
alto:PreMedicarePostretirementMember
2024-12-31
0000778164
alto:PostretirementPlanMember
2024-01-01
2024-12-31
0000778164
alto:RetirementPlanMember
2023-12-31
0000778164
alto:RetirementPlanMember
2022-12-31
0000778164
alto:RetirementPlanMember
2024-01-01
2024-12-31
0000778164
alto:RetirementPlanMember
2023-01-01
2023-12-31
0000778164
alto:RetirementPlanMember
2024-12-31
0000778164
alto:RetirementPlanMember
2022-01-01
2022-12-31
0000778164
alto:PostretirementPlanMember
2023-01-01
2023-12-31
0000778164
alto:PostretirementPlanMember
2022-01-01
2022-12-31
0000778164
alto:PostretirementPlanMember
2024-12-31
0000778164
us-gaap:DomesticCountryMember
2024-12-31
0000778164
us-gaap:StateAndLocalJurisdictionMember
2024-12-31
0000778164
alto:TaxYear2025Member
2024-12-31
0000778164
alto:TaxYear2025Member
2024-01-01
2024-12-31
0000778164
alto:AssessmentMember
2024-12-31
0000778164
alto:AssessmentMember
2023-12-31
0000778164
alto:TwoThousandAndTwentyFiveAndTwoThousandAndTwentyNineMember
us-gaap:DomesticCountryMember
2024-12-31
0000778164
alto:TwoThousandAndTwentyFiveAndTwoThousandAndTwentyNineMember
us-gaap:StateAndLocalJurisdictionMember
2024-12-31
0000778164
alto:TwoThousandAndThirtyAndTwoThousandAndThirtyFourMember
us-gaap:DomesticCountryMember
2024-12-31
0000778164
alto:TwoThousandAndThirtyAndTwoThousandAndThirtyFourMember
us-gaap:StateAndLocalJurisdictionMember
2024-12-31
0000778164
alto:TwoThousandThirtyFiveAndTwoThousandAndThirtyNineMember
us-gaap:DomesticCountryMember
2024-12-31
0000778164
alto:TwoThousandThirtyFiveAndTwoThousandAndThirtyNineMember
us-gaap:StateAndLocalJurisdictionMember
2024-12-31
0000778164
alto:TwoThousandAndFortyAndAfterMember
us-gaap:DomesticCountryMember
2024-12-31
0000778164
alto:TwoThousandAndFortyAndAfterMember
us-gaap:StateAndLocalJurisdictionMember
2024-12-31
0000778164
alto:FederalMember
2024-01-01
2024-12-31
0000778164
alto:AlabamaMember
2024-01-01
2024-12-31
0000778164
alto:ArizonaMember
2024-01-01
2024-12-31
0000778164
alto:ArkansasMember
2024-01-01
2024-12-31
0000778164
alto:CaliforniaMember
2024-01-01
2024-12-31
0000778164
alto:ColoradoMember
2024-01-01
2024-12-31
0000778164
alto:ConnecticutMember
2024-01-01
2024-12-31
0000778164
alto:GeorgiaMember
2024-01-01
2024-12-31
0000778164
alto:IdahoMember
2024-01-01
2024-12-31
0000778164
alto:IllinoisMember
2024-01-01
2024-12-31
0000778164
alto:IndianaMember
2024-01-01
2024-12-31
0000778164
alto:IowaMember
2024-01-01
2024-12-31
0000778164
alto:KansasMember
2024-01-01
2024-12-31
0000778164
alto:LouisianaMember
2024-01-01
2024-12-31
0000778164
alto:MichiganMember
2024-01-01
2024-12-31
0000778164
alto:MinnesotaMember
2024-01-01
2024-12-31
0000778164
alto:MississippiMember
2024-01-01
2024-12-31
0000778164
alto:MissouriMember
2024-01-01
2024-12-31
0000778164
alto:NebraskaMember
2024-01-01
2024-12-31
0000778164
alto:NewMexicoMember
2024-01-01
2024-12-31
0000778164
alto:OklahomaMember
2024-01-01
2024-12-31
0000778164
alto:OregonMember
2024-01-01
2024-12-31
0000778164
alto:PennsylvaniaMember
2024-01-01
2024-12-31
0000778164
alto:RhodeIslandMember
2024-01-01
2024-12-31
0000778164
alto:SouthCarolinaMember
2024-01-01
2024-12-31
0000778164
alto:TennesseeMember
2024-01-01
2024-12-31
0000778164
alto:TexasMember
2024-01-01
2024-12-31
0000778164
srt:BoardOfDirectorsChairmanMember
2024-12-31
0000778164
us-gaap:SeriesAPreferredStockMember
2024-01-01
2024-12-31
0000778164
us-gaap:SeriesBPreferredStockMember
2024-01-01
2024-12-31
0000778164
2016-06-16
0000778164
alto:TwoThousandSixteenStockIncentivePlanMember
2018-06-14
0000778164
alto:TwoThousandSixteenStockIncentivePlanMember
2019-11-07
0000778164
alto:TwoThousandSixteenStockIncentivePlanMember
2020-11-18
0000778164
alto:TwoThousandSixteenStockIncentivePlanMember
2022-06-23
0000778164
alto:TwoThousandSixteenStockIncentivePlanMember
2023-06-22
0000778164
alto:TwoThousandSixteenStockIncentivePlanMember
2024-06-20
0000778164
us-gaap:RestrictedStockUnitsRSUMember
2022-12-31
0000778164
us-gaap:RestrictedStockUnitsRSUMember
2023-01-01
2023-12-31
0000778164
us-gaap:RestrictedStockUnitsRSUMember
2023-12-31
0000778164
us-gaap:RestrictedStockUnitsRSUMember
2024-01-01
2024-12-31
0000778164
us-gaap:RestrictedStockUnitsRSUMember
2024-12-31
0000778164
us-gaap:ShareBasedPaymentArrangementEmployeeMember
2024-01-01
2024-12-31
0000778164
us-gaap:ShareBasedPaymentArrangementEmployeeMember
2023-01-01
2023-12-31
0000778164
us-gaap:ShareBasedPaymentArrangementEmployeeMember
2022-01-01
2022-12-31
0000778164
us-gaap:ShareBasedPaymentArrangementNonemployeeMember
2024-01-01
2024-12-31
0000778164
us-gaap:ShareBasedPaymentArrangementNonemployeeMember
2023-01-01
2023-12-31
0000778164
us-gaap:ShareBasedPaymentArrangementNonemployeeMember
2022-01-01
2022-12-31
0000778164
alto:SalesCommitmentsMember
2024-01-01
2024-12-31
0000778164
alto:AlcoholSalesContractsMember
2024-12-31
0000778164
alto:AlcoholFromItsSuppliersMember
alto:EthanolPurchaseContractsMember
2024-01-01
2024-12-31
0000778164
alto:AlcoholFromItsSuppliersMember
alto:EthanolPurchaseContractsMember
2024-12-31
0000778164
alto:CornFromSuppliersMember
alto:EthanolPurchaseContractsMember
2024-12-31
0000778164
us-gaap:NaturalGasProductionMember
alto:EthanolPurchaseContractsMember
2024-01-01
2024-12-31
0000778164
alto:KodiakCarbonicLLCMember
2024-01-01
2024-12-31
0000778164
us-gaap:DerivativeFinancialInstrumentsAssetsMember
2024-12-31
0000778164
us-gaap:DerivativeFinancialInstrumentsAssetsMember
us-gaap:FairValueInputsLevel1Member
2024-12-31
0000778164
us-gaap:DerivativeFinancialInstrumentsAssetsMember
us-gaap:FairValueInputsLevel2Member
2024-12-31
0000778164
us-gaap:DerivativeFinancialInstrumentsAssetsMember
us-gaap:FairValueInputsLevel3Member
2024-12-31
0000778164
alto:LonglivedAssetsMagicValleyMember
2024-12-31
0000778164
alto:LonglivedAssetsMagicValleyMember
us-gaap:FairValueInputsLevel1Member
2024-12-31
0000778164
alto:LonglivedAssetsMagicValleyMember
us-gaap:FairValueInputsLevel2Member
2024-12-31
0000778164
alto:LonglivedAssetsMagicValleyMember
us-gaap:FairValueInputsLevel3Member
2024-12-31
0000778164
alto:LargeUSEquityMember
2024-12-31
0000778164
us-gaap:FairValueInputsLevel1Member
alto:LargeUSEquityMember
2024-12-31
0000778164
us-gaap:FairValueInputsLevel2Member
alto:LargeUSEquityMember
2024-12-31
0000778164
us-gaap:FairValueInputsLevel3Member
alto:LargeUSEquityMember
2024-12-31
0000778164
alto:SmallMidUSEquityMember
2024-12-31
0000778164
us-gaap:FairValueInputsLevel1Member
alto:SmallMidUSEquityMember
2024-12-31
0000778164
us-gaap:FairValueInputsLevel2Member
alto:SmallMidUSEquityMember
2024-12-31
0000778164
us-gaap:FairValueInputsLevel3Member
alto:SmallMidUSEquityMember
2024-12-31
0000778164
alto:InternationalEquityMember
2024-12-31
0000778164
us-gaap:FairValueInputsLevel1Member
alto:InternationalEquityMember
2024-12-31
0000778164
us-gaap:FairValueInputsLevel2Member
alto:InternationalEquityMember
2024-12-31
0000778164
us-gaap:FairValueInputsLevel3Member
alto:InternationalEquityMember
2024-12-31
0000778164
alto:FixedIncomeMember
2024-12-31
0000778164
us-gaap:FairValueInputsLevel1Member
alto:FixedIncomeMember
2024-12-31
0000778164
us-gaap:FairValueInputsLevel2Member
alto:FixedIncomeMember
2024-12-31
0000778164
us-gaap:FairValueInputsLevel3Member
alto:FixedIncomeMember
2024-12-31
0000778164
us-gaap:FairValueInputsLevel1Member
2024-12-31
0000778164
us-gaap:FairValueInputsLevel2Member
2024-12-31
0000778164
us-gaap:FairValueInputsLevel3Member
2024-12-31
0000778164
us-gaap:DerivativeFinancialInstrumentsLiabilitiesMember
2024-12-31
0000778164
us-gaap:FairValueInputsLevel1Member
us-gaap:DerivativeFinancialInstrumentsLiabilitiesMember
2024-12-31
0000778164
us-gaap:FairValueInputsLevel2Member
us-gaap:DerivativeFinancialInstrumentsLiabilitiesMember
2024-12-31
0000778164
us-gaap:FairValueInputsLevel3Member
us-gaap:DerivativeFinancialInstrumentsLiabilitiesMember
2024-12-31
0000778164
us-gaap:DerivativeFinancialInstrumentsAssetsMember
us-gaap:FairValueInputsLevel1Member
2023-12-31
0000778164
us-gaap:DerivativeFinancialInstrumentsAssetsMember
us-gaap:FairValueInputsLevel2Member
2023-12-31
0000778164
us-gaap:DerivativeFinancialInstrumentsAssetsMember
us-gaap:FairValueInputsLevel3Member
2023-12-31
0000778164
us-gaap:DerivativeFinancialInstrumentsAssetsMember
2023-12-31
0000778164
us-gaap:FairValueInputsLevel1Member
alto:LargeUSEquityMember
2023-12-31
0000778164
us-gaap:FairValueInputsLevel2Member
alto:LargeUSEquityMember
2023-12-31
0000778164
us-gaap:FairValueInputsLevel3Member
alto:LargeUSEquityMember
2023-12-31
0000778164
alto:LargeUSEquityMember
2023-12-31
0000778164
us-gaap:FairValueInputsLevel1Member
alto:SmallMidUSEquityMember
2023-12-31
0000778164
us-gaap:FairValueInputsLevel2Member
alto:SmallMidUSEquityMember
2023-12-31
0000778164
us-gaap:FairValueInputsLevel3Member
alto:SmallMidUSEquityMember
2023-12-31
0000778164
alto:SmallMidUSEquityMember
2023-12-31
0000778164
us-gaap:FairValueInputsLevel1Member
alto:InternationalEquityMember
2023-12-31
0000778164
us-gaap:FairValueInputsLevel2Member
alto:InternationalEquityMember
2023-12-31
0000778164
us-gaap:FairValueInputsLevel3Member
alto:InternationalEquityMember
2023-12-31
0000778164
alto:InternationalEquityMember
2023-12-31
0000778164
us-gaap:FairValueInputsLevel1Member
alto:FixedIncomeMember
2023-12-31
0000778164
us-gaap:FairValueInputsLevel2Member
alto:FixedIncomeMember
2023-12-31
0000778164
us-gaap:FairValueInputsLevel3Member
alto:FixedIncomeMember
2023-12-31
0000778164
alto:FixedIncomeMember
2023-12-31
0000778164
us-gaap:FairValueInputsLevel1Member
2023-12-31
0000778164
us-gaap:FairValueInputsLevel2Member
2023-12-31
0000778164
us-gaap:FairValueInputsLevel3Member
2023-12-31
0000778164
us-gaap:FairValueInputsLevel1Member
us-gaap:DerivativeFinancialInstrumentsLiabilitiesMember
2023-12-31
0000778164
us-gaap:FairValueInputsLevel2Member
us-gaap:DerivativeFinancialInstrumentsLiabilitiesMember
2023-12-31
0000778164
us-gaap:FairValueInputsLevel3Member
us-gaap:DerivativeFinancialInstrumentsLiabilitiesMember
2023-12-31
0000778164
us-gaap:DerivativeFinancialInstrumentsLiabilitiesMember
2023-12-31
0000778164
alto:KodiakCarbonicLLCMember
us-gaap:SubsequentEventMember
2025-01-01
0000778164
us-gaap:SubsequentEventMember
2025-01-01
iso4217:USD
xbrli:shares
iso4217:USD
xbrli:shares
utr:gal
utr:T
xbrli:pure
utr:dth
SECOND AMENDMENT TO CREDIT AGREEMENT This SECOND AMENDMENT TO CREDIT AGREEMENT (this Amendment ), dated as of November 6 , 2024 (the Second Amendment Effective Date ), by and between Alto Ingredients, Inc . , a Delaware corporation ( Borrower ), and OIC Investment Agent, LLC, a Delaware limited liability company, as Administrative Agent and Collateral Agent, (in such capacities, Administrative Agent ) . Borrower and Administrative Agent may occasionally be referred to collectively herein as the Parties or individually as a Party . WHEREAS , Borrower and Administrative Agent entered into that certain Credit Agreement dated as of November 7 , 2022 , among Borrower, the Subsidiary Guarantors signatory thereto, the Lenders from time to time party thereto, and Administrative Agent, as Administrative Agent and Collateral Agent (as amended by that certain First Amendment to Credit Agreement dated as of November 6 , 2023 , the Existing Credit Agreement and the Existing Credit Agreement as expressly amended by this Amendment, the Credit Agreement ) ; WHEREAS , pursuant and subject to Section 10 . 02 (b) of the Credit Agreement, the Parties now desire to modify certain portions of the Existing Credit Agreement, all as set forth herein . NOW, THEREFORE , for and in consideration of the mutual covenants and premises set forth herein, the receipt and sufficiency of which are hereby acknowledged, and intending to be legally bound hereby, the Parties agree as follows : Section 1 . Amendments to the Existing Credit Agreement . Effective as of the Second Amendment Effective Date, each of Administrative Agent (acting on behalf of the Required Lenders) and Borrower hereby agrees to amend the Existing Credit Agreement as follows : (a) Section 1 . 01 of the Existing Credit Agreement is hereby amended to amend and restate each of the following definitions set forth therein, each to read in their entirety as follows : Adjusted EBITDA means, for any date of determination, an amount equal to Consolidated EBITDA. Consolidated EBITDA means, for any period, an amount equal to consolidated EBITDA for such period as publicly filed or reported. Excess Cash Flow means, for any period: (a) Consolidated EBITDA for such period, less (b) the sum, without duplication, of : (i) the aggregate amount of all principal payments under this Agreement made in cash during such period (including the amount of any scheduled repayment of Loans pursuant 1
to Section 2 . 04 , any voluntary prepayments pursuant to Section 2 . 05 (a) and any mandatory prepayments pursuant to Section 2 . 05 (b) but excluding mandatory prepayments pursuant to Section 2 . 05 (b)(iv) ) ; (ii) the aggregate amount of all interest payments under this Agreement and the ABL Credit Agreement made in cash during such period ; (iii) any amounts paid in cash in connection with the Loans during such period to the extent not funded with Indebtedness ; (iv) the aggregate amount of Capital Expenditures incurred in accordance with the Capital Expenditures Plan and Budget and paid in cash during such period to the extent financed with internally generated cash ; (v) the aggregate amount of scheduled fees and other similar fees payable under the Financing Documents paid in cash during such period ; (vi) the aggregate amount of cash taxes paid by the Loan Parties in such period ; (vii) the aggregate amount necessary to meet the Minimum Liquidity Threshold ; and (viii) the aggregate amount of any Restricted Payments made pursuant to Section 6 . 06 (f) in such period ; plus (c) the sum, without duplication, of the Net Proceeds of any extraordinary, non - recurring or unusual cash income or gains of the Loan Parties for such period, in each case to the extent not included in Consolidated EBITDA for such period . Notwithstanding anything in the definition of any term used in the definition of Excess Cash Flow to the contrary, all components of Excess Cash Flow shall be computed for the Loan Parties on a consolidated basis . Incremental Commitment Expiration Date means April 7 , 2026 . Specified CapEx Commitment Expiration Date means April 7 , 2026 . Section 2 . CO 2 Transportation and Sequestration Agreement . Parties agree and acknowledge that (a) Alto Pekin, LLC, a Subsidiary of the Borrower, and Vault Dragon CCS Holdings LP, a Delaware limited partnership, are contemplating entering into that certain CO 2 Transportation and Sequestration Agreement and (b) other than as set forth in the Credit Agreement, Administrative Agent has not consented to any credit support, guarantee or other form of Indebtedness of the Borrower related thereto . Section 3. Representations and Warranties . 2
(a) Authorization, Etc . Borrower has full corporate, limited liability company, limited partnership or other organizational powers, authority and legal right to enter into, deliver and perform its respective obligations under this Amendment and to consummate each of the transactions contemplated herein, and has taken all necessary corporate, limited liability company, limited partnership or other organizational action to authorize the execution, delivery and performance by it of this Amendment . This Amendment has been duly executed and delivered by Borrower and is in full force and effect and constitutes a legal, valid and binding obligation of Borrower, enforceable against Borrower in accordance with its terms, except as enforcement may be limited (i) by Bankruptcy, insolvency, reorganization, moratorium, fraudulent conveyance or other similar laws affecting creditors' rights generally, (ii) by general principles of equity (regardless of whether such enforceability is considered in a proceeding in equity or at law) or (iii) by implied covenants of good faith and fair dealing . (b) No Conflict . The execution, delivery and performance by Borrower of this Amendment, as well as the consummation of the transactions contemplated herein, do not and will not (i) conflict with the Organizational Documents of Borrower, (ii) conflict with or result in a breach of, or constitute a default under, any indenture, loan agreement, mortgage, deed of trust or other instrument or agreement to which any Loan Party is a party or by which it is bound or to which any Loan Party's property or assets are subject, except where such contravention, breach or default, individually or in the aggregate, could not reasonably be expected to result in a Material Adverse Effect, (iii) conflict with or result in a breach of, or constitute a default under, in any material respect, any Applicable Law (including, assuming the accuracy of the representations and warranties of the Lenders set forth in a certificate or certificates delivered by the Lenders to Borrower at or prior to any issuance of Participation Shares, federal and state securities laws and regulations and the rules and regulations of any self - regulatory organization to which Borrower or its securities are subject), except where such contravention or breach could not reasonably be expected to have a Material Adverse Effect, or (iv) with respect to each Loan Party, result in the creation or imposition of any Lien (other than a Permitted Lien) upon any Loan Party's property or the Collateral . (c) No Default or Event of Default has occurred and is continuing. (d) The representations and warranties of each Loan Party set forth in the Financing Documents are true and correct in all material respects (except where already qualified by materiality or Material Adverse Effect, in which case, such representations and warranties are true and correct in all respects) on and as of the Second Amendment Effective Date (unless stated to relate solely to an earlier date, in which case such representations and warranties were true and correct as of such earlier date) . Section 4. Miscellaneous . (a) This Amendment shall become effective on the date first set forth above . On and after the Second Amendment Effective Date, each reference in the Credit Agreement to this Agreement , hereunder , hereof' or words of like import, referring to 3
the Credit Agreement and each reference in each other Financing Document to the Credit Agreement , thereunder , thereof' or words of like import referring to the Credit Agreement shall mean and be a reference to the Existing Credit Agreement as amended or otherwise modified by this Amendment . This Amendment shall constitute a Financing Document for purposes of the Credit Agreement . (b) THIS AMENDMENT AND THE RIGHTS AND OBLIGATIONS OF THE PARTIES UNDER THIS AMENDMENT AND ANY DISPUTE OF CLAIMS ARISING IN CONNECTION THEREWITH SHALL BE GOVERNED BY, AND CONSTRUED AND INTERPRETED IN ACCORDANCE WITH, THE LAW OF THE STATE OF NEW YORK . (c) Except as expressly set forth in this Amendment, all other terms and conditions of the Credit Agreement shall remain in full force and effect and the execution, delivery and effectiveness of this Amendment shall not operate as a waiver of any default of Borrower or any right, power or remedy of Administrative Agent or the Lenders under any of the Financing Documents, nor constitute a waiver of any provision of any of the Financing Documents . All capitalized terms used herein and not otherwise defined or redefined herein shall have the meanings assigned to them in the Credit Agreement, and all terms defined or redefined herein shall be given the meaning set out herein . (d) Sections 10 . 07 (Severability), 10 . 09 (Governing Law ; Jurisdiction ; Etc . ) and 10 . 11 (Headings) of the Credit Agreement are hereby incorporated by reference herein, mutatis mutandis . (e) This Amendment shall constitute an integral part of the Credit Agreement and be effective as stipulated above and upon signature by the respective Parties and shall remain valid until the date the Credit Agreement expires or otherwise terminates . (f) The undersigned hereby acknowledge that it has read and fully understands the terms of this Amendment, the terms and conditions of which are hereby incorporated and acknowledged by this reference . This Amendment may be executed in one or more counterparts, each of which shall be deemed an original, but all of which together shall constitute one and the same instrument . This Amendment is binding upon and shall inure to the benefit of Administrative Agent, the Lenders and the Loan Parties and their respective successors and permitted assigns . (g) The undersigned individuals certify that they are competent and authorized to enter into this Amendment on behalf of the Party for whom he or she purports to sign . [ Signature Pages Follow ] 4
IN WITNESS WHEREOF, the Parties, by their authorized representatives, have duly executed this Amendment as of the Second Amendment Effective Date. ALTO INGREDIENTS, INC., as the Borrower By: Name: Robert R. Olander Title: CFO [ Signature Page to Alto Second Amendment to Credit Agreement ]
OIC INVESTMENT AGENT, LLC , as Administrative Agent By: Name: Ethan Shoemaker Title: Investment Partner [ Signature Page to Alto Second Amendment to Credit Agreement ]
If you are aware of material non-public information relating to Alto Ingredients, you are prohibited from trading in Alto Ingredients securities, directly or indirectly and from disclosing such information to any other persons (including Family Members, friends, brokers, investment advisers, etc.).
The term “non-public information” is information which has not been sufficiently disseminated to the public marketplace so that purchasers and sellers alike are on equal footing regarding the information. It is information from a source within Alto Ingredients or from a source to which Alto Ingredients owes a duty of confidentiality. As a practical matter, it is sometimes difficult to determine whether you possess non-public information. Any information, positive or negative, is “material” if it would be expected to (i) affect the decision of a reasonable investor in determining whether to purchase, sell or hold Alto Ingredients securities or (ii) significantly alter the market price of Alto Ingredients securities. Information may be material for this purpose even if it would not alone determine the investor’s decision. While it may be difficult under this standard to determine whether particular non-public information is material, there are various categories of information that are particularly sensitive and, as a general rule, should always be considered potentially material.
It is important to note that the above
list is merely illustrative and other information not mentioned on the above list may be considered material non-public information.
The following guidelines should be
followed in order to ensure compliance with applicable laws and with this Policy Statement:
The prohibitions and guidelines discussed
above do not prevent you from trading under a written plan (a “Rule 10b5-1 Plan”) that has been adopted in conformity
with Rule 10b5-1 under the Securities Exchange Act of 1934, as amended
(the “Exchange Act”). See Section 7.0 below for a discussion of Rule 10b5-1 Plans.
No Covered Person or any Family Member
or Controlled Entity of a Covered Person, in the course of such Covered Person’s employment or involvement with Alto Ingredients
who knows of or obtains any material non-public information regarding another company may communicate that information except to persons
within Alto Ingredients whose positions require them to know it, or third parties who, due to the nature of their work with Alto Ingredients,
have a need to know, and who are subject to an obligation to keep such information confidential. No Covered Person, nor any of a Covered
Person’s Family Members or Controlled Entities, may place a purchase or sale order, offer to purchase or sell, or recommend that
another person place a purchase or sale order, in the securities of another company, if, in the course of such Covered Person’s
employment or involvement with Alto Ingredients (directly or through a Family Member who is a director, officer, or employee of Alto Ingredients),
such person learns or possesses material non-public information about the other company that is likely to affect the value of those securities.
For example, it would be a violation of the securities laws and this Policy Statement if a Covered Person learned confidential information
in the course of such Covered Person’s employment or involvement with Alto Ingredients that Alto Ingredients intended to purchase
assets from (or securities of) another company, and then placed an order to buy or sell securities in that other company because of the
likely increase or decrease in the value of such company’s securities. Similarly, it would be a violation to place an order to buy
or sell securities of a supplier, customer, or competitor of Alto Ingredients after obtaining material non-public information about such
supplier, customer, or competitor through a person’s employment or involvement with Alto Ingredients.
Generally, except as set forth below,
all directors and officers of Alto Ingredients, all employees of the accounting department of Alto Ingredients, and all other persons
who are notified by the Chief Legal Officer that they are subject to Alto Ingredients’ trading window policy (collectively, the
“Restricted Group”), may not buy or sell stock or other securities of Alto Ingredients except during a “trading
window period” that begins at 9:30 am Eastern Time on the third (3rd) business day after the earlier of (a) the issuance
of Alto Ingredients’ quarterly earnings press release, or (b) the filing with the SEC of Alto Ingredients’ annual or quarterly
reports, and ends at 4:00 pm Eastern Time on the fifteenth (15th) day of the last calendar month of the then current fiscal
quarter (i.e., March, June, September and December), except with respect to the fourth fiscal quarter. During the fourth fiscal quarter,
the “trading window period” will not open again until 9:30 am Eastern Time on the third (3rd) business day after
the earlier of (i) the issuance of Alto Ingredients’ annual earnings press release that includes a discussion
of fourth quarter earnings, or (ii) the filing of Alto Ingredients’ annual report on Form 10-K with the SEC.
This “trading window period”
may be closed early or may not open if, in the judgment of the Chief Executive Officer or the Chief Financial Officer each in consultation
with the Chief Legal Officer, there exists undisclosed information that would make trades by members of the Restricted Group inappropriate.
Anyone who is subject to the “trading window period” policy who believes that special circumstances require him or her to
trade outside the “trading window period” (i.e., during a “trading blackout period”) should consult with the Chief
Legal Officer. Permission to trade during a “trading blackout period” will be granted only where the circumstances are extenuating
and there appears to be no significant risk that the trade may subsequently be questioned.
In some circumstances, standing trading
orders to buy or sell Alto Ingredients’ securities extend beyond the open “trading window period” into a “trading
blackout period”. As a result, members of the Restricted Group and other Covered Persons could be in the position of buying or selling
Alto Ingredients securities based on such pre-existing orders during the “trading blackout period” or while in possession
of material, non-public information, each of which is a violation of this Policy Statement. Consequently, members of the Restricted Group
should not place trading orders with brokers that extend into “trading blackout periods,” and must immediately cancel any
such orders that inadvertently extend into blackout periods to prevent trades after close of the applicable open “trading window
period”. Rule 10b5-1 Plans (as described in Section 7.0 below), which generally may operate without regard for open “trading
window periods” or “trading blackout periods,” are the appropriate vehicle for such automated trading programs.
All directors, officer and employees
of Alto Ingredients, even those not considered part of the Restricted Group, must first pre-clear any transaction in Alto Ingredients’
securities with the Chief Legal Officer at least two (2) days in advance of the proposed transaction, as provided below. This pre-clearance
requirement is intended to permit Alto Ingredients to provide assistance in meeting reporting requirements, to monitor insider trading
concerns and to avoid even the appearance of impropriety (which could result, for example, where an employee engages in a trade while
unaware of a pending major development). The pre-clearance requirement applies to any purchase or sale in the open market or other transfer
of beneficial ownership including certain gifts or the exercise of an outstanding stock option. Directors, officers and employees contemplating
transactions in Alto Ingredients’ securities should contact the Chief Legal Officer personally, or send notice by email to “[REDACTED].”
The Chief Legal Officer will then determine whether the transaction may proceed. Any clearance
(i) granted for directors and executive officers will be effective only until the end of the second (2nd) trading day following
the day the approval is given, and (ii) granted for non-executive officers and other employees will be effective until the end of the
fifth (5th) trading day following the day the approval is given. Alto Ingredients may, at its discretion, shorten such period
of time for non-executive officers and other employees.
The prohibitions set forth above do apply to
certain bona fide gifts of Company stock. Directors, officers and employees of Alto Ingredients may not make a gift or
donation of Alto Ingredients stock while aware of material non-public information or during a blackout period, if the director,
officer or employee of Alto Ingredients (i) anticipates that the gift or donation recipient will sell the securities before the
non-public information is made public or before the blackout period expires, as applicable, or (ii) will receive value related to
the gift or donation (e.g., the director, officer or employee of Alto Ingredients would receive a tax deduction related to a
charitable donation). With respect to other bona fide gifts of Alto Ingredients stock and transfers of Alto Ingredients stock to a
family trust that is controlled by a director, officer or other insider of Alto Ingredients, the prohibitions on trading and the
preclearance procedures discussed above do not apply. However, directors, executive officers and other insiders of Alto
Ingredients are responsible for communicating the requirements of this Policy Statement to the recipient(s) of such gifts or
transfers if they are made to Controlled Entities or Family Members.
All directors, officers and employees as well as their respective Family Members are prohibited from engaging in the following activities:
Covered Persons are prohibited from pledging
securities of Alto Ingredients as collateral for a loan because such pledged securities might be sold at a time when the borrower is aware
of material non-public information or is otherwise not permitted to trade. In addition, if a Covered Person terminates service or employment
with Alto Ingredients and is aware of material non-public information, such Covered Person may not engage in any transaction in Alto Ingredients’
securities until that information has become public or is no longer material.
We consent to the incorporation by reference in Registration Statements
(Nos. 333-250180, 333-266035, 333-272836 and 333-280351) on Form S-8 and (Nos. 333-268583 and 333-272884) on Form S-3 of Alto Ingredients,
Inc. of our reports dated March 13, 2025, relating to the consolidated financial statements and the effectiveness of internal control
over financial reporting of Alto Ingredients, Inc., appearing in this Annual Report on Form 10-K of Alto Ingredients, Inc. for the year
ended December 31, 2024.
I, Bryon T. McGregor, certify that:
1. I have reviewed this Annual Report on Form
10-K of Alto Ingredients, Inc.;
2. Based on my knowledge, this report does not
contain any untrue statement of a material fact or omit to state a material fact necessary to make the statements made, in light of the
circumstances under which such statements were made, not misleading with respect to the period covered by this report;
3. Based
on my knowledge, the financial statements, and other financial information included in this report, fairly present in all material respects
the financial condition, results of operations and cash flows of the registrant as of, and for, the periods presented in this report;
4. The registrant’s other certifying officer(s)
and I are responsible for establishing and maintaining disclosure controls and procedures (as defined in Exchange Act Rules 13a-15(e)
and 15d-15(e)) and internal control over financial reporting (as defined in Exchange Act Rules 13a-15(f) and 15d-15(f)) for the registrant
and have:
(a) Designed such disclosure controls and procedures,
or caused such disclosure controls and procedures to be designed under our supervision, to ensure that material information relating to
the registrant, including its consolidated subsidiaries, is made known to us by others within those entities, particularly during the
period in which this report is being prepared;
(b) Designed such internal control over financial
reporting, or caused such internal control over financial reporting to be designed under our supervision, to provide reasonable assurance
regarding the reliability of financial reporting and the preparation of financial statements for external purposes in accordance with
generally accepted accounting principles;
(c) Evaluated the effectiveness of the registrant’s
disclosure controls and procedures and presented in this report our conclusions about the effectiveness of the disclosure controls and
procedures, as of the end of the period covered by this report based on such evaluation; and
(d) Disclosed in this report any change in the
registrant’s internal control over financial reporting that occurred during the registrant’s most recent fiscal quarter (the
registrant’s fourth fiscal quarter in the case of an annual report) that has materially affected, or is reasonably likely to materially
affect, the registrant’s internal control over financial reporting; and
5. The registrant’s other certifying officer(s)
and I have disclosed, based on our most recent evaluation of internal control over financial reporting, to the registrant’s auditors
and the audit committee of the registrant’s board of directors (or persons performing the equivalent functions):
(a) All significant deficiencies and material
weaknesses in the design or operation of internal control over financial reporting which are reasonably likely to adversely affect the
registrant’s ability to record, process, summarize and report financial information; and
(b) Any fraud, whether or not material, that
involves management or other employees who have a significant role in the registrant’s internal control over financial reporting.
I, Robert R. Olander, certify that:
1. I have reviewed this Annual Report on Form
10-K of Alto Ingredients, Inc.;
2. Based on my knowledge, this report does not
contain any untrue statement of a material fact or omit to state a material fact necessary to make the statements made, in light of the
circumstances under which such statements were made, not misleading with respect to the period covered by this report;
3. Based
on my knowledge, the financial statements, and other financial information included in this report, fairly present in all material respects
the financial condition, results of operations and cash flows of the registrant as of, and for, the periods presented in this report;
4. The registrant’s other certifying officer(s)
and I are responsible for establishing and maintaining disclosure controls and procedures (as defined in Exchange Act Rules 13a-15(e)
and 15d-15(e)) and internal control over financial reporting (as defined in Exchange Act Rules 13a-15(f) and 15d-15(f)) for the registrant
and have:
(a) Designed such disclosure controls and procedures,
or caused such disclosure controls and procedures to be designed under our supervision, to ensure that material information relating to
the registrant, including its consolidated subsidiaries, is made known to us by others within those entities, particularly during the
period in which this report is being prepared;
(b) Designed such internal control over financial
reporting, or caused such internal control over financial reporting to be designed under our supervision, to provide reasonable assurance
regarding the reliability of financial reporting and the preparation of financial statements for external purposes in accordance with
generally accepted accounting principles;
(c) Evaluated the effectiveness of the registrant’s
disclosure controls and procedures and presented in this report our conclusions about the effectiveness of the disclosure controls and
procedures, as of the end of the period covered by this report based on such evaluation; and
(d) Disclosed in this report any change in the
registrant’s internal control over financial reporting that occurred during the registrant’s most recent fiscal quarter (the
registrant’s fourth fiscal quarter in the case of an annual report) that has materially affected, or is reasonably likely to materially
affect, the registrant’s internal control over financial reporting; and
5. The registrant’s other certifying officer(s)
and I have disclosed, based on our most recent evaluation of internal control over financial reporting, to the registrant’s auditors
and the audit committee of the registrant’s board of directors (or persons performing the equivalent functions):
(a) All significant deficiencies and material
weaknesses in the design or operation of internal control over financial reporting which are reasonably likely to adversely affect the
registrant’s ability to record, process, summarize and report financial information; and
(b) Any fraud, whether or not material, that
involves management or other employees who have a significant role in the registrant’s internal control over financial reporting.
In connection with the Annual
Report on Form 10-K of Alto Ingredients, Inc. (the “Company”) for the year ended December 31, 2024 (the “Report”),
the undersigned hereby certify in their capacities as Chief Executive Officer and Chief Financial Officer of the Company, respectively,
pursuant to 18 U.S.C. Section 1350, as adopted pursuant to Section 906 of the Sarbanes-Oxley Act of 2002, that:
1. the
Report fully complies with the requirements of Section 13(a) or 15(d) of the Securities Exchange Act of 1934, as amended; and
2. the
information contained in the Report fairly presents, in all material respects, the financial condition and results of operations of the
Company.
A signed original of this written
statement required by Section 906, or other document authenticating, acknowledging, or otherwise adopting the signatures that appear in
typed form within the electronic version of this written statement required by Section 906, has been provided to the Company and will
be retained by the Company and furnished to the Securities and Exchange Commission or its staff upon request.
