Pay vs Performance Disclosure - USD ($)
|
12 Months Ended |
|
Jan. 31, 2024 |
Jan. 31, 2023 |
Jan. 31, 2022 |
Nov. 17, 2021 |
| Pay vs Performance Disclosure |
|
|
|
|
| Pay vs Performance Disclosure, Table |
PAY VERSUS PERFORMANCE The following table sets forth the compensation for our Chief Executive Officer (“CEO”) and the average compensation for our other named executive officers (“Other NEOs”) for the 2024, 2023 and 2022 fiscal years (each, a “Covered Year”), both as reported in the Summary Compensation Table (“SCT”) and with certain adjustments to reflect the “compensation actually paid” to such individuals, as calculated in accordance with rules adopted by the SEC in August 2022. “Compensation actually paid” does not reflect amounts actually realized by our CEO and Other NEOs and may be higher or lower than the amounts, if any, that are ultimately realized by such individuals. Our compensation committee did not consider “compensation actually paid”, as defined by the SEC, when making its executive compensation decisions for the Covered Years. Please see the Compensation Discussion and Analysis section in this proxy statement for a discussion of our compensation committee’s philosophy, objectives, and practices when making executive compensation decisions. The table below also provides information for each Covered Year on our cumulative total shareholder return (“TSR”) and the cumulative TSR of our peer group (with each such TSR determined for the period commencing on November 17, 2021, the date that our Class A common stock began trading on Nasdaq (the “IPO Date”)), our Net (loss) income and our Revenue. We selected Revenue as our “most important financial performance measure” used to link “compensation actually paid” to our CEO and Other NEOs to our performance for the 2024 fiscal year, because both ACV and RR, which were the two corporate performance factors for purposes of our performance-based cash bonus awards for the 2024 fiscal year, were derived from Revenue. Fiscal Year | | | SCT Total
for CEO
($) | | | Compensation
Actually Paid
to CEO
($)(1)(2) | | | SCT Average
Total for
Other NEOs
($)(3) | | | Average
Compensation
Actually Paid
to Other
NEOs
($)(2)(3)(4) | | | Value of Initial Fixed $100
Investment Based on: | | | Net (loss)
Income
($, in
thousands)(6) | | | Revenue
($, in
thousands)(7) | | | Braze Total
Shareholder
Return
($) | | | Peer Group
Total
Shareholder
Return
($)(5) | | 2024 Fiscal year | | | 11,960,363 | | | 27,793,381 | | | 5,548,473 | | | 10,642,809 | | | 57.88 | | | 112.14 | | | (130,429) | | | 471,800 | 2023 Fiscal year | | | 666,824 | | | (22,632,921)(8) | | | 491,642 | | | (4,926,253) | | | 34.26 | | | 72.40 | | | (140,746) | | | 355,426 | 2022 Fiscal year | | | 29,342,548 | | | 45,747,857(8) | | | 8,502,896 | | | 13,019,701 | | | 53.56 | | | 93.37 | | | (78,167) | | | 238,035 |
(1)
| The following table shows for each Covered Year the adjustments made to the total compensation shown for our CEO, William Magnuson, on the SCT to arrive at “compensation actually paid” as reflected on the table above: |
Adjustments to Determine CEO Compensation Actually Paid | | | 2024 Fiscal year | | | 2023 Fiscal year | | | 2022 Fiscal year | SCT total amount | | | $11,960,363 | | | $666,824 | | | $29,342,548 | Less Amounts Reported under “Option Awards” and “Stock Awards” Columns in SCT for the Covered Year | | | $10,984,152 | | | — | | | $28,528,500 | Plus Year-end Fair Value of Stock Options Awards and Stock Awards Granted during Covered Year that Remain Unvested as of Year-end | | | $14,407,946 | | | — | | | $35,634,819(8) | Plus Fair Value on Vesting of Stock Option Awards and Stock Awards Granted during Covered Year that Vest during Covered Year | | | $2,485,381 | | | — | | | — | Change (positive or negative) in Fair Value from Prior Year-end to Covered Year-end of Option Awards and Stock Awards Granted Prior to Covered Year that were Outstanding and Unvested as of Covered Year-end | | | $8,281,681 | | | $(15,931,157)(8) | | | $3,620,163 | Change (positive or negative) in Fair Value from Prior Year-end to Vesting Date of Stock Option Awards and Stock Awards Granted Prior to Covered Year that Vested during Covered Year | | | $1,642,162 | | | $(7,368,588)(8) | | | $5,678,827 | TOTAL ADJUSTMENTS: | | | $15,833,018 | | | $(23,299,745)(8) | | | $16,405,309(8) | TOTAL COMPENSATION ACTUALLY PAID: | | | $27,793,381 | | | $(22,632,921)(8) | | | $45,747,857(8) |
(2)
| For purposes of the adjustments to determine “compensation actually paid”, we computed the fair value of stock option awards and RSUs in accordance with FASB ASC Topic 718 as of the end of the relevant fiscal year, other than the fair values of equity awards that vested in the Covered Year, which are valued as of the applicable vesting date. The valuation assumptions used in the calculation of such amounts (as updated for purposes of this disclosure to reflect the relevant dates for purposes of calculating fair value) are set forth in Note 12 to our audited consolidated financial statements included in our Annual Report on Form 10-K for the 2024 fiscal year. |
(3)
| The Other NEOs for the 2024 and 2023 fiscal years were Isabelle Winkles, Jonathan Hyman, Myles Kleeger and Susan Wiseman. The Other NEOs for the 2022 fiscal year were Jonathan Hyman and Myles Kleeger. |
(4)
| The following table shows for each Covered Year presented the adjustments made to the average of the total compensation shown for the Other NEOs on the SCT to arrive at “compensation actually paid” as reflected on the table above: |
Adjustments to Determine Average Other NEO Compensation Actually Paid | | | 2024 Fiscal year | | | 2023 Fiscal year | | | 2022 Fiscal year | SCT total amount | | | 5,548,473 | | | $491,642 | | | $8,502,896 | Less Amounts Reported under “Option Awards” and “Stock Awards” Column in SCT for the Covered Year | | | 4,882,188 | | | — | | | $7,843,500 | Plus Year-end Fair Value of Stock Options Awards and Stock Awards Granted during Covered Year that Remain Unvested as of Year-end | | | 6,403,993 | | | — | | | $9,773,402 | Plus Fair Value on Vesting of Stock Option Awards and Stock Awards Granted during Covered Year that Vest during Covered Year | | | 1,104,687 | | | — | | | — | Change (positive or negative) in Fair Value from Prior Year-end to Covered Year-end of Stock Option Awards and Stock Awards Granted Prior to Covered Year that were Outstanding and Unvested as of Covered Year-end | | | 1,727,978 | | | $(3,626,644) | | | $898,246 | Change (positive or negative) in Fair Value from Prior Year-end to Vesting Date of Stock Option Awards and Stock Awards Granted Prior to Covered Year that Vested during Covered Year | | | 739,866 | | | $(1,791,251) | | | $1,688,657 | TOTAL ADJUSTMENTS: | | | 5,094,336 | | | $(5,417,895) | | | $4,516,805 | TOTAL AVERAGE COMPENSATION ACTUALLY PAID: | | | 10,642,809 | | | $(4,926,253) | | | $13,019,701 |
(5)
| Total Shareholder Return shown in this table utilizes the Nasdaq Computer Index, which is the index included in the stock performance graph required by Item 201(e) of Regulation S-K in this proxy statement. The comparison assumes $100.00 was invested in our Class A common stock and the Nasdaq Computer Index at their respective closing prices on the IPO Date and ending on January 31 of each Covered Year. All dollar values assume reinvestment of the pre-tax value of dividends paid by companies included in the Nasdaq Computer Index. The historical stock price performance of our Class A common stock shown is not necessarily indicative of future stock price performance. |
(6)
| Reflects “Net (loss) income” for each Covered Year as set forth in our Consolidated Statements of Operations included in our Annual Report on Form 10-K for each of the Covered Years. For the avoidance of doubt, “Net (loss) income” is a GAAP measure. |
(7)
| Reflects “Revenue” for each Covered Year as set forth in our Consolidated Statements of Operations included in our Annual Report on Form 10-K for each of the Covered Years. For the avoidance of doubt, “Revenue” is a GAAP measure. |
(8)
| The amount reported in our proxy statement for our 2023 Fiscal Year has been corrected in this proxy statement to resolve an administrative error relating to the fair value calculation of option awards in applicable periods. |
|
|
|
|
| Company Selected Measure Name |
Revenue
|
|
|
|
| Named Executive Officers, Footnote |
(1)
| The following table shows for each Covered Year the adjustments made to the total compensation shown for our CEO, William Magnuson, on the SCT to arrive at “compensation actually paid” as reflected on the table above: |
(3)
| The Other NEOs for the 2024 and 2023 fiscal years were Isabelle Winkles, Jonathan Hyman, Myles Kleeger and Susan Wiseman. The Other NEOs for the 2022 fiscal year were Jonathan Hyman and Myles Kleeger. |
|
|
|
|
| Peer Group Issuers, Footnote |
(5)
| Total Shareholder Return shown in this table utilizes the Nasdaq Computer Index, which is the index included in the stock performance graph required by Item 201(e) of Regulation S-K in this proxy statement. The comparison assumes $100.00 was invested in our Class A common stock and the Nasdaq Computer Index at their respective closing prices on the IPO Date and ending on January 31 of each Covered Year. All dollar values assume reinvestment of the pre-tax value of dividends paid by companies included in the Nasdaq Computer Index. The historical stock price performance of our Class A common stock shown is not necessarily indicative of future stock price performance. |
|
|
|
|
| PEO Total Compensation Amount |
$ 11,960,363
|
$ 666,824
|
$ 29,342,548
|
|
| PEO Actually Paid Compensation Amount |
$ 27,793,381
|
(22,632,921)
|
45,747,857
|
|
| Adjustment To PEO Compensation, Footnote |
(1)
| The following table shows for each Covered Year the adjustments made to the total compensation shown for our CEO, William Magnuson, on the SCT to arrive at “compensation actually paid” as reflected on the table above: |
Adjustments to Determine CEO Compensation Actually Paid | | | 2024 Fiscal year | | | 2023 Fiscal year | | | 2022 Fiscal year | SCT total amount | | | $11,960,363 | | | $666,824 | | | $29,342,548 | Less Amounts Reported under “Option Awards” and “Stock Awards” Columns in SCT for the Covered Year | | | $10,984,152 | | | — | | | $28,528,500 | Plus Year-end Fair Value of Stock Options Awards and Stock Awards Granted during Covered Year that Remain Unvested as of Year-end | | | $14,407,946 | | | — | | | $35,634,819(8) | Plus Fair Value on Vesting of Stock Option Awards and Stock Awards Granted during Covered Year that Vest during Covered Year | | | $2,485,381 | | | — | | | — | Change (positive or negative) in Fair Value from Prior Year-end to Covered Year-end of Option Awards and Stock Awards Granted Prior to Covered Year that were Outstanding and Unvested as of Covered Year-end | | | $8,281,681 | | | $(15,931,157)(8) | | | $3,620,163 | Change (positive or negative) in Fair Value from Prior Year-end to Vesting Date of Stock Option Awards and Stock Awards Granted Prior to Covered Year that Vested during Covered Year | | | $1,642,162 | | | $(7,368,588)(8) | | | $5,678,827 | TOTAL ADJUSTMENTS: | | | $15,833,018 | | | $(23,299,745)(8) | | | $16,405,309(8) | TOTAL COMPENSATION ACTUALLY PAID: | | | $27,793,381 | | | $(22,632,921)(8) | | | $45,747,857(8) |
|
|
|
|
| Non-PEO NEO Average Total Compensation Amount |
$ 5,548,473
|
491,642
|
8,502,896
|
|
| Non-PEO NEO Average Compensation Actually Paid Amount |
$ 10,642,809
|
(4,926,253)
|
13,019,701
|
|
| Adjustment to Non-PEO NEO Compensation Footnote |
(4)
| The following table shows for each Covered Year presented the adjustments made to the average of the total compensation shown for the Other NEOs on the SCT to arrive at “compensation actually paid” as reflected on the table above: |
Adjustments to Determine Average Other NEO Compensation Actually Paid | | | 2024 Fiscal year | | | 2023 Fiscal year | | | 2022 Fiscal year | SCT total amount | | | 5,548,473 | | | $491,642 | | | $8,502,896 | Less Amounts Reported under “Option Awards” and “Stock Awards” Column in SCT for the Covered Year | | | 4,882,188 | | | — | | | $7,843,500 | Plus Year-end Fair Value of Stock Options Awards and Stock Awards Granted during Covered Year that Remain Unvested as of Year-end | | | 6,403,993 | | | — | | | $9,773,402 | Plus Fair Value on Vesting of Stock Option Awards and Stock Awards Granted during Covered Year that Vest during Covered Year | | | 1,104,687 | | | — | | | — | Change (positive or negative) in Fair Value from Prior Year-end to Covered Year-end of Stock Option Awards and Stock Awards Granted Prior to Covered Year that were Outstanding and Unvested as of Covered Year-end | | | 1,727,978 | | | $(3,626,644) | | | $898,246 | Change (positive or negative) in Fair Value from Prior Year-end to Vesting Date of Stock Option Awards and Stock Awards Granted Prior to Covered Year that Vested during Covered Year | | | 739,866 | | | $(1,791,251) | | | $1,688,657 | TOTAL ADJUSTMENTS: | | | 5,094,336 | | | $(5,417,895) | | | $4,516,805 | TOTAL AVERAGE COMPENSATION ACTUALLY PAID: | | | 10,642,809 | | | $(4,926,253) | | | $13,019,701 |
|
|
|
|
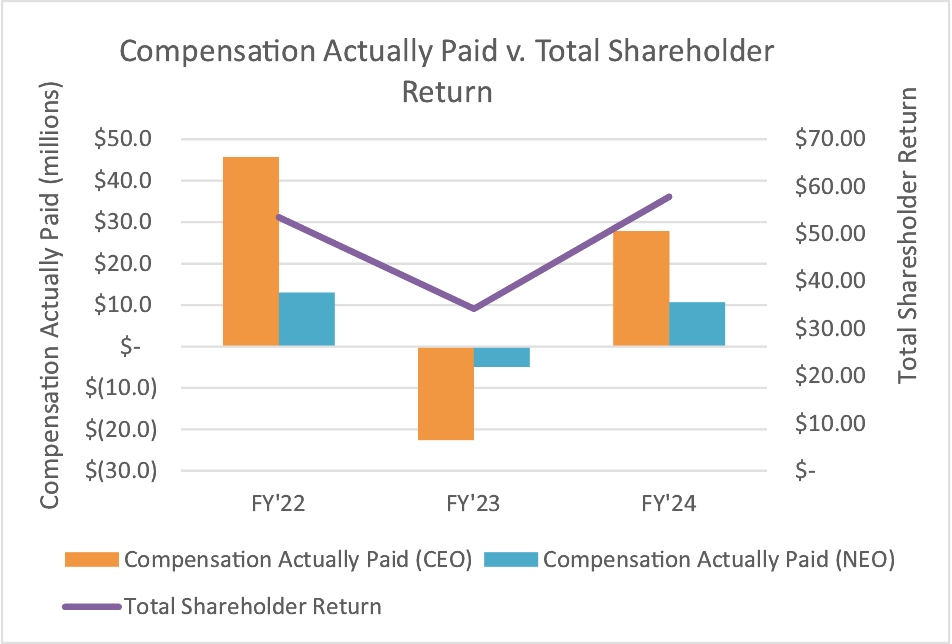
| Compensation Actually Paid vs. Total Shareholder Return |
Set forth below are charts illustrating the relationship between (a) the compensation actually paid to our CEO and (b) the average compensation actually paid to our Other NEOs during each Covered Year and each of: • | Braze’s cumulative TSR for each Covered Year |
|
|
|
|
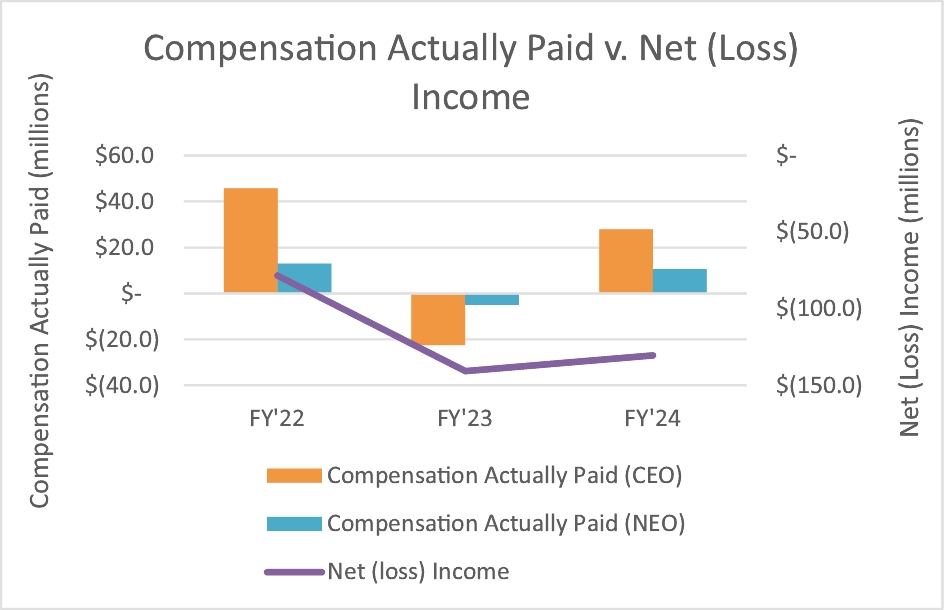
| Compensation Actually Paid vs. Net Income |
Set forth below are charts illustrating the relationship between (a) the compensation actually paid to our CEO and (b) the average compensation actually paid to our Other NEOs during each Covered Year and each of: • | Braze’s Net (loss) income for each Covered Year |
|
|
|
|
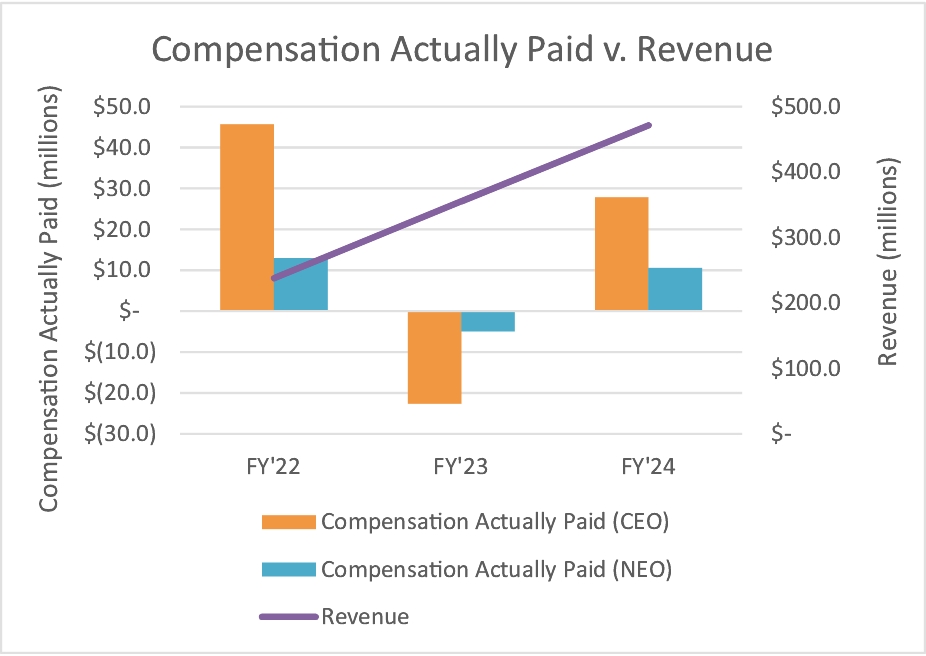
| Compensation Actually Paid vs. Company Selected Measure |
Set forth below are charts illustrating the relationship between (a) the compensation actually paid to our CEO and (b) the average compensation actually paid to our Other NEOs during each Covered Year and each of: • | Braze’s Revenue for each Covered Year |
|
|
|
|
| Tabular List, Table |
Most Important Performance Measures for the 2024 Fiscal Year The following table sets forth an unranked list of the performance measures which we view as the “most important” measures for linking “compensation actually paid” to our CEO and Other NEOs for the 2024 fiscal year to performance: Performance Measure | | | What it Measures | Revenue ($) | | | Revenue (determined on a consolidated basis) is a GAAP measure reported in our audited financial statements. | | | | | ACV ($) | | | Represents the annual recurring revenue of new commercial activity from both existing customers and new customers sold by Braze during the fiscal year (excluding the impact of any one-time implementation and onboarding fees, and the impact of any overage fees or passthrough revenue). | | | | | RR ($) | | | Represents the dollar value of recurring revenue that was renewed with Braze during the fiscal year divided by the total dollars available for renewal during that same period (excluding the impact of any one-time implementation and onboarding fees, and the impact of any overage fees or passthrough revenue). | | | | | Non-GAAP operating income (loss) | | | Represents GAAP operating income (loss) adjusted for stock-based compensation expense, employer taxes related to stock-based compensation, charitable contribution expense, acquisition related expense, amortization of intangible assets and restructuring expense |
For additional disclosure on these performance measures, see “Compensation Discussion and Analysis – Annual Performance-Based Cash Bonus Program” above.
|
|
|
|
| Total Shareholder Return Amount |
$ 57.88
|
34.26
|
53.56
|
|
| Peer Group Total Shareholder Return Amount |
112.14
|
72.4
|
93.37
|
|
| Net Income (Loss) |
$ (130,429,000)
|
$ (140,746,000)
|
$ (78,167,000)
|
|
| Company Selected Measure Amount |
471,800,000
|
355,426,000
|
238,035,000
|
|
| PEO Name |
William Magnuson
|
William Magnuson
|
William Magnuson
|
|
| Additional 402(v) Disclosure |
Discussion of Compensation Actually Paid As reflected in the tables above, changes in the market price of our Class A common stock following the date of grant of an award can have a significant impact on the amount of “compensation actually paid” to our CEO and Other NEOs, as calculated pursuant to the SEC rules. Further, the timing of equity grants may also unintentionally impact the “compensation actually paid” as calculated pursuant to the rule. Beginning in our 2024 fiscal year, we started using RSUs as our primary equity vehicle for our named executive officers. To assist in understanding these changes in value, the following table shows the closing price for one share of our Class A common stock as of the IPO Date and on the last trading day of each Covered Year: | | | January 31,
2024 | | | January 31,
2023 | | | January 31,
2022 | | | IPO Date
Closing Price | Price of our Class A common stock | | | $54.05 | | | $32.00 | | | $50.02 | | | $93.39 |
See also the “Stock Performance Graph” discussion of this proxy statement for a graphical illustration of total shareholder return on a fixed $100 investment made as of IPO Date in shares of our Class A common stock and in the Nasdaq Computer Index. All information provided above under the “Pay versus Performance” heading will not be deemed to be incorporated by reference into any filing of the company under the Securities Act or the Exchange Act, whether made before or after the date hereof and irrespective of any general incorporation language in any such filing, except to the extent the company specifically incorporates such information by reference.
|
|
|
|
| Share Price |
$ 54.05
|
$ 32
|
$ 50.02
|
$ 93.39
|
| Measure:: 1 |
|
|
|
|
| Pay vs Performance Disclosure |
|
|
|
|
| Name |
Revenue
|
|
|
|
| Measure:: 2 |
|
|
|
|
| Pay vs Performance Disclosure |
|
|
|
|
| Name |
ACV
|
|
|
|
| Measure:: 3 |
|
|
|
|
| Pay vs Performance Disclosure |
|
|
|
|
| Name |
RR
|
|
|
|
| Measure:: 4 |
|
|
|
|
| Pay vs Performance Disclosure |
|
|
|
|
| Name |
Non-GAAP operating income (loss)
|
|
|
|
| PEO |
|
|
|
|
| Pay vs Performance Disclosure |
|
|
|
|
| Adjustment to Compensation, Amount |
$ 15,833,018
|
$ (23,299,745)
|
$ 16,405,309
|
|
| PEO | Amounts Reported Under “Option Awards” and “Stock Awards” Columns in SCT for the Covered Year [Member] |
|
|
|
|
| Pay vs Performance Disclosure |
|
|
|
|
| Adjustment to Compensation, Amount |
(10,984,152)
|
0
|
(28,528,500)
|
|
| PEO | Year-End Fair Value of Stock Options Awards and Stock Awards Granted During Covered Year that Remain Unvested as of Year-End [Member] |
|
|
|
|
| Pay vs Performance Disclosure |
|
|
|
|
| Adjustment to Compensation, Amount |
14,407,946
|
0
|
35,634,819
|
|
| PEO | Fair Value on Vesting of Stock Option Awards and Stock Awards Granted During Covered Year that Vest During Covered Year [Member] |
|
|
|
|
| Pay vs Performance Disclosure |
|
|
|
|
| Adjustment to Compensation, Amount |
2,485,381
|
0
|
0
|
|
| PEO | Change (Positive or Negative) in Fair Value from Prior Year-End to Covered Year-End of Option Awards and Stock Awards Granted Prior to Covered Year that were Outstanding and Unvested as of Covered Year-End [Member] |
|
|
|
|
| Pay vs Performance Disclosure |
|
|
|
|
| Adjustment to Compensation, Amount |
8,281,681
|
(15,931,157)
|
3,620,163
|
|
| PEO | Change (Positive or Negative) in Fair Value from Prior Year-End to Vesting Date of Stock Option Awards and Stock Awards Granted Prior to Covered Year that Vested During Covered Year [Member] |
|
|
|
|
| Pay vs Performance Disclosure |
|
|
|
|
| Adjustment to Compensation, Amount |
1,642,162
|
(7,368,588)
|
5,678,827
|
|
| Non-PEO NEO |
|
|
|
|
| Pay vs Performance Disclosure |
|
|
|
|
| Adjustment to Compensation, Amount |
5,094,336
|
(5,417,895)
|
4,516,805
|
|
| Non-PEO NEO | Amounts Reported Under “Option Awards” and “Stock Awards” Columns in SCT for the Covered Year [Member] |
|
|
|
|
| Pay vs Performance Disclosure |
|
|
|
|
| Adjustment to Compensation, Amount |
(4,882,188)
|
0
|
(7,843,500)
|
|
| Non-PEO NEO | Year-End Fair Value of Stock Options Awards and Stock Awards Granted During Covered Year that Remain Unvested as of Year-End [Member] |
|
|
|
|
| Pay vs Performance Disclosure |
|
|
|
|
| Adjustment to Compensation, Amount |
6,403,993
|
0
|
9,773,402
|
|
| Non-PEO NEO | Fair Value on Vesting of Stock Option Awards and Stock Awards Granted During Covered Year that Vest During Covered Year [Member] |
|
|
|
|
| Pay vs Performance Disclosure |
|
|
|
|
| Adjustment to Compensation, Amount |
1,104,687
|
0
|
0
|
|
| Non-PEO NEO | Change (Positive or Negative) in Fair Value from Prior Year-End to Covered Year-End of Option Awards and Stock Awards Granted Prior to Covered Year that were Outstanding and Unvested as of Covered Year-End [Member] |
|
|
|
|
| Pay vs Performance Disclosure |
|
|
|
|
| Adjustment to Compensation, Amount |
1,727,978
|
(3,626,644)
|
898,246
|
|
| Non-PEO NEO | Change (Positive or Negative) in Fair Value from Prior Year-End to Vesting Date of Stock Option Awards and Stock Awards Granted Prior to Covered Year that Vested During Covered Year [Member] |
|
|
|
|
| Pay vs Performance Disclosure |
|
|
|
|
| Adjustment to Compensation, Amount |
$ 739,866
|
$ (1,791,251)
|
$ 1,688,657
|
|
