Pay vs Performance Disclosure - USD ($)
|
2 Months Ended |
5 Months Ended |
6 Months Ended |
12 Months Ended |
Dec. 31, 2024 |
May 23, 2024 |
Nov. 12, 2024 |
Dec. 31, 2024 |
Dec. 31, 2023 |
Dec. 31, 2022 |
Dec. 31, 2021 |
Dec. 31, 2020 |
| Pay vs Performance Disclosure |
|
|
|
|
|
|
|
|
| Pay vs Performance Disclosure, Table |
|
|
|
| | | | | | | | | | | | | | | | | | | | | | | | | | | | | | | | | | | | | | | | | | | Total Shareholder Return (Value of Initial Fixed $100 Investment) | | | | | Year | | Summary Compensation Table Total for PEO 1 (Karnani)(1) ($) | | Compensation Actually Paid to PEO 1 (Karnani)(4) ($) | | Summary Compensation Table Total for PEO 2 (Heffernan)(2) ($) | | Compensation Actually Paid to PEO 2 (Heffernan)(4) ($) | | Summary Compensation Table Total for PEO 3 (Ciaffoni)(3) ($) | | Compensation Actually Paid to PEO 3 (Ciaffoni)(4) ($) | | Average Summary Compensation Table Total for Non-PEO NEOs(5)($) | | Average Compensation Actually Paid to Non-PEO NEOs(4) ($) | | COLL TSR (6) ($) | | Peer Group TSR (7) ($) | | Net Income (millions)(8) ($) | | Adjusted EBITDA (millions)(9) ($) | 2024 | | 10,780,125 | | 9,583,786 | | 466,455 | | 460,835 | | 10,689,852 | | 36,476 | | 2,945,682 | | 2,448,310 | | 139.21 | | 118.20 | | 69 | | 401 | 2023 | | — | | — | | — | | — | | 9,142,924 | | 15,001,055 | | 2,566,547 | | 3,732,025 | | 149.56 | | 118.87 | | 48 | | 367 | 2022 | | — | | — | | — | | — | | 6,917,530 | | 10,486,100 | | 1,846,402 | | 1,984,482 | | 112.73 | | 113.65 | | (25) | | 266 | 2021 | | — | | — | | — | | — | | 7,314,335 | | 5,084,054 | | 2,179,351 | | 462,642 | | 90.77 | | 126.45 | | 72 | | 118 | 2020 | | — | | — | | — | | — | | 6,042,639 | | 5,159,204 | | 2,158,889 | | 1,870,232 | | 97.33 | | 126.42 | | 27 | | 140 |
| (1) | Amounts represent the total compensation reported for Mr. Karnani (our Chief Executive Officer) for each corresponding year in the “Total” column of the Summary Compensation Table. Refer to “Executive Compensation – Executive Compensation Tables – Summary Compensation Table.” |
| (2) | Amounts represent the total compensation reported for Mr. Heffernan (our former interim Chief Executive Officer) for each corresponding year in the “Total” column of the Summary Compensation Table. Refer to “Executive Compensation – Executive Compensation Tables – Summary Compensation Table.” |
| (3) | Amounts represent the total compensation reported for Mr. Ciaffoni (our former Chief Executive Officer) for each corresponding year in the “Total” column of the Summary Compensation Table. Refer to “Executive Compensation – Executive Compensation Tables – Summary Compensation Table.” |
| (4) | The Summary Compensation Table totals reported for each PEO and the average of the Summary Compensation Table totals reported for the Non-PEO NEOs for each year were subject to the following adjustments per Item 402(v)(2)(iii) of Regulation S-K to calculate “compensation actually paid” and do not reflect the actual amount of compensation earned by each PEO and Non-PEO NEOs during the applicable year: |
| | | | | | | | | | | | | | | | | | | | | | | | | | | 2024 | | 2023 | | 2022 | | 2021 | | 2020 | | | Karnani ($) | | Heffernan ($) | | Ciaffoni ($) | | Average for Other NEOs ($) | | PEO ($) | | Average for Other NEOs ($) | | PEO ($) | | Average for Other NEOs ($) | | PEO ($) | | Average for Other NEOs ($) | | PEO ($) | | Average for Other NEOs ($) | Summary Compensation Table "Total" | | 10,780,125 | | 466,455 | | 10,689,852 | | 2,945,682 | | 9,142,924 | | 2,566,547 | | 6,917,530 | | 1,846,402 | | 7,314,335 | | 2,179,351 | | 6,042,639 | | 2,158,889 | Adjustments: | | | | | | | | | | | | | | | | | | | | | | | | | Deduction for amounts reported under the “Stock Awards” and “Option Awards” columns (if applicable) of the Summary Compensation Table | | (10,051,694) | | (259,023) | | (9,372,916) | | (1,985,342) | | (7,691,315) | | (1,827,070) | | (5,231,750) | | (1,111,785) | | (6,214,320) | | (1,682,609) | | (4,910,651) | | (1,498,890) | Increase/(decrease) for the Inclusion
of Rule 402(v) Equity Values: | | | | | | | | | | | | | | | | | | | | | | | | | Fair value as of the end of the covered fiscal year of all awards granted during the covered fiscal year that are outstanding and unvested as of the end of the covered fiscal year | | 8,855,355 | | 220,404 | | — | | 1,603,235 | | 9,008,809 | | 2,126,738 | | 7,137,019 | | 1,220,089 | | 4,465,202 | | 819,304 | | 4,078,624 | | 1,290,232 | Change as of the end of the covered fiscal year from the end of the prior fiscal year in fair value of any awards granted in any prior fiscal year that are outstanding and unvested as of the end of the covered fiscal year | | — | | — | | — | | (283,364) | | 3,730,190 | | 725,566 | | 1,856,809 | | 243,592 | | (1,079,877) | | (122,874) | | (12,117) | | (29,695) | Fair value as of the vesting date for awards that are granted and vest in the same year | | — | | — | | 2,583,401 | | — | | — | | — | | — | | 51,914 | | — | | — | | — | | — | Change as of the vesting date from the end of the prior fiscal year in fair value of any awards granted in any prior fiscal year for which all applicable vesting conditions were satisfied at the end of or during the covered fiscal year | | — | | 32,999 | | 2,147,255 | | 168,100 | | 810,447 | | 140,244 | | (193,508) | | (17,831) | | 598,714 | | 139,828 | | (39,291) | | (50,306) | Fair value at the end of the prior fiscal year for any awards granted in any prior fiscal year that fail to meet the applicable vesting conditions during the covered fiscal year | | — | | — | | (6,011,116) | | — | | — | | — | | — | | (247,898) | | — | | (870,358) | | — | | — | Compensation Actually Paid | | 9,583,786 | | 460,835 | | 36,476 | | 2,448,310 | | 15,001,055 | | 3,732,025 | | 10,486,100 | | 1,984,482 | | 5,084,054 | | 462,642 | | 5,159,204 | | 1,870,232 |
(5) | Amounts represent the average of the amounts reported for the Company’s Non-PEO NEOs as a group (i.e., excluding the appliable PEOs) in the “Total” column of the Summary Compensation Table in each applicable year. The names of each of the Non-PEO NEOs included for purposes of calculating the average amounts in each applicable year are as follows: (i) for 2024, Ms. Tupper, Ms. Kuhlmann, Mr. Dreyer, and Dr. Smith; (ii) for 2023, Ms. Tupper, Ms. Kuhlmann, Mr. Dreyer, and Dr. Smith; (iii) for 2022, Ms. Tupper, Ms. Kuhlmann, Mr. Dreyer, Dr. Smith, and Dr. Malamut (our former Chief Medical Officer); (iv) for 2021, Ms. Tupper, Ms. Kuhlmann, Mr. Dreyer, Dr. Malamut, Mr. Brannelly (our former Executive Vice President and Chief Financial Officer), and Dr. Fleming (our former Executive Vice President and Chief Technology Officer); and (v) for 2020, Ms. Kuhlmann, Dr. Malamut, Mr. Brannelly, and Dr. Fleming. |
(6) | Cumulative TSR is calculated by dividing the difference between the Company’s share price at the end and the beginning of the measurement period by the Company’s share price at the beginning of the measurement period. The measurement period is determined in accordance with the requirements of Item 402(v)(2)(iv) of Regulation S-K. |
(7) | Represents the weighted peer group TSR, weighted according to the respective companies’ stock market capitalization at the beginning of each period for which a return is indicated. The peer group used for this purpose is the Nasdaq Biotechnology Index. |
(8) | The dollar amounts reported represent the amount of net income reflected in the Company’s audited financial statements for the applicable year. |
(9) | Adjusted EBITDA represents GAAP net income (loss) adjusted to exclude interest expense, interest income, the benefit from or provision for income taxes, depreciation, amortization, stock-based compensation, and other adjustments to reflect changes that occur in our business but do not represent ongoing operations. While the Company uses numerous financial and non-financial performance measures for the purpose of evaluating performance for the Company’s compensation programs, the Company has determined that Adjusted EBITDA is the financial performance measure that, in the Company’s assessment, represents the most important performance measure (that is not otherwise required to be disclosed in the table) used by the Company to link compensation actually paid to the company’s NEOs, for the most recently completed fiscal year, to company performance. |
|
|
|
|
|
| Company Selected Measure Name |
|
|
|
Adjusted EBITDA
|
|
|
|
|
| Named Executive Officers, Footnote |
| (1) | Amounts represent the total compensation reported for Mr. Karnani (our Chief Executive Officer) for each corresponding year in the “Total” column of the Summary Compensation Table. Refer to “Executive Compensation – Executive Compensation Tables – Summary Compensation Table.” |
|
| (3) | Amounts represent the total compensation reported for Mr. Ciaffoni (our former Chief Executive Officer) for each corresponding year in the “Total” column of the Summary Compensation Table. Refer to “Executive Compensation – Executive Compensation Tables – Summary Compensation Table.” |
|
| (2) | Amounts represent the total compensation reported for Mr. Heffernan (our former interim Chief Executive Officer) for each corresponding year in the “Total” column of the Summary Compensation Table. Refer to “Executive Compensation – Executive Compensation Tables – Summary Compensation Table.” |
|
(5) | Amounts represent the average of the amounts reported for the Company’s Non-PEO NEOs as a group (i.e., excluding the appliable PEOs) in the “Total” column of the Summary Compensation Table in each applicable year. The names of each of the Non-PEO NEOs included for purposes of calculating the average amounts in each applicable year are as follows: (i) for 2024, Ms. Tupper, Ms. Kuhlmann, Mr. Dreyer, and Dr. Smith; (ii) for 2023, Ms. Tupper, Ms. Kuhlmann, Mr. Dreyer, and Dr. Smith; (iii) for 2022, Ms. Tupper, Ms. Kuhlmann, Mr. Dreyer, Dr. Smith, and Dr. Malamut (our former Chief Medical Officer); (iv) for 2021, Ms. Tupper, Ms. Kuhlmann, Mr. Dreyer, Dr. Malamut, Mr. Brannelly (our former Executive Vice President and Chief Financial Officer), and Dr. Fleming (our former Executive Vice President and Chief Technology Officer); and (v) for 2020, Ms. Kuhlmann, Dr. Malamut, Mr. Brannelly, and Dr. Fleming. |
|
|
|
|
|
| Peer Group Issuers, Footnote |
|
|
|
(7) | Represents the weighted peer group TSR, weighted according to the respective companies’ stock market capitalization at the beginning of each period for which a return is indicated. The peer group used for this purpose is the Nasdaq Biotechnology Index. |
|
|
|
|
|
| PEO Total Compensation Amount |
|
|
|
|
$ 9,142,924
|
$ 6,917,530
|
$ 7,314,335
|
$ 6,042,639
|
| PEO Actually Paid Compensation Amount |
|
|
|
|
15,001,055
|
10,486,100
|
5,084,054
|
5,159,204
|
| Adjustment To PEO Compensation, Footnote |
|
|
|
| (4) | The Summary Compensation Table totals reported for each PEO and the average of the Summary Compensation Table totals reported for the Non-PEO NEOs for each year were subject to the following adjustments per Item 402(v)(2)(iii) of Regulation S-K to calculate “compensation actually paid” and do not reflect the actual amount of compensation earned by each PEO and Non-PEO NEOs during the applicable year: |
| | | | | | | | | | | | | | | | | | | | | | | | | | | 2024 | | 2023 | | 2022 | | 2021 | | 2020 | | | Karnani ($) | | Heffernan ($) | | Ciaffoni ($) | | Average for Other NEOs ($) | | PEO ($) | | Average for Other NEOs ($) | | PEO ($) | | Average for Other NEOs ($) | | PEO ($) | | Average for Other NEOs ($) | | PEO ($) | | Average for Other NEOs ($) | Summary Compensation Table "Total" | | 10,780,125 | | 466,455 | | 10,689,852 | | 2,945,682 | | 9,142,924 | | 2,566,547 | | 6,917,530 | | 1,846,402 | | 7,314,335 | | 2,179,351 | | 6,042,639 | | 2,158,889 | Adjustments: | | | | | | | | | | | | | | | | | | | | | | | | | Deduction for amounts reported under the “Stock Awards” and “Option Awards” columns (if applicable) of the Summary Compensation Table | | (10,051,694) | | (259,023) | | (9,372,916) | | (1,985,342) | | (7,691,315) | | (1,827,070) | | (5,231,750) | | (1,111,785) | | (6,214,320) | | (1,682,609) | | (4,910,651) | | (1,498,890) | Increase/(decrease) for the Inclusion
of Rule 402(v) Equity Values: | | | | | | | | | | | | | | | | | | | | | | | | | Fair value as of the end of the covered fiscal year of all awards granted during the covered fiscal year that are outstanding and unvested as of the end of the covered fiscal year | | 8,855,355 | | 220,404 | | — | | 1,603,235 | | 9,008,809 | | 2,126,738 | | 7,137,019 | | 1,220,089 | | 4,465,202 | | 819,304 | | 4,078,624 | | 1,290,232 | Change as of the end of the covered fiscal year from the end of the prior fiscal year in fair value of any awards granted in any prior fiscal year that are outstanding and unvested as of the end of the covered fiscal year | | — | | — | | — | | (283,364) | | 3,730,190 | | 725,566 | | 1,856,809 | | 243,592 | | (1,079,877) | | (122,874) | | (12,117) | | (29,695) | Fair value as of the vesting date for awards that are granted and vest in the same year | | — | | — | | 2,583,401 | | — | | — | | — | | — | | 51,914 | | — | | — | | — | | — | Change as of the vesting date from the end of the prior fiscal year in fair value of any awards granted in any prior fiscal year for which all applicable vesting conditions were satisfied at the end of or during the covered fiscal year | | — | | 32,999 | | 2,147,255 | | 168,100 | | 810,447 | | 140,244 | | (193,508) | | (17,831) | | 598,714 | | 139,828 | | (39,291) | | (50,306) | Fair value at the end of the prior fiscal year for any awards granted in any prior fiscal year that fail to meet the applicable vesting conditions during the covered fiscal year | | — | | — | | (6,011,116) | | — | | — | | — | | — | | (247,898) | | — | | (870,358) | | — | | — | Compensation Actually Paid | | 9,583,786 | | 460,835 | | 36,476 | | 2,448,310 | | 15,001,055 | | 3,732,025 | | 10,486,100 | | 1,984,482 | | 5,084,054 | | 462,642 | | 5,159,204 | | 1,870,232 |
|
|
|
|
|
| Non-PEO NEO Average Total Compensation Amount |
|
|
|
$ 2,945,682
|
2,566,547
|
1,846,402
|
2,179,351
|
2,158,889
|
| Non-PEO NEO Average Compensation Actually Paid Amount |
|
|
|
$ 2,448,310
|
3,732,025
|
1,984,482
|
462,642
|
1,870,232
|
| Adjustment to Non-PEO NEO Compensation Footnote |
|
|
|
| (4) | The Summary Compensation Table totals reported for each PEO and the average of the Summary Compensation Table totals reported for the Non-PEO NEOs for each year were subject to the following adjustments per Item 402(v)(2)(iii) of Regulation S-K to calculate “compensation actually paid” and do not reflect the actual amount of compensation earned by each PEO and Non-PEO NEOs during the applicable year: |
| | | | | | | | | | | | | | | | | | | | | | | | | | | 2024 | | 2023 | | 2022 | | 2021 | | 2020 | | | Karnani ($) | | Heffernan ($) | | Ciaffoni ($) | | Average for Other NEOs ($) | | PEO ($) | | Average for Other NEOs ($) | | PEO ($) | | Average for Other NEOs ($) | | PEO ($) | | Average for Other NEOs ($) | | PEO ($) | | Average for Other NEOs ($) | Summary Compensation Table "Total" | | 10,780,125 | | 466,455 | | 10,689,852 | | 2,945,682 | | 9,142,924 | | 2,566,547 | | 6,917,530 | | 1,846,402 | | 7,314,335 | | 2,179,351 | | 6,042,639 | | 2,158,889 | Adjustments: | | | | | | | | | | | | | | | | | | | | | | | | | Deduction for amounts reported under the “Stock Awards” and “Option Awards” columns (if applicable) of the Summary Compensation Table | | (10,051,694) | | (259,023) | | (9,372,916) | | (1,985,342) | | (7,691,315) | | (1,827,070) | | (5,231,750) | | (1,111,785) | | (6,214,320) | | (1,682,609) | | (4,910,651) | | (1,498,890) | Increase/(decrease) for the Inclusion
of Rule 402(v) Equity Values: | | | | | | | | | | | | | | | | | | | | | | | | | Fair value as of the end of the covered fiscal year of all awards granted during the covered fiscal year that are outstanding and unvested as of the end of the covered fiscal year | | 8,855,355 | | 220,404 | | — | | 1,603,235 | | 9,008,809 | | 2,126,738 | | 7,137,019 | | 1,220,089 | | 4,465,202 | | 819,304 | | 4,078,624 | | 1,290,232 | Change as of the end of the covered fiscal year from the end of the prior fiscal year in fair value of any awards granted in any prior fiscal year that are outstanding and unvested as of the end of the covered fiscal year | | — | | — | | — | | (283,364) | | 3,730,190 | | 725,566 | | 1,856,809 | | 243,592 | | (1,079,877) | | (122,874) | | (12,117) | | (29,695) | Fair value as of the vesting date for awards that are granted and vest in the same year | | — | | — | | 2,583,401 | | — | | — | | — | | — | | 51,914 | | — | | — | | — | | — | Change as of the vesting date from the end of the prior fiscal year in fair value of any awards granted in any prior fiscal year for which all applicable vesting conditions were satisfied at the end of or during the covered fiscal year | | — | | 32,999 | | 2,147,255 | | 168,100 | | 810,447 | | 140,244 | | (193,508) | | (17,831) | | 598,714 | | 139,828 | | (39,291) | | (50,306) | Fair value at the end of the prior fiscal year for any awards granted in any prior fiscal year that fail to meet the applicable vesting conditions during the covered fiscal year | | — | | — | | (6,011,116) | | — | | — | | — | | — | | (247,898) | | — | | (870,358) | | — | | — | Compensation Actually Paid | | 9,583,786 | | 460,835 | | 36,476 | | 2,448,310 | | 15,001,055 | | 3,732,025 | | 10,486,100 | | 1,984,482 | | 5,084,054 | | 462,642 | | 5,159,204 | | 1,870,232 |
|
|
|
|
|
| Compensation Actually Paid vs. Total Shareholder Return |
|
|
|
Compensation Actually Paid and Cumulative TSR As demonstrated by the following graph, the amount of compensation actually paid to our PEOs and the average amount of compensation actually paid to the Company’s NEOs as a group (excluding each PEO) is aligned with the Company’s cumulative TSR over the five years presented in the table. The alignment of compensation actually paid with the Company’s cumulative TSR over the period presented is primarily related to our use of long-term equity incentives in our compensation program. As described in more detail in the section “Executive Compensation – Compensation Discussion and Analysis,” we generally target that approximately 70% of the value of total compensation awarded to the NEOs is comprised of long-term equity incentives comprising of a mix of RSUs and PSUs. 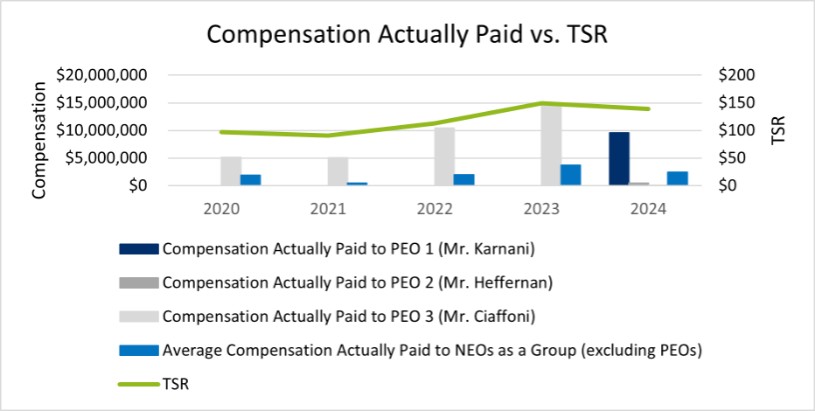
|
|
|
|
|
| Compensation Actually Paid vs. Net Income |
|
|
|
Compensation Actually Paid and Net Income As demonstrated by the following graph, the amount of compensation actually paid to our PEOs and the average amount of compensation actually paid to the Company’s NEOs as a group (excluding each PEO) is generally not aligned with our net income over the five years presented in the table. We do not use net income as a performance measure in our overall executive compensation program because it includes several adjustments that occur in our business but that we believe do not represent ongoing operations. Instead, we use Adjusted EBITDA and Total Net Revenue, as described in the section “Executive Compensation – Compensation Discussion and Analysis,” as performance metrics in our cash incentive compensation program. 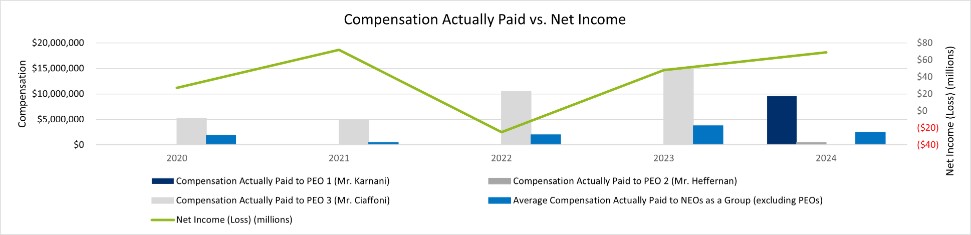
|
|
|
|
|
| Compensation Actually Paid vs. Company Selected Measure |
|
|
|
Compensation Actually Paid and Adjusted EBITDA As demonstrated by the following graph, the amount of compensation actually paid to our PEOs and the average amount of compensation actually paid to the Company’s NEOs as a group (excluding each PEO) is generally aligned with the Company’s Adjusted EBITDA over the five years presented in the table. As described above, Adjusted EBITDA represents GAAP net income (loss) adjusted to exclude interest expense, interest income, the benefit from or provision for income taxes, depreciation, amortization, stock-based compensation, and other adjustments to reflect changes that occur in our business but do not represent ongoing operations. While we use numerous financial and non-financial performance measures for the purpose of evaluating performance for the Company’s compensation programs, we have determined that Adjusted EBITDA is the financial performance measure that, in our assessment, represents the most important performance measure (that is not otherwise required to be disclosed in the table) used in our compensation program to link compensation actually paid to our NEOs, for the most recently completed fiscal year to Company performance. We utilize Adjusted EBITDA as a performance metric in our annual cash incentive compensation program. 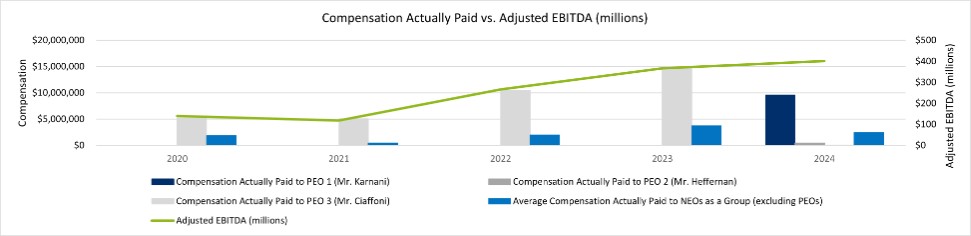
|
|
|
|
|
| Total Shareholder Return Vs Peer Group |
|
|
|
Cumulative TSR of the Company and Cumulative TSR of the Peer Group As demonstrated by the following graph, at the end of the five year period presented in the table the Company’s cumulative TSR exceeded the cumulative TSR of the peer group, the Nasdaq Biotechnology Index. As described in more detail in the section “Executive Compensation – Compensation Discussion and Analysis,” we use relative TSR as compared to the S&P Pharmaceutical Select Industry Index as a performance measure in connection with the PSU component of our long-term equity incentives. 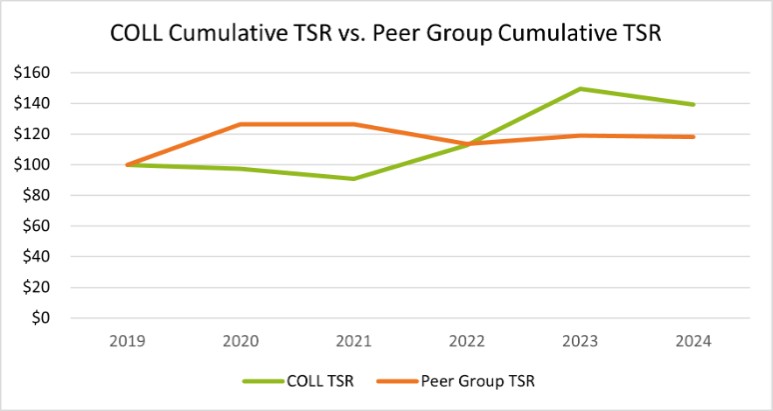
|
|
|
|
|
| Tabular List, Table |
|
|
|
Financial Performance Measures Our executive compensation program reflects a variable pay-for-performance philosophy. The metrics that we use for both our short- and long-term cash and equity incentives are selected based on the objective of motivating our management team to create long-term value for our shareholders through the achievement of strategic business objectives, while effectively managing the risks and challenges inherent to a growing specialty pharmaceutical company. The most important financial performance measures we use to link executive compensation actually paid to our named executive officers, for the most recently completed fiscal year, to the Company’s performance are as follows: | • | Relative TSR (our TSR compared to the TSR for the S&P Pharmaceutical Select Industry Index). |
|
|
|
|
|
| Total Shareholder Return Amount |
|
|
|
$ 139.21
|
149.56
|
112.73
|
90.77
|
97.33
|
| Peer Group Total Shareholder Return Amount |
|
|
|
118.2
|
118.87
|
113.65
|
126.45
|
126.42
|
| Net Income (Loss) |
|
|
|
$ 69,000,000
|
$ 48,000,000
|
$ (25,000,000)
|
$ 72,000,000
|
$ 27,000,000
|
| Company Selected Measure Amount |
|
|
|
401,000,000
|
367,000,000
|
266,000,000
|
118,000,000
|
140,000,000
|
| PEO Name |
Mr. Karnani
|
Mr. Ciaffoni
|
Mr. Heffernan
|
|
|
|
|
|
| Measure:: 1 |
|
|
|
|
|
|
|
|
| Pay vs Performance Disclosure |
|
|
|
|
|
|
|
|
| Name |
|
|
|
Total net revenue
|
|
|
|
|
| Measure:: 2 |
|
|
|
|
|
|
|
|
| Pay vs Performance Disclosure |
|
|
|
|
|
|
|
|
| Name |
|
|
|
Adjusted EBITDA
|
|
|
|
|
| Non-GAAP Measure Description |
|
|
|
(9) | Adjusted EBITDA represents GAAP net income (loss) adjusted to exclude interest expense, interest income, the benefit from or provision for income taxes, depreciation, amortization, stock-based compensation, and other adjustments to reflect changes that occur in our business but do not represent ongoing operations. While the Company uses numerous financial and non-financial performance measures for the purpose of evaluating performance for the Company’s compensation programs, the Company has determined that Adjusted EBITDA is the financial performance measure that, in the Company’s assessment, represents the most important performance measure (that is not otherwise required to be disclosed in the table) used by the Company to link compensation actually paid to the company’s NEOs, for the most recently completed fiscal year, to company performance. |
|
|
|
|
|
| Measure:: 3 |
|
|
|
|
|
|
|
|
| Pay vs Performance Disclosure |
|
|
|
|
|
|
|
|
| Name |
|
|
|
Relative TSR (our TSR compared to the TSR for the S&P Pharmaceutical Select Industry Index)
|
|
|
|
|
| Karnani |
|
|
|
|
|
|
|
|
| Pay vs Performance Disclosure |
|
|
|
|
|
|
|
|
| PEO Total Compensation Amount |
|
|
|
$ 10,780,125
|
|
|
|
|
| PEO Actually Paid Compensation Amount |
|
|
|
9,583,786
|
|
|
|
|
| Heffernan |
|
|
|
|
|
|
|
|
| Pay vs Performance Disclosure |
|
|
|
|
|
|
|
|
| PEO Total Compensation Amount |
|
|
|
466,455
|
|
|
|
|
| PEO Actually Paid Compensation Amount |
|
|
|
460,835
|
|
|
|
|
| Ciaffoni |
|
|
|
|
|
|
|
|
| Pay vs Performance Disclosure |
|
|
|
|
|
|
|
|
| PEO Total Compensation Amount |
|
|
|
10,689,852
|
$ 9,142,924
|
$ 6,917,530
|
$ 7,314,335
|
$ 6,042,639
|
| PEO Actually Paid Compensation Amount |
|
|
|
36,476
|
15,001,055
|
10,486,100
|
5,084,054
|
5,159,204
|
| PEO | Aggregate Grant Date Fair Value of Equity Award Amounts Reported in Summary Compensation Table |
|
|
|
|
|
|
|
|
| Pay vs Performance Disclosure |
|
|
|
|
|
|
|
|
| Adjustment to Compensation, Amount |
|
|
|
|
(7,691,315)
|
(5,231,750)
|
(6,214,320)
|
(4,910,651)
|
| PEO | Year-end Fair Value of Equity Awards Granted in Covered Year that are Outstanding and Unvested |
|
|
|
|
|
|
|
|
| Pay vs Performance Disclosure |
|
|
|
|
|
|
|
|
| Adjustment to Compensation, Amount |
|
|
|
|
9,008,809
|
7,137,019
|
4,465,202
|
4,078,624
|
| PEO | Year-over-Year Change in Fair Value of Equity Awards Granted in Prior Years That are Outstanding and Unvested |
|
|
|
|
|
|
|
|
| Pay vs Performance Disclosure |
|
|
|
|
|
|
|
|
| Adjustment to Compensation, Amount |
|
|
|
|
3,730,190
|
1,856,809
|
(1,079,877)
|
(12,117)
|
| PEO | Change in Fair Value as of Vesting Date of Prior Year Equity Awards Vested in Covered Year |
|
|
|
|
|
|
|
|
| Pay vs Performance Disclosure |
|
|
|
|
|
|
|
|
| Adjustment to Compensation, Amount |
|
|
|
|
810,447
|
(193,508)
|
598,714
|
(39,291)
|
| PEO | Karnani | Aggregate Grant Date Fair Value of Equity Award Amounts Reported in Summary Compensation Table |
|
|
|
|
|
|
|
|
| Pay vs Performance Disclosure |
|
|
|
|
|
|
|
|
| Adjustment to Compensation, Amount |
|
|
|
(10,051,694)
|
|
|
|
|
| PEO | Karnani | Year-end Fair Value of Equity Awards Granted in Covered Year that are Outstanding and Unvested |
|
|
|
|
|
|
|
|
| Pay vs Performance Disclosure |
|
|
|
|
|
|
|
|
| Adjustment to Compensation, Amount |
|
|
|
8,855,355
|
|
|
|
|
| PEO | Heffernan | Aggregate Grant Date Fair Value of Equity Award Amounts Reported in Summary Compensation Table |
|
|
|
|
|
|
|
|
| Pay vs Performance Disclosure |
|
|
|
|
|
|
|
|
| Adjustment to Compensation, Amount |
|
|
|
(259,023)
|
|
|
|
|
| PEO | Heffernan | Year-end Fair Value of Equity Awards Granted in Covered Year that are Outstanding and Unvested |
|
|
|
|
|
|
|
|
| Pay vs Performance Disclosure |
|
|
|
|
|
|
|
|
| Adjustment to Compensation, Amount |
|
|
|
220,404
|
|
|
|
|
| PEO | Heffernan | Change in Fair Value as of Vesting Date of Prior Year Equity Awards Vested in Covered Year |
|
|
|
|
|
|
|
|
| Pay vs Performance Disclosure |
|
|
|
|
|
|
|
|
| Adjustment to Compensation, Amount |
|
|
|
32,999
|
|
|
|
|
| PEO | Ciaffoni | Aggregate Grant Date Fair Value of Equity Award Amounts Reported in Summary Compensation Table |
|
|
|
|
|
|
|
|
| Pay vs Performance Disclosure |
|
|
|
|
|
|
|
|
| Adjustment to Compensation, Amount |
|
|
|
(9,372,916)
|
|
|
|
|
| PEO | Ciaffoni | Vesting Date Fair Value of Equity Awards Granted and Vested in Covered Year |
|
|
|
|
|
|
|
|
| Pay vs Performance Disclosure |
|
|
|
|
|
|
|
|
| Adjustment to Compensation, Amount |
|
|
|
2,583,401
|
|
|
|
|
| PEO | Ciaffoni | Change in Fair Value as of Vesting Date of Prior Year Equity Awards Vested in Covered Year |
|
|
|
|
|
|
|
|
| Pay vs Performance Disclosure |
|
|
|
|
|
|
|
|
| Adjustment to Compensation, Amount |
|
|
|
2,147,255
|
|
|
|
|
| PEO | Ciaffoni | Prior Year End Fair Value of Equity Awards Granted in Any Prior Year that Fail to Meet Applicable Vesting Conditions During Covered Year |
|
|
|
|
|
|
|
|
| Pay vs Performance Disclosure |
|
|
|
|
|
|
|
|
| Adjustment to Compensation, Amount |
|
|
|
(6,011,116)
|
|
|
|
|
| Non-PEO NEO | Aggregate Grant Date Fair Value of Equity Award Amounts Reported in Summary Compensation Table |
|
|
|
|
|
|
|
|
| Pay vs Performance Disclosure |
|
|
|
|
|
|
|
|
| Adjustment to Compensation, Amount |
|
|
|
(1,985,342)
|
(1,827,070)
|
(1,111,785)
|
(1,682,609)
|
(1,498,890)
|
| Non-PEO NEO | Year-end Fair Value of Equity Awards Granted in Covered Year that are Outstanding and Unvested |
|
|
|
|
|
|
|
|
| Pay vs Performance Disclosure |
|
|
|
|
|
|
|
|
| Adjustment to Compensation, Amount |
|
|
|
1,603,235
|
2,126,738
|
1,220,089
|
819,304
|
1,290,232
|
| Non-PEO NEO | Year-over-Year Change in Fair Value of Equity Awards Granted in Prior Years That are Outstanding and Unvested |
|
|
|
|
|
|
|
|
| Pay vs Performance Disclosure |
|
|
|
|
|
|
|
|
| Adjustment to Compensation, Amount |
|
|
|
(283,364)
|
725,566
|
243,592
|
(122,874)
|
(29,695)
|
| Non-PEO NEO | Vesting Date Fair Value of Equity Awards Granted and Vested in Covered Year |
|
|
|
|
|
|
|
|
| Pay vs Performance Disclosure |
|
|
|
|
|
|
|
|
| Adjustment to Compensation, Amount |
|
|
|
|
|
51,914
|
|
|
| Non-PEO NEO | Change in Fair Value as of Vesting Date of Prior Year Equity Awards Vested in Covered Year |
|
|
|
|
|
|
|
|
| Pay vs Performance Disclosure |
|
|
|
|
|
|
|
|
| Adjustment to Compensation, Amount |
|
|
|
$ 168,100
|
$ 140,244
|
(17,831)
|
139,828
|
$ (50,306)
|
| Non-PEO NEO | Prior Year End Fair Value of Equity Awards Granted in Any Prior Year that Fail to Meet Applicable Vesting Conditions During Covered Year |
|
|
|
|
|
|
|
|
| Pay vs Performance Disclosure |
|
|
|
|
|
|
|
|
| Adjustment to Compensation, Amount |
|
|
|
|
|
$ (247,898)
|
$ (870,358)
|
|
