
G-III APPAREL GROUP, LTD.
512 SEVENTH AVENUE
NEW YORK, NEW YORK 10018
Dear Stockholder:
You are cordially invited to attend the Annual Meeting of Stockholders of G-III Apparel Group, Ltd. will be held on Tuesday, June 18, 2024 at 10:00 a.m., New York time, at the offices of Norton Rose Fulbright US LLP, 1301 Avenue of the Americas, 30th Floor, New York, New York 10019.
Only stockholders of record at the close of business on April 26, 2024, the record date for the Annual Meeting, are entitled to notice of and to vote at the Annual Meeting and any adjournments thereof. Stockholders who own shares of our common stock beneficially through a bank, broker or other nominee will also be entitled to attend the Annual Meeting.
The formal Notice of Meeting and the accompanying Proxy Statement set forth proposals for your consideration this year. You are being asked:
| |
1 | To elect thirteen directors to serve on our Board of Directors for the ensuing year, |
2 | For an advisory and non-binding vote on the compensation of our named executive officers, and |
3 | To ratify the appointment of Ernst & Young LLP as our independent registered public accounting firm for the fiscal year ending January 31, 2025. |
At the meeting, we will also report on the affairs of G-III, and a discussion period will be provided for questions and comments of general interest to stockholders.
We look forward to greeting personally those of you who are able to be present at the meeting. However, whether or not you are able to attend the Annual Meeting, it is important that your shares be represented. Accordingly, you are requested to sign, date and mail, at your earliest convenience, the enclosed proxy in the envelope provided for your use, or vote your shares by calling the telephone number or visiting the website specified on your proxy card or voting instruction form.
Thank you for your cooperation.
| |
| Very truly yours, |
| 
|
| Morris Goldfarb |
| Chief Executive Officer |
May 10, 2024
Shares of Common Stock represented by executed and unrevoked proxies will be voted in accordance with the instructions specified in such proxies. If no instructions are given, the proxies intend to vote the shares represented thereby:
| (i) | “FOR” the election of each of the thirteen nominees for director as shown on the form of proxy, |
| (ii) | “FOR” approval of the compensation of our Named Executive Officers, |
| (iii) | “FOR” the ratification of the appointment of Ernst & Young LLP as our independent registered public accounting firm for the fiscal year ending January 31, 2025, and |
| (iv) | in accordance with their best judgment on any other matters which may properly come before the meeting. |
RECORD DATE AND VOTING RIGHTS
On April 26, 2024, there were 44,965,287 shares of Common Stock outstanding (excluding shares held in treasury). Each of these shares is entitled to one vote upon each of the matters to be presented at the Annual Meeting. Only stockholders of record at the close of business on April 26, 2024 are entitled to notice of and to vote at the Annual Meeting or any adjournment thereof.
The quorum requirement for holding the Annual Meeting and transacting business is a majority of the outstanding shares entitled to be voted at the Annual Meeting. The shares may be present in person or represented by proxy at the Annual Meeting. Abstentions and broker non-votes are counted as present for the purpose of determining the presence of a quorum.
A “broker non-vote” occurs when shares held by a broker, bank, or other nominee in “street name” for a beneficial owner are not voted with respect to a particular proposal because the broker, bank, or other nominee (1) has not received voting instructions from the beneficial owner and (2) lacks discretionary voting power to vote those shares with respect to that particular proposal. Under current Nasdaq rules, brokers have discretionary voting power with respect to the proposal to ratify the appointment of Ernst & Young LLP as our independent registered public accounting firm for the fiscal year ending January 31, 2025, but will not be authorized to vote with respect to the (a) election of our thirteen nominees for director or (b) advisory and non-binding vote on the compensation of our Named Executive Officers, unless you provide voting instructions to your broker.
The affirmative vote of the holders of a plurality of the shares of Common Stock present in person or represented by proxy and entitled to vote at the Annual Meeting is required for the election of directors. The thirteen nominees receiving the highest number of affirmative votes of the shares present in person or represented by proxy and entitled to vote for them shall be elected as directors; provided, however, that pursuant to our Director Selection and Qualification Standards and Resignation Policy, any nominee for director in this uncontested election who receives a greater number of votes “withheld” from his or her election than votes “for” his or her election must tender a written resignation to the Board. The Nominating and Corporate Governance Committee and the Board of Directors will consider the resignation and determine whether or not to accept the resignation.
 See “Corporate Governance—Additional Corporate Governance Policies—Director Selection and Qualification Standards and Resignation Policy” for a more complete description of the application of this Policy.
The affirmative vote of the holders of a majority of the shares of Common Stock present in person or represented by proxy and entitled to vote at the Annual Meeting is required to decide the other matters to be voted on at the Annual Meeting.
You may vote “FOR” or “VOTE WITHHELD” with respect to each or all of the director nominees. If you elect not to vote on the election of directors, this will not have any effect on the election of directors. In tabulating the voting results for the election of directors, only “FOR” and “VOTE WITHHELD” votes are counted.
You may vote “FOR,” “AGAINST,” or “ABSTAIN” with respect to the (a) proposal to approve, on an advisory basis, the compensation of our Named Executive Officers and (b) proposal to ratify the appointment of Ernst & Young LLP as our independent registered public accounting firm. If you elect to abstain from voting on any of these proposals, the abstention will have the same effect as an “AGAINST” vote with respect to such proposal.
If you sign and return your accompanying proxy card without giving specific voting instructions, your shares will be voted as recommended by our Board and in accordance with the discretion of the persons named on the accompanying proxy card with respect to any other matters to be voted upon at the Annual Meeting. If you are a beneficial holder and do not return a voting instruction form, your broker may not vote on any of the matters to be presented at the Annual Meeting.
| |
2  | |
Our Business Performance in Fiscal 2024
Fiscal 2024 was an outstanding year. We achieved the second highest year of net income and net income per share in our history and positioned the Company for long term growth and profitability. Late in 2022, our long-term licensor partner, PVH, informed us that it would not grant long-term renewals of our licenses for Calvin Klein and Tommy Hilfiger products and that it intended to produce the products licensed to us as the license agreements expire. Our management was ready to respond to the challenges resulting from this decision. At that time, we entered into amendments to the license agreements for the Calvin Klein and Tommy Hilfiger products that provide for staggered extensions by category. These business lines represented approximately 48% of our net sales in fiscal 2023.
As a result of strategic planning by our management and Board, risk management and contingency planning, we were prepared for this challenge. Our team, led by our Chairman and CEO, Morris Goldfarb, and Vice Chairman and President, Sammy Aaron, used their decades of apparel industry experience and extensive relationships with our retail customers and suppliers to pivot, reducing our dependence on these licenses and concentrating on new initiates. These initiatives included substantial investments to accelerate growth of our key owned brands, Donna Karan, DKNY, and Karl Lagerfeld, as well as entering into new long-term licenses, including for the Nautica and Halston brands. One of the keys to this strategy is to leverage the Company’s owned brands that do not have limits on our ability to sell internationally, through digital channels, or in off-price markets. The Company also intends to leverage our ability to license our owned brands in select categories.
| | | |
Net Sales $3.1B Compares to $3.2B last year | Adjusted EBITDA* $324M Compares to $266M last year | Non-GAAP Net Income* $190M Compares to $139M last year | Non-GAAP Diluted Net Income Per Share* $4.04 Compares to $2.85 last year |
*Please see Appendix A for a reconciliation of Adjusted EBITDA, Non-GAAP Net Income and Non-GAAP Diluted Net Income Per Share to GAAP amounts.
Under the leadership of Morris Goldfarb, our Chairman and Chief Executive Officer, Sammy Aaron, our Vice Chairman and President, and our dedicated team of executive officers, G-III has successfully operated in fashion markets that are intensely competitive. Our ability to continuously evaluate and respond to changing consumer demands and tastes, across multiple market segments, distribution channels and geographic areas, is critical to our success. This is demonstrated by our ability to reposition the Company and deliver strong results in fiscal 2024.
Our Board believes the relative performance of our Common Stock, as measured by Total Stockholder Return (TSR), is an important performance indicator. During fiscal 2024, our stock price increased by 75%, significantly outperforming the S&P Textiles, Apparel & Luxury Goods Industry Index, which declined approximately 14%, and our compensation peer group which declined by 4%.
Our TSR outperformed the S&P Textiles, Apparel & Luxury Goods Industry Index over the two, three and four-year periods ended on January 31, 2024. In addition, our TSR performance has generally exceeded the performance of our compensation peer group over these periods. We believe that our stockholders attribute this outperformance to the successful measures we have taken following the announcement of the planned termination of the Calvin Klein and Tommy Hilfiger licenses, including by driving our owned brands across categories, continued development and expansion of our DKNY business and repositioning and expansion of our Donna Karan business, expanding our international business and increasing digital channel business opportunities and entering into important new license agreements.
| |
4  | |
Human Capital
Our People
As of January 31, 2024, we employed approximately 3,500 persons on a full-time basis and approximately 1,100 on a part-time basis. We employ both union and non-union personnel and believe that our relations with our employees are good. We have not experienced any interruption of our operations due to a labor disagreement with our employees.
We are an Equal Opportunity Employer with policies, procedures and practices that recognize the value and worth of each individual, covering matters such as safety, training, advancement, discrimination, harassment and retaliation. We provide training on important issues to our personnel. G-III ensures compliance with labor and employment law issues through a variety of processes and procedures, using both internal and external expertise and resources. We continue to work towards achieving a stronger, more engaging workplace coupled with a foundation for enhancing the employee experience by continuing to promote our passion for our product, pride in our partnerships, our accountability and our entrepreneurial spirit.
We are committed to providing a healthy work environment that allows employees to feel highly valued, productive and effective within their jobs by maintaining an inclusive environment which we believe positively impacts employee engagement. Our employees are the heart of our organization and our ongoing emphasis to recruit and retain the best talent in our industry continues as a top priority. We are constantly striving to build upon and improve our talent acquisition and selection processes, onboarding experience and training initiatives.
Diversity, Equity and Inclusion
We are a diverse workplace and know that, to succeed, we must become an even more diverse, equitable and inclusive organization. Currently, approximately 60% of our leadership team and 72% of our overall workforce self-identify as women, and 48% of our overall workforce identify as Black, Indigenous and People of Color (“BIPOC”). Of our fourteen Board members, there are four women and four people of diverse backgrounds, exceeding NASDAQ requirements for board diversity. We recognize that insights and ideas from a diverse range of backgrounds will better position us for the future and continue to work towards increasing Board diversity.
Our commitment to Diversity, Equity and Inclusion also extends outside of our business. We are a founding member of the groundbreaking Social Justice Center at the Fashion Institute of Technology (“FIT”), a premier fashion university, whose purpose is to help establish a program that is intended to increase opportunities and accelerate social equity for BIPOC persons entering our industry for years to come. Additionally, we continued our partnership with UNCF (“United Negro College Fund”) by sponsoring two enriching and rewarding student internships. These interns were provided room and board at FIT. They participated in a program that consisted of educational master class sessions and experienced New York theatre and other local programs. In addition, we funded two scholarships through UNCF. In fiscal 2025, we will continue to support our diversity efforts by working directly with Historically Black Colleges and Universities by providing two students the opportunity to gain firsthand experience working at G-III.
Diversity, Equity and Inclusion are at the heart of G-III’s values. We strive to create a workplace with opportunities for all. We have made progress and intend to continue to do so in the coming years.
Talent Acquisition, Development and Retention
Having the right talent in the organization is one of the most critical aspects of our business. This year our HR team focused on hiring, developing and retaining talent. After a successful launch of our Lunch and Learn program facilitated by our leadership team, we have continued the program by offering a second semester of courses that will provided an opportunity for continuous learning about our business. We have procured a training solution program that will incorporate a G-III Master Class training library that will make these sessions and other educational tools accessible to our employees.
Through our aggressive recruiting, we have been able to bring in best-in-class talent. We had several key hires at the Company, including our Chief Growth and Operations Officer, Dana Perlman, who has significant industry experience through her over 20-year career in apparel, strategy and finance.
| |
12 | |
meetings. The advance notice provisions in the by-laws require stockholders to deliver notice to G-III of their intention to make director nominations or bring other business before the meeting not later than the close of business on the 90th day, nor earlier than the close of business on the 120th day, in advance of the anniversary of the previous year’s annual meeting if the meeting is to be held on a day which is not more than 30 days in advance of the anniversary of the previous year’s annual meeting or not later than 70 days after the anniversary of the previous year’s annual meeting. The advance notice provisions of the by-laws prescribe information that the stockholder’s notice must contain, both as to itself and its proposed director nominee, if the stockholder wishes to nominate a candidate for the annual meeting director election, prescribe information that the stockholder’s notice must contain if the stockholder wishes to bring business other than a director nomination before the annual meeting, and set forth rules and procedures relating to special meetings of stockholders.
Risk Oversight
The risk oversight function of our Board of Directors is carried out by both the Board and the Audit Committee. A fundamental part of risk oversight is not only understanding the material risks a company faces and the steps management is taking to manage those risks, but also understanding what level of risk is appropriate for the company. The Board focuses on our general risk management strategy and the most significant risks facing us and ensures that management implements appropriate risk mitigation strategies. Management also apprises the Board of particular risk management matters in connection with its general oversight and approval of corporate matters.
While the full Board has overall responsibility for risk oversight, the Board has delegated oversight related to certain risks to the Audit Committee. The Audit Committee is responsible for reviewing and discussing with management our major and emerging risk exposures, including financial, operational, technology, privacy, data security, disaster recovery and ethics and compliance. The Audit Committee meets periodically with management and our internal audit department to discuss our major financial and operating risks and the steps, guidelines and policies management and our internal audit team have taken to monitor and control exposures to risk, including G-III’s risk assessment and risk management policies. The Chair of the Audit Committee regularly reports to the Board the substance of such reviews and discussions. Both the Board and the Audit Committee regularly review cybersecurity and data privacy risk matters.
Our Compensation Committee incorporates considerations of risk into its deliberations of our executive compensation program. The Compensation Committee believes that G-III’s compensation policies and practices do not create risks that are reasonably likely to have a material adverse effect on G-III. In addition, our internal disclosure committee reviews with management the “risk factors” that appear in our Annual Report on Form 10-K prior to its filing with the SEC, as well as prior to the filing of our Quarterly Reports on Form 10-Q.
Our management is responsible for day-to-day risk management. Our risk management and internal audit areas serve as the primary monitoring and testing function for company-wide policies and procedures and manage the day-to-day oversight of the risk management strategy for our ongoing business. This oversight includes identifying, evaluating, and addressing potential risks that may exist at the enterprise, strategic, financial, operational, and compliance and reporting levels. The Board encourages management to promote a corporate culture that incorporates risk management into our corporate strategy and day-to-day business operations. The Board continually works, with input from our executive officers, to assess and analyze the most likely areas of future risk for us and our business.
Leadership Structure of the Board
The Board of Directors believes that Morris Goldfarb’s service in the dual roles of Chairman of the Board and Chief Executive Officer is in our best interest, as well as the best interest of our stockholders. Mr. Goldfarb is the director most familiar with our business and industry and possesses detailed and in-depth knowledge of the issues, opportunities and challenges facing us and our business. Thus, he is in the best position to develop agendas and plans that ensure that the Board’s time and attention are focused on the most critical matters. We believe that Mr. Goldfarb is viewed by our customers, suppliers, business partners, investors and other stakeholders as providing strong leadership for our company in the marketplace and in our industry. This approach is often utilized by other public companies in the United States and we believe it has been effective for our company as well.
| |
| 2024 PROXY STATEMENT / 23 |
Although the Board believes that the combination of the Chairman of the Board and Chief Executive Officer roles is appropriate for us in the current circumstances, our Board does not have a specific policy as to whether or not these roles should be combined or separated.
LEAD INDEPENDENT DIRECTOR
In order to promote independent leadership on our Board and help ensure that the Board operates in a cohesive manner, the Board established the position of Lead Independent Director and elected Richard White as the Lead Independent Director. The responsibilities of the Lead Independent Director include:
| (i) | advising the Chairman of the Board on Board meeting agendas and materials sent to the Board; |
| (ii) | serving as a liaison between non-management directors and the Chairman of the Board; |
| (iii) | calling and presiding over executive sessions of the non-management directors; |
| (iv) | presiding over Board meetings in the absence of the Chairman of the Board; |
| (v) | serving as a non-management resource for stockholders and other external constituencies seeking to communicate with our Board; |
| (vi) | oversight of the Board’s annual assessment of the performance of our Chairman and Chief Executive Officer; and |
| (vii) | oversight of the Board’s annual self-assessment of its own performance, along with the Chairman of the Nominating and Corporate Governance Committee. |
In recent years, our stockholder outreach program has been led by our Lead Independent Director. Along with certain members of management, Mr. White has been at the forefront of communicating to our significant stockholders updates on corporate strategy, governance matters, including diversity and Board composition, and compensation programs as well as responding to their questions and concerns.
Additional Corporate Governance Policies
We also maintain the following corporate governance policies:
CODE OF ETHICS AND CONDUCT
All of our employees and employees of our subsidiaries (“Company Personnel”), officers and directors must adhere to our Code of Ethics and Conduct. It codifies those standards that we believe are reasonably designed to deter wrong-doing and to promote, among other things, adherence to the following principles:
| (i) | honest and ethical conduct, including the ethical handling of actual or apparent conflicts of interest between personal and professional relationships; |
| (ii) | full, fair, accurate, timely and understandable disclosure in reports and documents that we file with, or submit to, the SEC and in other public communications made by G-III; |
| (iii) | compliance with applicable governmental laws, rules and regulations; |
| (iv) | the prompt internal reporting of violations of the Code of Ethics and Conduct; and |
| (v) | accountability for adherence to the Code of Ethics and Conduct. |
A copy of the Code of Ethics and Conduct is available in the “Investors” section of our website at http://www.giii.com.
WHISTLEBLOWER POLICY
The Whistleblower Policy protects all of our Company Personnel, officers and directors if they raise concerns regarding G-III, such as concerns regarding incorrect financial reporting including questionable accounting, internal controls or auditing matters; unlawful activities; activities that are not in line with G-III policies, including the Code of Ethics and Conduct; or activities which otherwise amount to serious improper conduct. A copy of the Whistleblower Policy is available in the “Investors” section of our website at http://www.giii.com.
| |
24 | |
INSIDER TRADING, HEDGING AND PLEDGING POLICY
The Insider Trading, Hedging and Pledging Policy (the “Trading Policy”) applies to all of our Company Personnel, directors and officers, and prohibits trading or causing trading of our securities while the applicable person is in possession of material non-public information. The Trading Policy, as well as recent amendments to SEC rules, prohibits directors, executive officers and other Company Personnel specified by us, from time to time, from trading in G-III securities during our established blackout periods, except (i) pursuant to a written trading plan approved by our designated compliance officer that are adopted in accordance with Rule 10b5-1 under the Exchange Act, (ii) stock option exercises for cash with no associated open market transaction and (iii) the surrender of shares to us or the retention and withholding of shares by us in satisfaction of tax withholding obligations with respect to stock-settled incentive compensation awards with no associated open market transaction. The Trading Policy provides that no approved plan may be adopted during a blackout period and no trades may occur after adoption until expiration of the applicable cooling-off period specified in Rule 10b5-1. The appropriate cooling-off period will vary based on the status of the person covered by the Trading Policy. For directors and Section 16 officers, the cooling-off period ends on the later of (x) ninety days after adoption or certain modifications of an approved d plan; or (y) two business days following disclosure of the Company's financial results in a Form 10-Q or Form 10-K for the quarter in which the approved plan was adopted, up to a maximum of 120 days. For all other covered persons, the cooling-off period ends 30 days after adoption or modification of the approved plan. This required cooling-off period will apply to the entry into a new approved plan and any revision or modification of any trading plan under Rule 10b5-1, The Trading Policy also prohibits company personnel from entering into hedging transactions with respect to our securities, pledging our securities as collateral for a loan or holding our securities in a margin account. The Board may, in limited circumstances, permit a share pledge by a director or executive officer after giving consideration to the number of shares to be pledged as a percentage of his or her total shares held and G-III’s total shares outstanding. A copy of the Insider Trading, Hedging and Pledging Policy is available in the “Investors” section of our website at http://www.giii.com.
STOCK OWNERSHIP GUIDELINES
The Stock Ownership Guidelines require:
| | |
Position | | Value of Stock Ownership |
Chief Executive Officer | | 6x annual base salary |
Vice Chairman and President | | 2x annual base salary |
Named Executive Officers who are Directors | | 2x annual base salary |
All Other Named Executive Officers | | 1x annual base salary |
Non-Employee Directors | | 5x annual cash retainer |
Until these share ownership levels are achieved, our executive officers and directors are required to retain 50% of any net, after-tax, shares received upon exercise or vesting of our equity grants. All of our officers and directors are in compliance with our Stock Ownership Guidelines, except for one director first elected by the Board in March 2022, three directors first elected to the Board in June 2023 and one executive officer hired in January 2024, each of whom is making progress to satisfy the guidelines. A copy of the Stock Ownership Guidelines is available in the “Investors” section of our website at http://www.giii.com.
EXECUTIVE INCENTIVE COMPENSATION RECOUPMENT POLICY
Pursuant to the Executive Incentive Compensation Recoupment Policy, or “Clawback Policy,” in the event that we are required to restate our financial statements for any financial year, the Compensation Committee will recoup from the affected executive officers all or part of any annual performance-based bonus or long-term incentive awards that were predicated upon the achievement of financial results that were subsequently restated, subject to a 3-year lookback period. The incentive compensation subject to recoupment will consist of performance-based bonuses (including bonuses paid pursuant to employment agreements) and long-term incentive awards or equity grants, to the extent that such bonuses, awards or grants were predicated upon achievement of financial results that are subsequently restated. A copy of the Executive Incentive Compensation Recoupment Policy is included as Exhibit 97 to our Annual Report on Form 10-K for the fiscal year ended January 31, 2024.
| |
| 2024 PROXY STATEMENT / 25 |
|
Executive | Fiscal 2025 Target Award Value (in thousands) |
| Morris Goldfarb | $6,000 |
| Sammy Aaron | $4,500 |
| Jeffrey Goldfarb | $1,500 |
TIMING OF EQUITY AWARDS
We do not coordinate annual equity awards to our Named Executive Officers with the release of material non-public information. The Compensation Committee generally makes equity grants to existing employees on an annual basis. Equity grants to new hires or for promotions will generally are made as of the date of hire or promotion or the first business day of the month following the date of hire or promotion. The Compensation Committee retains the discretion to make grants at other times.
OTHER COMPENSATION ELEMENTS
BENEFITS
Our executives are eligible to participate in company benefit plans generally available to all of our employees, which include health, dental, life insurance, vision and disability plans. We also sponsor a voluntary 401(k) Employee Retirement Savings Plan that provides for a matching contribution equal to 100% of the first 3% of the participant’s contributed pay plus 50% of the next 2% of the participant’s contributed pay. We make an annual contribution of $100,000 to Mr. Goldfarb’s nonqualified deferred compensation account pursuant to his employment agreement that is designed to provide retirement benefits that exceed the limits on qualified plans imposed by the IRS, subject to certain requirements.
PERQUISITES
Consistent with our philosophy of attracting and retaining key executives, we offer perquisites to our NEOs, which we believe are consistent in type and amount with those paid by our competitors. We also provide a supplemental life insurance policy to Mr. Goldfarb.
 For additional information regarding perquisites paid to our executive officers, please see footnote 3 to the Fiscal 2024 Summary Compensation Table below.
EMPLOYMENT AGREEMENTS
We have entered into employment agreements with each of Morris Goldfarb, Sammy Aaron, Jeffrey Goldfarb and Dana Perlman, and executive transition agreements with each of Neal Nackman and Jeffrey Goldfarb, which agreements require us to make payments and provide benefits to them in the event of a termination of employment in connection with a change in control or under certain other circumstances.
The apparel business is highly competitive, and we use employment and executive transition agreements to retain our executive officers and achieve our objectives for management continuity. Our employment and executive transition agreements also specify competitive severance benefits designed to minimize negotiation with executives in the event a termination of employment should occur and ensure continued focus on the business if a change of control occurs. Finally, our employment agreements contain covenants which prevent our executive officers from soliciting our customers and employees and disclosing confidential information about our business plans and practices.
For more information about our employment agreements see “Executive Compensation Tables—Fiscal 2024 Summary Compensation Table—Morris Goldfarb Employment Agreement”, “—Sammy Aaron Employment Agreement” and “—Jeffrey
| |
40 | |
Goldfarb Employment Agreement” and “Potential Payments Upon Termination or Change-in-Control” in this Proxy Statement.
Other Compensation and Governance Programs, Policies and Considerations
STOCK OWNERSHIP GUIDELINES
We have adopted robust stock ownership guidelines for our directors and our Named Executive Officers. These guidelines foster an alignment of the interests of our executive officers with those of our stockholders, promote an ownership culture and long-term perspective among our executives, and act as a form of risk mitigation.
Named Executive Officers and our directors who are also our employees must retain shares with a value denominated as a multiple of base salary as follows:
| | | |
Executive | | | Multiple of Base Salary |
Chief Executive Officer | | | 6x |
Vice Chairman | | | 2x |
Named Executive Officers who are Directors | | | 2x |
All Other Named Executive Officers | | | 1x |
Until executive officers and directors achieve the required guideline, they are required to retain 50% of the net shares obtained from the vesting of restricted stock units or from the exercise of stock options. Shares owned outright and shares held in trust count towards satisfaction of these guidelines; unearned performance shares and unexercised options do not. The Compensation Committee may, in its sole discretion, and in limited instances, grant exceptions to these guidelines. No such exception was granted in fiscal 2024. All our NEOs and directors comply with these guidelines, except for Patti H. Ongman, who was elected as a director in March 2022, Dr. Joyce Brown, Michael Shaffer and Andrew Yaeger, who were elected directors in June 2023, and Dana Perlman who joined the Company as an executive officer in January 2024, each of whom is making progress towards the guidelines.
CLAWBACK/EXECUTIVE INCENTIVE COMPENSATION RECOUPMENT POLICY
Under new SEC rules and NASDAQ’s listing standards, if G-III is required to prepare an accounting restatement, the Compensation Committee will recoup from the affected executive officers all or part of any annual performance-based bonus or long-term incentive awards that were predicated upon the achievement of financial results that were subsequently restated, subject to a 3-year lookback period.
ANTI-HEDGING POLICY
Our directors, executives and other employees are prohibited from engaging in transactions designed to limit or eliminate economic risks from owning G-III’s stock, such as transactions involving any form of margin arrangement, short sales and/or dealing in puts and calls of G-III’s stock.
ANTI-PLEDGING POLICY
Our directors, executives and other employees are generally prohibited from pledging shares of our stock as collateral for any loan or margin account. None of our executives has pledged shares of our stock. The Board may, in its sole discretion and in limited instances, grant exceptions to this policy after considering the number of shares to be pledged as a percentage of the executive’s total shares held and G-III’s total shares outstanding.
| |
| 2024 PROXY STATEMENT / 41 |
How We Make Compensation Decisions
THE ROLE OF THE COMPENSATION COMMITTEE
Our Compensation Committee is responsible for determining the compensation of our executive officers and for evaluating and establishing the overall structure and design of our compensation program.
The Compensation Committee consults with our Chairman and CEO in connection with making its determinations regarding compensation of our other NEOs and relies to a considerable extent on his evaluation of each executive’s performance and his recommendations regarding the amount and mix of the total compensation paid to these executives.
THE ROLE OF MANAGEMENT
Our Chairman and CEO annually makes recommendations on the amount and mix of the total compensation of other NEOs to the Compensation Committee. Our Chairman and CEO is not involved in the determination of his own compensation.
THE ROLE OF INDEPENDENT COMPENSATION CONSULTANTS
The Compensation Committee retained Compensation Advisory Partners (“CAP”) to serve as its independent advisor on executive compensation and corporate governance matters beginning in fiscal 2019. CAP is a nationally recognized executive compensation consultancy and serves as the Committee’s independent advisor on executive compensation and corporate governance matters. In fulfilling these responsibilities, CAP assisted the Committee with its redesign of G-III’s executive compensation program by providing insight and analysis of compensation programs and incentives used by G-III’s peers and other public companies, trends in executive compensation and corporate governance, and the evolving policies and procedures of proxy advisory services firms. CAP also assisted with respect to G-III’s stockholder outreach initiatives.
The Compensation Committee retains sole responsibility for engaging any compensation advisor and meets with its advisor, as needed, in the Committee’s sole discretion. CAP has not performed any services other than executive and director compensation and related corporate governance consulting for G-III and performed its services only on behalf of and at the direction of the Committee. Prior to engaging CAP, the Committee reviewed the factors related to consultant independence and determined that no conflict of interest exists.
THE ROLE OF COMPETITIVE MARKETPLACE PRACTICE
The Compensation Committee periodically reviews the compensation design features and executive pay levels of companies that are comparable to G-III to ensure that our programs are competitive. While the Compensation Committee reviews this information, this process serves as one reference point among others. In making determinations regarding our compensation and related governance programs and pay levels, the Compensation Committee also considers our short- and long-term strategic objectives, individual performance, scope of responsibilities, retention concerns, and previously negotiated contractual obligations.
Our peer companies were selected based on the following parameters:
| ● | Appropriately sized companies with revenues ranging from approximately 0.5 to 2 times those of G-III when selected; |
| ● | Companies operating in the apparel and retail industries with a focus on accessible luxury brands; and |
| ● | Companies from the comparator groups used by our comparators and by stockholder advisory groups. |
| |
42 | |
| (b) | The full amount of our matching contributions under our 401(k) Plan (which are equal to 100% of the participant’s contribution for the first 3% of salary plus 50% of the participant’s contribution for the next 2% of salary, subject to limitations under the IRS regulations). Matching contributions were suspended from May 1, 2020 until January 1, 2022 as part of the cost control measures implemented by G-III in response to the business impact of the COVID-19 pandemic. |
| (c) | Includes $20,000 for tax services paid by us for Mr. Goldfarb and $16,864 for the reimbursement of Mr. Goldfarb’s parking expenses. |
| (d) | Includes our contribution of $100,000 to Mr. Goldfarb’s supplemental executive retirement plan account, $20,000 for tax services paid by us for Mr. Goldfarb and $19.788 for the reimbursement of Mr. Goldfarb’s parking expenses. |
| (e) | Includes our contribution of $100,000 to Mr. Goldfarb’s supplemental executive retirement plan account, $20,000 for tax services paid by us for Mr. Goldfarb and $16,252 for the reimbursement of Mr. Goldfarb’s parking expenses. |
| (f) | The full amount paid by us on Mr. Aaron’s behalf for personal use of his automobile and parking. |
| (g) | The full amount paid by us for the reimbursement of Mr. Goldfarb’s personal use of automobile and parking. |
| ◾ | Morris Goldfarb Employment Agreement |
Morris Goldfarb has an employment agreement with us that is effective through January 31, 2026 with automatic renewal of the term for one-year periods on each January 31st, beginning on January 31, 2026, unless either Mr. Goldfarb or the Company gives six months’ notice of non-renewal to the other party by August 1st of the prior year, commencing August 1, 2025. The agreement provides for an annual base salary of $1,350,000. For information with respect to the annual cash incentive payable to Mr. Goldfarb, see “Compensation Discussion and Analysis—Annual Cash Incentives for our Named Executive Officers” above.
Mr. Goldfarb is entitled to an annual contribution of $100,000 per year to a supplemental pension trust for each year he is employed by us. Mr. Goldfarb is also entitled to a $5,000,000 life insurance policy, which names his wife as beneficiary.
For additional information concerning Morris Goldfarb’s post-termination and change in control benefits, see “Potential Payments Upon Termination or Change-in-Control—Severance and Change in Control Arrangements with Morris Goldfarb” below and for additional information with respect to other aspects of Mr. Goldfarb’s employment agreement, see “Compensation Discussion and Analysis-New Compensation Arrangement for Our Chairman and CEO,” “Compensation Discussion and Analysis-Inducement Awards for Our Chairman and CEO and Our Vice Chairman and President” and “Compensation Discussion and Analysis-Long-Term Incentives.”
| ◾ | Sammy Aaron Employment Agreement |
Mr. Aaron has an employment agreement with us that is effective through January 31, 2025. The agreement provides for automatic renewal of the term for one-year periods on each August 1st prior to the end of the then employment term, commencing with August 1, 2024, unless prior to such August 1st either party shall have given written notice to the other of non-renewal. The agreement provides for an annual base salary of $1,000,000. For information with respect to the annual cash incentive payable to Mr. Aaron, see “Compensation Discussion and Analysis—Annual Cash Incentives of our Named Executive Officers” above.
For additional information concerning Mr. Aaron’s post-termination and change in control benefits, see “Potential Payments Upon Termination or Change-in-Control—Severance and Change in Control Arrangements with Sammy Aaron” below and for additional information with respect to other aspects of Mr. Aaron’s employment agreement, see “Compensation Discussion and Analysis-New Compensation Arrangement for Our Vice Chairman and President,” “Compensation Discussion and Analysis-Inducement Awards for Our Chairman and CEO and Our Vice Chairman and President” and “Compensation Discussion and Analysis-Long-Term Incentives.”
| |
| 2024 PROXY STATEMENT / 45 |
SEVERANCE AND CHANGE IN CONTROL ARRANGEMENTS WITH MORRIS GOLDFARB
In the event we terminate Mr. Goldfarb’s employment for cause (as defined in his employment agreement) or Mr. Goldfarb voluntarily resigns without cause (as defined in his employment agreement), Mr. Goldfarb will not be entitled to any severance or other compensation of any kind following the effective date of such termination, other than such portion of base salary, pro rata annual cash incentive and other compensation accrued through the date of the termination.
In the event we terminate Mr. Goldfarb’s employment without cause, or Mr. Goldfarb terminates his employment for cause, Mr. Goldfarb will be entitled to receive a lump sum cash severance equal to 2.0 times his then current base salary and 2.0 times his target bonus. If such termination is effectuated after the occurrence of a “Change in Control” (as defined in the employment agreement), then, in lieu of the payments described in the preceding sentence, Mr. Goldfarb will be entitled to receive a formula-based lump sum cash payment determined with reference to Section 280G of the Code, plus three years of employee benefit continuation. In general, the formula-based cash severance payment would be an amount equal to 2.99 times the average of Mr. Goldfarb’s annual compensation for the preceding five years. If Mr. Goldfarb’s employment is terminated due to his death, Mr. Goldfarb’s estate will be entitled to receive for a period of twelve months his then current salary and will be eligible to receive annual cash incentive compensation pro-rated according to the number of days of employment in the fiscal year of his death. In the event of his termination due to disability during the term, he will receive 50% of salary for the remaining term of the Employment Agreement.
SEVERANCE AND CHANGE IN CONTROL ARRANGEMENTS WITH SAMMY AARON
If we terminate Mr. Aaron’s employment for justifiable cause (as defined in his employment agreement) or Mr. Aaron voluntarily resigns without good reason (as defined in his employment agreement), Mr. Aaron will not be entitled to any severance or other compensation of any kind following the effective date of such termination, other than such portion of base salary and other compensation accrued through the date of the termination.
In the event Mr. Aaron’s employment is terminated without justifiable cause or by Mr. Aaron for cause or good reason, Mr. Aaron will be entitled to receive (x) his then current annual base salary payable for two (2) years thereafter in equal payroll installments, plus (y) his Target Bonus for the fiscal year in which his employment terminates and for the following fiscal year, in each case payable at the same time such Target Bonus would have been paid had the Executive’s employment not terminated. However, if a “Change in Control” (as defined in the employment agreement) occurs and Mr. Aaron is terminated without justifiable cause, or if he resigns for cause or good reason, within two years of the Change in Control, he will be entitled to cash severance of an amount equal to 2.0 times his five-year average compensation as reported on his form W-2 in equal periodic payroll installments during the twenty-four months after such termination date. In addition, Mr. Aaron will be entitled to receive continuing health benefits for up to 24 months. Our obligation to pay such severance and benefits will be conditioned upon Mr. Aaron’s executing a general release and his continuing to comply with the non-competition and other restrictive covenants contained in his agreement. If Mr. Aaron’s employment agreement is terminated due to his death, Mr. Aaron’s estate will be entitled to receive the base salary for a period of twelve months of his then current salary and will be eligible to receive annual cash incentive compensation pro-rated according to the number of days of employment in the fiscal year of his death. In the event of his termination due to disability during the term, he will receive 50% of salary for the remaining term of the employment agreement.
Mr. Aaron has agreed that, for two years following the termination of his employment (or for a shorter period under certain circumstances following a Change in Control) he will not, directly or indirectly, (a) compete with any business of G-III, (b) interfere with G-III’s business relationships, or (c) solicit or hire G-III employees. In addition, Mr. Aaron has agreed that at any time following the termination of his employment, he will not disclose confidential information (as defined in the employment agreement) of G-III acquired during his employment.
SEVERANCE AND CHANGE IN CONTROL ARRANGEMENTS WITH NEAL NACKMAN
In the event that Neal Nackman is terminated without “Cause” (as defined in his severance letter agreement), Mr. Nackman will be entitled to severance payments equal to one year of benefits previously provided, salary and bonus (based on the average of his bonus in the two years prior to termination).
| |
50 | |
Mr. Nackman is also a party to an executive transition agreement. If Mr. Nackman’s employment is terminated without “cause” or for “good reason” within three months before or two years after a “change in control” (as such terms are defined in his executive transition agreement), then, subject to timely delivery of a general release, he will be entitled to receive cash separation pay in an amount equal to 1.5 times the sum of (a) his highest annual salary in effect during the one-year period before the termination of his employment and (b) the average annual cash bonus he earned during our two fiscal years before the fiscal year of his termination of employment. The cash separation pay, as so determined, will be payable over the 18-month period following termination of employment in accordance with normal payroll practices. In addition to the cash separation payments, Mr. Nackman will be able to receive continuing group health plan benefits on a subsidized basis. The cash separation payments will be reduced if and to the extent necessary to ensure that such amount, when added to other payments and the value of other benefits Mr. Nackman may receive under other plans and agreements (including, for example, the Section 280G value of accelerated vesting of outstanding equity awards), is not greater than the Section 280G threshold amount (generally, three times average annual compensation for the five years preceding the year in which a change in control occurs).
SEVERANCE AND CHANGE IN CONTROL ARRANGEMENTS WITH JEFFREY GOLDFARB
If we terminate Mr. Goldfarb’s employment for justifiable cause (as defined in his employment agreement) or Mr. Goldfarb voluntarily resigns without good reason (as defined in his employment agreement), Mr. Goldfarb will not be entitled to any severance or other compensation of any kind following the effective date of such termination, other than such portion of base salary and other compensation accrued through the date of the termination.
In the event of Mr. Goldfarb’s death during the term, the estate of Mr. Goldfarb shall be entitled to receive any unpaid portion of his annual salary as has been accrued through the date of the death, any unpaid annual bonus attributable to the entire fiscal year in which such termination occurs, any unpaid benefits and any unpaid reimbursable expenses. If the termination is due to disability during the term, Mr. Goldfarb is entitled to any unpaid portion of his annual salary as has accrued through the date of the termination, any unpaid annual bonus attributable to the entire fiscal year in which such termination occurs, any unpaid benefits and any unpaid reimbursable expenses.
If during the term, the Company terminates Mr. Goldfarb’s employment without “justifiable cause” (including if the Company gives written notice to Mr. Goldfarb that the employment term will not be extended further) or if he terminates his employment for “good reason” (each as defined in the Goldfarb Employment Agreement), then Mr. Goldfarb will be entitled to receive his annual salary, reimbursement of expenses, any benefits and any bonus accrued through the date of termination, plus a severance of his annual salary, annual bonus and benefits for a period of 24 months (conditioned upon Mr. Goldfarb’s general release and compliance with non-compete, non-solicitation and confidentiality). For the purposes of determining the severance pay, Mr. Goldfarb’s applicable salary will be the highest annual rate of salary in effect during the one-year period preceding the termination date, and Mr. Goldfarb’s applicable annual bonus will be an annual bonus for each 12-month period during such severance period in an amount equal to the greater of (i) the average annual cash bonus earned by Mr. Goldfarb during the two fiscal years immediately preceding the fiscal year in which the employment terminates and (ii) an annual bonus amount of $500,000 (in addition to his salary compensation for such period).
The Executive Transition Agreement provides that if a Change in Control (as defined therein) occurs and, during the three months before a Change in Control or the two years after a Change in Control, Mr. Goldfarb is terminated by the Company without Cause (as defined therein) or if Mr. Goldfarb resigns for Good Reason (as defined therein), he will be entitled to continuation of specified benefits and periodic severance payments totaling 2 times the sum of (i) his highest annual salary in effect during the one-year period before his termination of employment, plus (ii) the greater of (a) the average annual cash bonus he earned during the two fiscal years before the fiscal year of his termination of employment and (b) an annual bonus amount of $500,000.
SEVERANCE AND CHANGE IN CONTROL ARRANGEMENTS WITH dana perlman
If, during the term, the Company terminates Ms. Perlman’s employment without “justifiable cause” or if she terminates her employment for “good reason” (each as defined in her employment agreement), then Ms. Perlman will be entitled to receive her annual salary, reimbursement of expenses and any bonus accrued through the date of termination, plus a severance of the salary and benefits for a period of 12 months (conditioned upon Ms. Perlman’s general release and compliance of non-compete, non-solicitation and confidentiality).
| |
| 2024 PROXY STATEMENT / 51 |
In the event of Ms. Perlman’s death during the term, the estate of Ms. Perlman shall be entitled to receive any unpaid portion of her annual salary through the date of the death, any unpaid annual bonus attributable to the prior fiscal year, any unpaid benefits and any unpaid reimbursable expenses. If the termination is due to disability during the term, Ms. Perlman is entitled to any unpaid portion of her annual salary through the date of the termination, any unpaid annual bonus attributable to the prior fiscal year (pro-rated based on the days in the prior fiscal year when she was not on leave due to disability), any unpaid benefits and any unpaid reimbursable expenses.
ACCELERATION OF VESTING UPON TERMINATION OR CHANGE IN CONTROL
There are no agreements with the Named Executive Officers that provide for an automatic acceleration of vesting of equity awards upon the occurrence of a change in control. Under the terms of our equity incentive plans, however, vesting of any outstanding equity awards that are assumed by the acquiring company will accelerate upon an involuntary termination of employment within two years after the date of the change in control—a so-called “double trigger” vesting condition. If an equity award is not assumed by the acquiring company, then, under the terms of the plans, vesting will accelerate as part of the change in control transaction.
ESTIMATED PAYOUTS ON TERMINATION OF EMPLOYMENT
The following tables disclose the estimated payments and benefits that would be provided to each of Morris Goldfarb, Sammy Aaron, Neal Nackman, Jeffrey Goldfarb and Dana Perlman, applying the assumptions that each of the triggering events described in their respective employment or executive transition agreements took place on January 31, 2024 and their last day of employment was January 31, 2024.
These amounts are in addition to benefits payable generally to our salaried employees, such as distributions under G-III’s 401(k) plan, disability benefits and accrued vacation pay.
The nature and amount of separation payments and benefits provided upon the events discussed below are dependent upon a number of factors. Accordingly, any actual amounts paid or distributed may be different from those set forth below. Factors that could affect these amounts include the timing during the year of any such event, our stock price and the executive’s age.
| ◾ | MORRIS GOLDFARB, CHAIRMAN AND CHIEF EXECUTIVE OFFICER |
| | | | | | | |
| | | Termination without Cause or | | | Termination without Cause or | |
| | | Resignation for Cause | | | Resignation for Cause or Good Reason in | |
| | | or Good Reason | | | Connection with a Change in Control | |
Cash Separation Payment(s) | | | $10,700,000 | (1) | | $43,590,445 | (2) |
Accelerated Vesting of Equity Awards | | | — | | | $37,038,864 | (3) |
Value of Continuing Employee Benefits | | | — | | | $65,318 | (4) |
Total | | | $10,700,000 | | | $80,694,627 | (5) |
| (1) | The cash payment is based on Mr. Goldfarb’s salary, as of January 31, 2024, and his annual cash incentive target for the fiscal year ended January 31, 2024, and is composed of two times (i) his annual salary of $1,350,000 and (ii) annual cash incentive target of $4,000,000. The cash payment becomes due and payable immediately upon a qualifying termination. |
| (2) | This amount is equal to $43,590,445 (2.99 times Mr. Goldfarb’s average annual compensation for 2019 through 2023). |
| (3) | This amount represents the gross value of accelerated vesting of unvested equity awards outstanding as of January 31, 2024, as shown in the “Stock Awards” table in the section entitled “Outstanding Equity Awards at Fiscal 2024 Year-End” above. For purposes of applying Section 280G of the Code, however, the value of such accelerated vesting would be reduced to reflect a present value factor and the likelihood that the equity awards would have become vested in any event (i.e., as if Mr. Goldfarb’s employment is not involuntarily terminated after the change in control). |
| (4) | The figures for benefit continuation represent the estimated value of all employee benefits for three years in the case of a post-change in control termination. |
| |
52 | |
the ratio of Morris Goldfarb’s total annual compensation to that of our median employee was 1,154 to 1. The CEO pay ratio is skewed upwards by part-time and seasonal employees, paid on an hourly basis, that work in retail stores owned and operated by us. The CEO pay ratio is also skewed upwards as a result of the one-time inducement award under Mr. Goldfarb’s new employment agreement being included in his compensation in the Fiscal 2024 Summary Compensation Table above. Excluding our retail store employees, the median annual compensation for fiscal 2024 of G-III employees, excluding Morris Goldfarb, was $38,640 and excluding the one-time inducement award in the amount of $16,660,000, the total compensation for fiscal 2024 of Mr. Goldfarb was $14,771,039. Based on these amounts, we estimate that, for fiscal 2024, the ratio of Morris Goldfarb’s total annual compensation to that of our median non-retail store employees was 382 to 1.
As of December 31, 2023, G-III employed 4,890 employees worldwide, of which approximately 63% were employed in the U.S., 12% were employed in Asia and 25% were employed in Europe. All compensation elements for non-U.S. employees were converted to U.S. dollars using monthly average exchange rates used by our accounting department.
We identified the median employee using individual income tax compensation reporting for all employees, except Morris Goldfarb, employed by us on December 31, 2023, whether employed on a full-time, part-time, seasonal or temporary basis. We calculated annual total compensation of the median employee in the same manner as our Named Executive Officers in the Fiscal 2024 Summary Compensation Table included in this Proxy Statement. We did not annualize the compensation for any employee employed for less than the calendar year 2023.
The foregoing pay ratio disclosure, which is provided pursuant to the SEC’s guidance under Item 402(u) of Regulation S-K, is intended only to reflect G-III’s reasonable good faith estimate of the CEO pay ratio. It is based on the methodologies, assumptions and estimates described above and is not necessarily comparable to the CEO pay ratios reported by other companies.
FISCAL 2024 PAY vs. PERFORMANCE
The following table sets forth the pay versus performance disclosure required by Section 953(a) of the Dodd-Frank Wall Street Reform and Consumer Protection Act and Item 402(v) of Regulation S-K. The Compensation Committee did not consider the pay versus performance disclosure below in making its pay decisions for any of the years shown. For further information concerning the Company’s pay-for-performance philosophy and how the Company aligns executive compensation with the Company’s performance, refer to “Compensation Discussion and Analysis”.
| | | | | | | | | | | | | | | | |
(a) | | (b) | | (c) | | (d) | | (e) | | (f) | | (g) | | (h) | | (i) |
| | | | | | Average | | | | Value of Initial Fixed $100 | | | | |
| | Summary | | | | Summary | | Average | | Investment Based On: | | | | |
| | Compensation | | Compensation | | Compensation | | Compensation | | | | Peer Group | | | | |
| | Table Total | | Actually Paid | | Table Total for | | Actually Paid to | | Total Share- | | Total Share- | | | | Pre-tax |
Year | | for PEO | | to PEO (1) | | Non-PEO NEOs | | Non-PEO NEOs (1) | | Holder Return | | Holder Return | | Net Income | | Net Income |
2024 | | 31,431,039 | | 44,305,949 | | 5,295,148 | | 8,807,666 | | $ 110.58 | | $ 95.33 | | 174,740 | | 240,599 |
2023 | | 5,790,860 | | (3,406,531) | | 3,371,945 | | 169,702 | | $ 62.18 | | $ 115.37 | | (134,382) | | (138,170) |
2022 | | 24,942,778 | | 26,290,697 | | 5,854,421 | | 6,494,398 | | $ 99.85 | | $ 136.66 | | 200,101 | | 270,976 |
(1) | The dollar amounts shown in these columns reflect compensation actually paid (“CAP”) to Morris Goldfarb and our non-PEO NEOs, respectively, calculated in accordance with SEC rules. As required, the dollar amounts include (among other items) unpaid amounts of equity compensation that may be realized in future periods, and as such, the dollar amounts shown do not fully represent the actual final amount of compensation earned or actually paid to any individual during the applicable years. The adjustments made to each officer’s total compensation for each year to determine CAP are shown in the tables below. |
| |
| 2024 PROXY STATEMENT / 55 |
PROPOSAL NO. 2 ADVISORY VOTE ON COMPENSATION OF OUR NAMED EXECUTIVE OFFICERS
The Dodd-Frank Act enables stockholders to vote to approve, on an advisory (non-binding) basis, the compensation of our Named Executive Officers as disclosed in this Proxy Statement in accordance with the SEC’s rules. In light of the results of the stockholders’ nonbinding advisory vote at the 2023 Annual Meeting with respect to the frequency with which stockholders will vote for the approval of the compensation of G-III’s Named Executive Officers, G-III currently intends to hold an annual nonbinding advisory vote on such Named Executive Officer compensation.
The “Say on Pay” vote is advisory, and therefore is not binding on us, the Compensation Committee or the Board of Directors. However, the Board and the Compensation Committee value the opinions of our stockholders and have conducted extensive stockholder outreach to actively solicit input that helped shape the Compensation Committee’s design of our company’s executive compensation program. To the extent there is any significant vote against the Named Executive Officer compensation as disclosed in this Proxy Statement, the Board and Compensation Committee will consider the stockholders’ concerns and the Board and Compensation Committee will evaluate whether any additional actions are necessary to address those concerns. The Compensation Committee considers the results of the say on pay vote as part of its decision-making process and is committed to remain responsive to shareholder priorities, with the goal of earning consistent high levels of shareholder support. More broadly, as demonstrated by our continuing, active outreach to our stockholders, we value their opinions on executive compensation, as expressed not only in their Say on Pay votes but in our dialogues throughout the year. For more information with respect to our response to input from our stockholders, see the headings “Our Stockholder Outreach Initiative,” “Our ‘Say on Pay’ Results Last Year and Our Response,” “New Compensation Arrangement with Our Chairman and CEO” and “New Compensation Arrangement with Our Vice Chairman and President” contained in “Compensation Discussion and Analysis”.
We are asking our stockholders to indicate their support for the compensation of our Named Executive Officers as disclosed in this Proxy Statement. This proposal, commonly known as a “Say on Pay” proposal, gives stockholders the opportunity to express their views on the compensation paid to our Named Executive Officers. This vote is not intended to address any specific item of compensation, but rather the overall compensation of our Named Executive Officers and the philosophy, policies and practices described in this Proxy Statement. Accordingly, we are asking the stockholders to vote “FOR” the following resolution at the Annual Meeting:
RESOLVED, that G-III’s stockholders approve, on an advisory basis, the compensation of G-III’s Named Executive Officers, as disclosed in G-III’s Proxy Statement for the 2024 Annual Meeting of Stockholders, pursuant to the compensation disclosure rules of the Securities and Exchange Commission, including the Compensation Discussion and Analysis, the compensation tables, and other related tables and disclosure.

| | |
| The Board of Directors deems Proposal No. 2 to be in the best interests of G-III and our stockholders and recommends a vote FOR approval thereof. | |
| | |
| |
| 2024 PROXY STATEMENT / 67 |
PRINCIPAL ACCOUNTING FEES AND SERVICES
The following table sets forth fees we paid for audit, audit-related, tax and other services provided by Ernst & Young LLP during each of the last two fiscal years.
| | | | | | |
| | | Fiscal Year Ended January 31, |
| | | 2024 | | | 2023 |
Audit fees | | | $4,133,000 | | | $3,909,000 |
Audit-related fees | | | - | | | 622,000 |
Tax fees | | | 994,000 | | | 1,480,000 |
All other fees | | | 5,000 | | | - |
Total | | | $5,132,000 | | | $6,011,000 |
AUDIT FEES
Audit fees include services associated with the audit of our annual financial statements included in our Annual Report on Form 10-K, the audit of management’s assessment and overall effectiveness of internal control over financial reporting, review of financial statements included in our quarterly reports on Form 10-Q and statutory audits of foreign subsidiaries during each fiscal year.
AUDIT-RELATED FEES
Audit-related fees included financial due diligence procedures performed with respect to the Karl Lagerfeld acquisition.
TAX FEES
Tax fees include services related to U.S. federal, state and local and international tax compliance, assistance with tax audits, tax advice and tax planning. These services also included services related to sales and use tax administration, transfer pricing studies and assistance on miscellaneous international tax issues. For fiscal year 2023, tax fees also include due diligence procedures performed for potential acquisitions.
ALL OTHER FEES
All other fees include services related to an accounting research tool.
review and approval of services and fees
The Audit Committee has considered whether the provision of the above services is compatible with maintaining Ernst & Young LLP’s independence and all of the above services were pre-approved by the Audit Committee.
It is the Audit Committee’s policy to pre-approve all audit and permissible non-audit services to be performed by our independent accountants, the fees to be paid for those services and the time period over which those services are to be provided. On an annual basis, the independent accountants present a listing of all services they expect to perform for us in the ensuing one-year period, including fee estimates, in sufficient detail to enable the Audit Committee to perform an independence review of each proposed service. The Audit Committee reviews this list and approves appropriate services, which, in the Audit Committee’s judgment, will not impair the accountants’ independence. With respect to any additional services proposed to be performed by the independent accountants during the year, management will evaluate the impact on the independent accountant’s independence and obtain Audit Committee approval for such service. The Audit Committee has delegated interim pre-approval authority to the Chairman of the Audit Committee.
| |
| 2024 PROXY STATEMENT / 69 |
STOCKHOLDER PROPOSALS
All stockholder proposals that are intended to be presented at our Annual Meeting of Stockholders to be held in 2025 must be received by us no later than January 10, 2025 for inclusion in the Board of Directors’ Proxy Statement and form of proxy relating to that meeting. Any stockholder proposal must also be proper in form and substance, as determined in accordance with the Exchange Act and the rules and regulations promulgated thereunder. All such proposals should be addressed to G-III Apparel Group, Ltd., 512 Seventh Avenue, New York, NY 10018, Attention: Secretary.
Any stockholder who intends to nominate a person for election to the Board of Directors or propose any other matter to be acted upon at the Annual Meeting of Stockholders to be held in 2025 (but not include such proposal in the Board of Directors’ Proxy Statement and form of proxy) must inform us no later than March 20, 2025. If notice is not provided by that date, the persons named in the proxy for the 2025 Annual Meeting will be allowed to exercise their discretionary authority to vote upon any such proposal without the matter having been discussed in the Proxy Statement for the 2025 Annual Meeting. All notices should be addressed to G-III Apparel Group, Ltd., 512 Seventh Avenue, New York, NY 10018, Attention: Secretary.
For the nomination of any person to the Board of Directors, the notice must set forth (a) the name, age, business address and residence address of the nominee, (b) the principal occupation or employment of the nominee, (c) the number of shares of capital stock of G-III which are owned of record and beneficially by the nominee (if any), (d) such other information concerning the nominee as would be required to be disclosed in a Proxy Statement soliciting proxies for the election of the nominee as a director in an election contest (even if an election contest is not involved) or that is otherwise required to be disclosed, under Section 14(a) of the Exchange Act and the rules and regulations promulgated thereunder, (e) the consent of the nominee to being named in the Proxy Statement as a nominee and to serving as a director if elected, and (f) as to the proposing stockholder: (i) the name and address of the proposing stockholder as they appear on G-III’s books and of the beneficial owner, if any, on whose behalf the nomination is being made, (ii) the class and number of G-III shares which are owned by the proposing stockholder (beneficially and of record) and owned by the beneficial owner, if any, on whose behalf the nomination is being made, as of the date of the proposing stockholder’s notice, (iii) a description of any agreement, arrangement or understanding with respect to such nomination between or among the proposing stockholder and any of its affiliates or associates, and any others (including their names) acting in concert with any of the foregoing, (iv) a description of any agreement, arrangement or understanding (including any derivative or short positions, profit interests, options, hedging transactions, and borrowed or loaned shares) that has been entered into as of the date of the proposing stockholder’s notice by, or on behalf of, the proposing stockholder or any of its affiliates or associates, the effect or intent of which is to mitigate loss to, manage risk or benefit of share price changes for, or increase or decrease the voting power of the proposing stockholder or any of its affiliates or associates with respect to shares of stock of G-III, (v) a representation that the proposing stockholder is a holder of record of shares of G-III entitled to vote at the meeting and intends to appear in person or by proxy at the meeting to nominate the person or persons specified in the notice, and (vi) a representation whether the proposing stockholder intends to deliver a Proxy Statement and/or form of proxy to holders of G-III’s outstanding capital stock and/or otherwise to solicit proxies from stockholders in support of the nomination. The proposing stockholder should also comply with the additional requirements of a proper notice under Rule 14a-19, which includes the statement that a dissident using the universal proxy rule intends to solicit 67% of the outstanding voting shares entitled to vote on the election of directors. G-III may require any proposed nominee to furnish such other information as it may reasonably require to determine the eligibility of such proposed nominee to serve as an independent director of G-III or that could be material to a reasonable stockholder’s understanding of the independence, or lack thereof, of such nominee.
For all business other than director nominations, the notice must set forth as to each matter the proposing stockholder proposes to bring before the annual meeting: (a) a brief description of the business desired to be brought before the annual meeting and the reasons for conducting such business at the annual meeting, (b) any other information relating to such stockholder and beneficial owner, if any, on whose behalf the proposal is being made, required to be disclosed in a Proxy Statement or other filings required to be made in connection with solicitations of proxies for the proposal and pursuant to and in accordance with Section 14(a) of the Exchange Act and the rules and regulations promulgated thereunder and (c) the information as to the proposing stockholder required by clause (f) in the first sentence of the preceding paragraph.
| |
72  | |
Pay vs Performance Disclosure - USD ($)
|
12 Months Ended |
Jan. 31, 2024 |
Jan. 31, 2023 |
Jan. 31, 2022 |
| Pay vs Performance Disclosure |
|
|
|
| Pay vs Performance Disclosure, Table |
| | | | | | | | | | | | | | | | | (a) | | (b) | | (c) | | (d) | | (e) | | (f) | | (g) | | (h) | | (i) | | | | | | | Average | | | | Value of Initial Fixed $100 | | | | | | | Summary | | | | Summary | | Average | | Investment Based On: | | | | | | | Compensation | | Compensation | | Compensation | | Compensation | | | | Peer Group | | | | | | | Table Total | | Actually Paid | | Table Total for | | Actually Paid to | | Total Share- | | Total Share- | | | | Pre-tax | Year | | for PEO | | to PEO (1) | | Non-PEO NEOs | | Non-PEO NEOs (1) | | Holder Return | | Holder Return | | Net Income | | Net Income | 2024 | | 31,431,039 | | 44,305,949 | | 5,295,148 | | 8,807,666 | | $ 110.58 | | $ 95.33 | | 174,740 | | 240,599 | 2023 | | 5,790,860 | | (3,406,531) | | 3,371,945 | | 169,702 | | $ 62.18 | | $ 115.37 | | (134,382) | | (138,170) | 2022 | | 24,942,778 | | 26,290,697 | | 5,854,421 | | 6,494,398 | | $ 99.85 | | $ 136.66 | | 200,101 | | 270,976 |
(1) | The dollar amounts shown in these columns reflect compensation actually paid (“CAP”) to Morris Goldfarb and our non-PEO NEOs, respectively, calculated in accordance with SEC rules. As required, the dollar amounts include (among other items) unpaid amounts of equity compensation that may be realized in future periods, and as such, the dollar amounts shown do not fully represent the actual final amount of compensation earned or actually paid to any individual during the applicable years. The adjustments made to each officer’s total compensation for each year to determine CAP are shown in the tables below. |
|
|
|
| Company Selected Measure Name |
Pre-tax Net Income
|
|
|
| Named Executive Officers, Footnote |
| | | | | | | | | | | | | | | | | (a) | | (b) | | (c) | | (d) | | (e) | | (f) | | (g) | | (h) | | (i) | | | | | | | Average | | | | Value of Initial Fixed $100 | | | | | | | Summary | | | | Summary | | Average | | Investment Based On: | | | | | | | Compensation | | Compensation | | Compensation | | Compensation | | | | Peer Group | | | | | | | Table Total | | Actually Paid | | Table Total for | | Actually Paid to | | Total Share- | | Total Share- | | | | Pre-tax | Year | | for PEO | | to PEO (1) | | Non-PEO NEOs | | Non-PEO NEOs (1) | | Holder Return | | Holder Return | | Net Income | | Net Income | 2024 | | 31,431,039 | | 44,305,949 | | 5,295,148 | | 8,807,666 | | $ 110.58 | | $ 95.33 | | 174,740 | | 240,599 | 2023 | | 5,790,860 | | (3,406,531) | | 3,371,945 | | 169,702 | | $ 62.18 | | $ 115.37 | | (134,382) | | (138,170) | 2022 | | 24,942,778 | | 26,290,697 | | 5,854,421 | | 6,494,398 | | $ 99.85 | | $ 136.66 | | 200,101 | | 270,976 |
(1) | The dollar amounts shown in these columns reflect compensation actually paid (“CAP”) to Morris Goldfarb and our non-PEO NEOs, respectively, calculated in accordance with SEC rules. As required, the dollar amounts include (among other items) unpaid amounts of equity compensation that may be realized in future periods, and as such, the dollar amounts shown do not fully represent the actual final amount of compensation earned or actually paid to any individual during the applicable years. The adjustments made to each officer’s total compensation for each year to determine CAP are shown in the tables below. |
The tables below reflect the average total compensation of our non-PEO NEOs, as calculated in the Summary Compensation Table for each of the years shown. Our non-PEO NEOs are the following individuals: for fiscal 2024, Sammy Aaron, Neal Nackman, Jeffrey Goldfarb and Dana Perlman, who became an NEO on January 8, 2024; for fiscal 2023, Sammy Aaron, Neal Nackman and Jeffrey Goldfarb; and for fiscal 2022, Sammy Aaron, Neal Nackman, Jeffrey Goldfarb and Wayne Miller, who ceased being an NEO effective July 1, 2021.
|
|
|
| PEO Total Compensation Amount |
$ 31,431,039
|
$ 5,790,860
|
$ 24,942,778
|
| PEO Actually Paid Compensation Amount |
$ 44,305,949
|
(3,406,531)
|
26,290,697
|
| Adjustment To PEO Compensation, Footnote |
As shown in the tables below, the CAP totals represent the Summary Compensation Table totals for the applicable year, but adjusted as required by SEC rules to include the fair value of current and prior year equity awards that are outstanding, vested, or forfeited during the applicable year, instead of the grant date value of awards granted during the applicable year. | | | | | | | | | | | Reported Summary | | | | | | | | | Compensation Table | | Reported Value | | Equity Award | | Compensation Actually | Year | | Total for PEO | | of Equity Awards (1) | | Adjustments (2) | | Paid to PEO | 2024 | | 31,431,039 | | (20,709,998) | | 33,584,908 | | 44,305,949 | 2023 | | 5,790,860 | | (4,499,972) | | (4,697,419) | | (3,406,531) | 2022 | | 24,942,778 | | (16,167,626) | | 17,515,545 | | 26,290,697 |
(1) | Represents the total of the amounts reported in the Stock Awards column of the Summary Compensation Table for the applicable year. |
(2) | The fair value of the of the equity component of the CAP calculation was determined in accordance with SEC methodology for this disclosure. Unlike the Summary Compensation Table, which includes a calculation of the grant date value of equity awards granted during the applicable year, the CAP table includes a calculation of equity fair value as follows: |
| a. | for awards granted during the applicable year (and which are still outstanding), the year-end value; plus |
| b. | for awards granted during prior years that were still outstanding as of the applicable year-end, the change in value as of the applicable year-end compared against the prior year-end; plus |
| c. | for awards granted in prior that vested during the applicable year, the change in value as of the vesting date compared against the prior year-end; plus |
| d. | for any awards granted in the applicable year that vested during the applicable year, the value as of the vesting date; plus |
| e. | for awards granted in prior years that were forfeited during the applicable year, the value as of the prior year-end. |
| | | | | | | | | | | | | | | (a) | | (b) | | (c) | | (d) | | (e) | | | | | | | | | | | | | | | | PEO | | | | | | | | Year over Year | | Fair Value at | | | | | | | | | | | Change in Fair | | the End of the | | | | | | | Year over Year | | Fair Value as | | Value of | | Prior Year of | | | | | Year End Fair | | Change in Fair | | of Vesting Date | | Equity Awards | | Equity Awards | | | | | Value of | | Value of | | of Equity | | Granted in | | that Failed to | | Total | | | Outstanding | | Outstanding and | | Awards Granted | | Prior Years that | | Meet Vesting | | Equity | | | and Unvested | | Unvested Equity | | and Vested in | | Vested in | | Conditions | | Award | Year | | Equity Awards | | Awards | | the Year | | the Year | | in the Year | | Adjustments | 2024 | | 31,251,023 | | 1,186,386 | | — | | 1,147,500 | | — | | 33,584,908 | 2023 | | 908,731 | | (5,474,346) | | — | | (131,804) | | — | | (4,697,419) | 2022 | | 4,322,272 | | 769,298 | | 12,167,656 | | 256,319 | | — | | 17,515,545 |
|
|
|
| Non-PEO NEO Average Total Compensation Amount |
$ 5,295,148
|
3,371,945
|
5,854,421
|
| Non-PEO NEO Average Compensation Actually Paid Amount |
$ 8,807,666
|
169,702
|
6,494,398
|
| Adjustment to Non-PEO NEO Compensation Footnote |
The tables below reflect the average total compensation of our non-PEO NEOs, as calculated in the Summary Compensation Table for each of the years shown. Our non-PEO NEOs are the following individuals: for fiscal 2024, Sammy Aaron, Neal Nackman, Jeffrey Goldfarb and Dana Perlman, who became an NEO on January 8, 2024; for fiscal 2023, Sammy Aaron, Neal Nackman and Jeffrey Goldfarb; and for fiscal 2022, Sammy Aaron, Neal Nackman, Jeffrey Goldfarb and Wayne Miller, who ceased being an NEO effective July 1, 2021. | | | | | | | | | | | Average Reported | | | | | | | | | Summary Compensation | | | | | | Average Compensation | | | Total Table for | | Average Reported Value | | Average Equity | | Actually Paid | Year | | Non-PEO NEOs | | of Equity Awards (3) | | Award Adjustments (4) | | to Non-PEO NEOs | 2024 | | 5,295,148 | | (1,199,983) | | 4,712,501 | | 8,807,666 | 2023 | | 3,371,945 | | (1,666,643) | | (1,535,600) | | 169,702 | 2022 | | 5,854,421 | | (2,420,636) | | 3,060,612 | | 6,494,398 |
(3) | Represents the total of the amounts reported in the Stock Awards column of the Summary Compensation Table for the applicable year. |
(4) | The fair value of the of the equity component of the CAP calculation was determined in accordance with SEC methodology for this disclosure. Unlike the Summary Compensation Table, which includes a calculation of the grant date value of equity awards granted during the applicable year, the CAP table includes a calculation of equity fair value as follows: |
| a. | for awards granted during the applicable year (and which are still outstanding), the year-end value; plus |
| b. | for awards granted during prior years that were still outstanding as of the applicable year-end, the change in value as of the applicable year-end compared against the prior year-end; plus |
| c. | for awards granted in prior that vested during the applicable year, the change in value as of the vesting date compared against the prior year-end; plus |
| d. | for any awards granted in the applicable year that vested during the applicable year, the value as of the vesting date; plus |
| e. | for awards granted in prior years that were forfeited during the applicable year, the value as of the prior year-end. |
| | | | | | | | | | | | | | | (a) | | (b) | | (c) | | (d) | | (e) | | | | | | | | | | | | | | | | Non-PEO | | | | | | | | | | Average | | | NEO's | | | | | | | | Year over Year | | Fair Value at | | | | | | | | | Average | | Average Change | | the End of the | | | | | | | Year over Year | | Fair Value as | | in Fair Value | | Prior Year of | | | | | | | Average Change | | of Vesting Date | | of Equity | | Equity Awards | | Total | | | Average | | in Fair Value | | of Equity | | Awards Granted | | that Failed to | | Average | | | Year End Fair | | of Outstanding | | Awards Granted | | in Prior Years | | Meet Vesting | | Equity | | | Value of | | and Unvested | | and Vested in | | that Vested in | | Conditions | | Award | Year | | Equity Awards | | Equity Awards | | the Year | | the Year | | in the Year | | Adjustments | 2024 | | 2,792,521 | | 1,504,330 | | — | | 415,650 | | — | | 4,712,501 | 2023 | | 448,751 | | (1,939,445) | | — | | (44,906) | | — | | (1,535,600) | 2022 | | 1,411,940 | | 294,826 | | 1,113,980 | | 239,867 | | — | | 3,060,612 |
|
|
|
| Compensation Actually Paid vs. Total Shareholder Return |
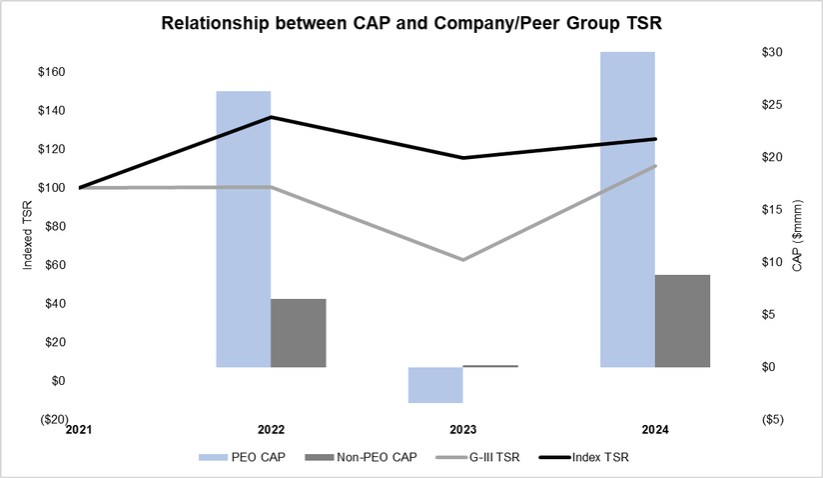
|
|
|
| Compensation Actually Paid vs. Net Income |
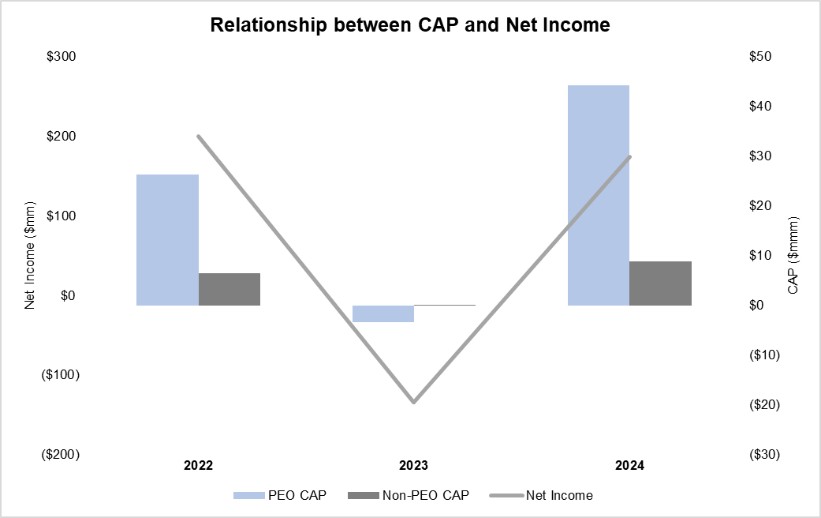
|
|
|
| Compensation Actually Paid vs. Company Selected Measure |
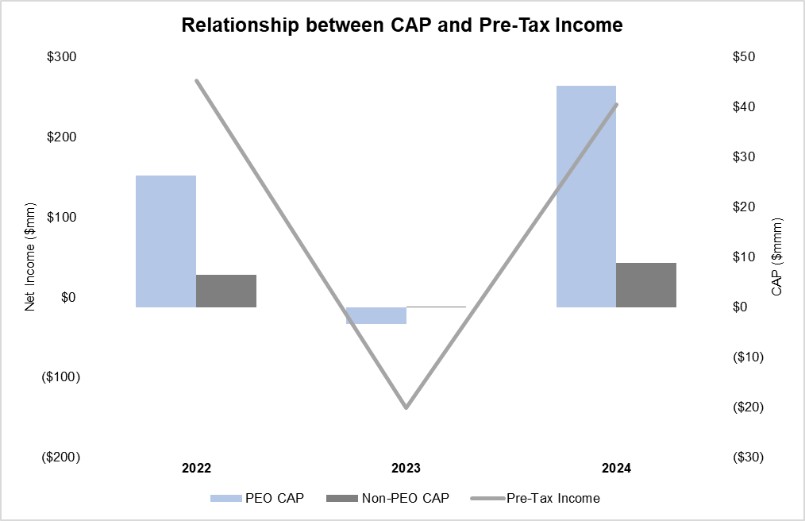
|
|
|
| Total Shareholder Return Vs Peer Group |
|
|
|
| Total Shareholder Return Amount |
$ 110.58
|
62.18
|
99.85
|
| Peer Group Total Shareholder Return Amount |
95.33
|
115.37
|
136.66
|
| Net Income (Loss) |
$ 174,740
|
$ (134,382)
|
$ 200,101
|
| Company Selected Measure Amount |
240,599
|
(138,170)
|
270,976
|
| PEO Name |
Morris Goldfarb
|
|
|
| PEO | Reported Value of Equity Awards |
|
|
|
| Pay vs Performance Disclosure |
|
|
|
| Adjustment to Compensation, Amount |
$ (20,709,998)
|
$ (4,499,972)
|
$ (16,167,626)
|
| PEO | Equity Award Adjustments |
|
|
|
| Pay vs Performance Disclosure |
|
|
|
| Adjustment to Compensation, Amount |
33,584,908
|
(4,697,419)
|
17,515,545
|
| PEO | Year End Fair Value of Outstanding and Unvested Equity Awards |
|
|
|
| Pay vs Performance Disclosure |
|
|
|
| Adjustment to Compensation, Amount |
31,251,023
|
908,731
|
4,322,272
|
| PEO | Year over Year Change in Fair Value of Outstanding and Unvested Equity Awards |
|
|
|
| Pay vs Performance Disclosure |
|
|
|
| Adjustment to Compensation, Amount |
1,186,386
|
(5,474,346)
|
769,298
|
| PEO | Year over Year Change in Fair Value of Equity Awards Granted in Prior Years that Vested in the Year |
|
|
|
| Pay vs Performance Disclosure |
|
|
|
| Adjustment to Compensation, Amount |
1,147,500
|
(131,804)
|
256,319
|
| PEO | Fair Value as of Vesting Date of Equity Awards Granted and Vested in the Year |
|
|
|
| Pay vs Performance Disclosure |
|
|
|
| Adjustment to Compensation, Amount |
|
|
12,167,656
|
| Non-PEO NEO | Reported Value of Equity Awards |
|
|
|
| Pay vs Performance Disclosure |
|
|
|
| Adjustment to Compensation, Amount |
(1,199,983)
|
(1,666,643)
|
(2,420,636)
|
| Non-PEO NEO | Equity Award Adjustments |
|
|
|
| Pay vs Performance Disclosure |
|
|
|
| Adjustment to Compensation, Amount |
4,712,501
|
(1,535,600)
|
3,060,612
|
| Non-PEO NEO | Year End Fair Value of Outstanding and Unvested Equity Awards |
|
|
|
| Pay vs Performance Disclosure |
|
|
|
| Adjustment to Compensation, Amount |
2,792,521
|
448,751
|
1,411,940
|
| Non-PEO NEO | Year over Year Change in Fair Value of Outstanding and Unvested Equity Awards |
|
|
|
| Pay vs Performance Disclosure |
|
|
|
| Adjustment to Compensation, Amount |
1,504,330
|
(1,939,445)
|
294,826
|
| Non-PEO NEO | Year over Year Change in Fair Value of Equity Awards Granted in Prior Years that Vested in the Year |
|
|
|
| Pay vs Performance Disclosure |
|
|
|
| Adjustment to Compensation, Amount |
$ 415,650
|
$ (44,906)
|
239,867
|
| Non-PEO NEO | Fair Value as of Vesting Date of Equity Awards Granted and Vested in the Year |
|
|
|
| Pay vs Performance Disclosure |
|
|
|
| Adjustment to Compensation, Amount |
|
|
$ 1,113,980
|
