Pay vs Performance Disclosure - USD ($)
|
12 Months Ended |
Dec. 31, 2024 |
Dec. 31, 2023 |
Dec. 31, 2022 |
Dec. 31, 2021 |
Dec. 31, 2020 |
| Pay vs Performance Disclosure |
|
|
|
|
|
| Pay vs Performance Disclosure, Table |
The following table sets forth the CAP to our PEO and average of our Non-PEO NEOs, serving in such capacity, along with certain measures of Company performance in each of the fiscal years ended on December 31 as listed below: | | | | | | | | | | | | | | | | | | | | | | | | | | | Summary | | | | | Average Summary | | Average | | Value of Initial Fixed | | | | | | | | | Compensation | | Compensation | | Compensation | | Compensation | | $100 Investment Based on | | | | | | | | | Table | | Actually Paid | | Table Total for | | Actually Paid | | Total Shareholder | | Peer Group | | | | | | | | Total | | to the | | Non-PEO | | to Non-PEO | | Return | | Total Shareholder | | (in thousands) | Year | | for PEO | | PEO (1) (2) | | NEOs | | NEOs (1) (3) | | (TSR) - POWI | | Return (4) | | Net Income | | Net Revenues | 2024 | | $ | 8,610,159 | | $ | 8,846,860 | | $ | 2,387,012 | | $ | 1,966,748 | | $ | 130.27 | | $ | 287.31 | | $ | 32,234 | | $ | 418,973 | 2023 | | $ | 8,218,982 | | $ | 6,836,603 | | $ | 2,503,959 | | $ | 2,415,342 | | $ | 171.35 | | $ | 238.72 | | $ | 55,735 | | $ | 444,538 | 2022 | | $ | 7,015,329 | | $ | (13,137,041) | | $ | 1,737,581 | | $ | (725,064) | | $ | 148.28 | | $ | 142.94 | | $ | 170,851 | | $ | 651,138 | 2021 | | $ | 6,564,685 | | $ | 16,724,842 | | $ | 1,784,763 | | $ | 3,351,766 | | $ | 190.35 | | $ | 219.51 | | $ | 164,413 | | $ | 703,277 | 2020 | | $ | 5,733,115 | | $ | 23,622,794 | | $ | 1,514,513 | | $ | 4,824,198 | | $ | 166.78 | | $ | 153.66 | | $ | 71,176 | | $ | 488,318 |
| (1) | See supplemental disclosures below for adjustments made to arrive at CAP for PEO and Non-PEO NEOs. |
| (2) | For fiscal years 2024, 2023, 2022, 2021 and 2020, Balu Balakrishnan served as our President and Chief Executive officer. |
| (3) | For fiscal year 2024, Non-PEO NEOs were Sandeep Nayyar, Radu Barsan, Sunil Gupta and Clifford J. Walker. For fiscal year 2023, Non-PEO NEOs were Sandeep Nayyar, Radu Barsan, Sunil Gupta and Yang Chiah Yee. For fiscal years 2022 and 2021, Non-PEO NEOs were Sandeep Nayyar, Radu Barsan, Mike Matthews and Yang Chiah Yee. For fiscal year 2020, Non-PEO NEOs were Sandeep Nayyar, Radu Barsan, Mike Matthews and Ben Sutherland. |
| (4) | Peer Group TSR is based on Philadelphia Stock Exchange Semiconductor Sector Index (SOX) (the “Industry Index”). SOX is a market cap weighted index of 30 US-listed semiconductor companies. |
|
|
|
|
|
| Company Selected Measure Name |
Net Revenues
|
|
|
|
|
| Named Executive Officers, Footnote |
| (2) | For fiscal years 2024, 2023, 2022, 2021 and 2020, Balu Balakrishnan served as our President and Chief Executive officer. |
| (3) | For fiscal year 2024, Non-PEO NEOs were Sandeep Nayyar, Radu Barsan, Sunil Gupta and Clifford J. Walker. For fiscal year 2023, Non-PEO NEOs were Sandeep Nayyar, Radu Barsan, Sunil Gupta and Yang Chiah Yee. For fiscal years 2022 and 2021, Non-PEO NEOs were Sandeep Nayyar, Radu Barsan, Mike Matthews and Yang Chiah Yee. For fiscal year 2020, Non-PEO NEOs were Sandeep Nayyar, Radu Barsan, Mike Matthews and Ben Sutherland. |
|
|
|
|
|
| Peer Group Issuers, Footnote |
| (4) | Peer Group TSR is based on Philadelphia Stock Exchange Semiconductor Sector Index (SOX) (the “Industry Index”). SOX is a market cap weighted index of 30 US-listed semiconductor companies. |
|
|
|
|
|
| PEO Total Compensation Amount |
$ 8,610,159
|
$ 8,218,982
|
$ 7,015,329
|
$ 6,564,685
|
$ 5,733,115
|
| PEO Actually Paid Compensation Amount |
$ 8,846,860
|
6,836,603
|
(13,137,041)
|
16,724,842
|
23,622,794
|
| Adjustment To PEO Compensation, Footnote |
The below table presents the reconciliation between amounts reported in the Summary Compensation Table and CAP for our PEO and average for Non-PEO NEOs for the year ended December 31, 2024. | | | | | | | | | PEO | | Non-PEO NEOs | Summary compensation table total | | $ | 8,610,159 | | $ | 2,387,012 | Exclusion of stock awards | | | (7,856,013) | | | (1,951,206) | Fair value of unvested current year awards at fiscal year end | | | 10,012,408 | | | 2,083,334 | Change in value of prior year awards vesting during the year | | | (418,538) | | | (104,137) | Change in value of unvested equity from prior years | | | (1,501,156) | | | (448,255) | Compensation actually paid | | $ | 8,846,860 | | $ | 1,966,748 |
|
|
|
|
|
| Non-PEO NEO Average Total Compensation Amount |
$ 2,387,012
|
2,503,959
|
1,737,581
|
1,784,763
|
1,514,513
|
| Non-PEO NEO Average Compensation Actually Paid Amount |
$ 1,966,748
|
2,415,342
|
(725,064)
|
3,351,766
|
4,824,198
|
| Adjustment to Non-PEO NEO Compensation Footnote |
The below table presents the reconciliation between amounts reported in the Summary Compensation Table and CAP for our PEO and average for Non-PEO NEOs for the year ended December 31, 2024. | | | | | | | | | PEO | | Non-PEO NEOs | Summary compensation table total | | $ | 8,610,159 | | $ | 2,387,012 | Exclusion of stock awards | | | (7,856,013) | | | (1,951,206) | Fair value of unvested current year awards at fiscal year end | | | 10,012,408 | | | 2,083,334 | Change in value of prior year awards vesting during the year | | | (418,538) | | | (104,137) | Change in value of unvested equity from prior years | | | (1,501,156) | | | (448,255) | Compensation actually paid | | $ | 8,846,860 | | $ | 1,966,748 |
|
|
|
|
|
| Equity Valuation Assumption Difference, Footnote |
The fair value of our equity awards is determined in accordance with the provisions of ASC 718-10, Stock Compensation. Time-vested restricted stock unit grant date fair values are calculated using the stock price as of date of grant. Adjustments have been made using the stock price as of year end and as of each date of vest to reflect the change in fair value. Performance-based restricted stock unit grant date fair values are calculated using the stock price as of date of grant assuming target performance. Adjustments have been made using the stock price and performance expectations as of year end and as of the date of vest to reflect the change in fair value.
|
|
|
|
|
| Compensation Actually Paid vs. Total Shareholder Return |
The following graph shows the relationship between CAP and TSR for both the Company and Industry Index, as represented by the Philadelphia Stock Exchange Semiconductor Sector Index. TSR shows the cumulative total return on an investment of $100 in cash on December 31, 2019, through December 31, 2024, in our common stock and the Industry Index, assuming that all dividends were reinvested. The return shown on the graph below is not necessarily indicative of future performance, and we do not make or endorse any predictions as to future stockholder returns. 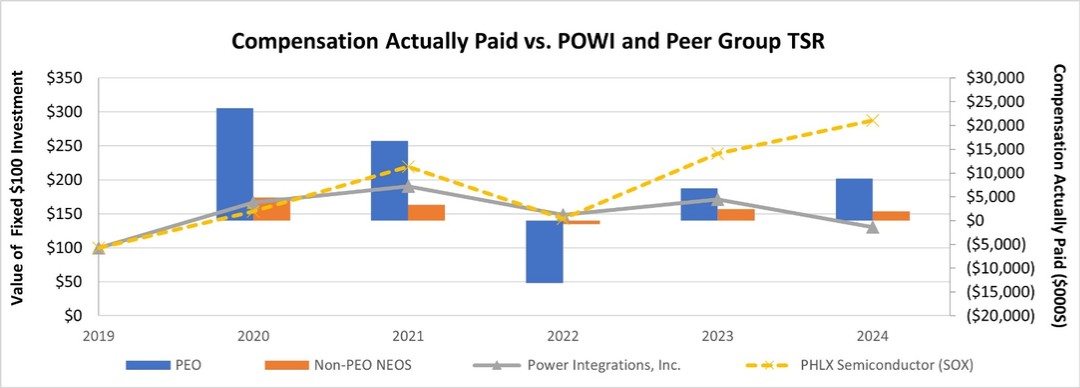
|
|
|
|
|
| Compensation Actually Paid vs. Net Income |
The following graph shows the relationship between CAP and Net Income: 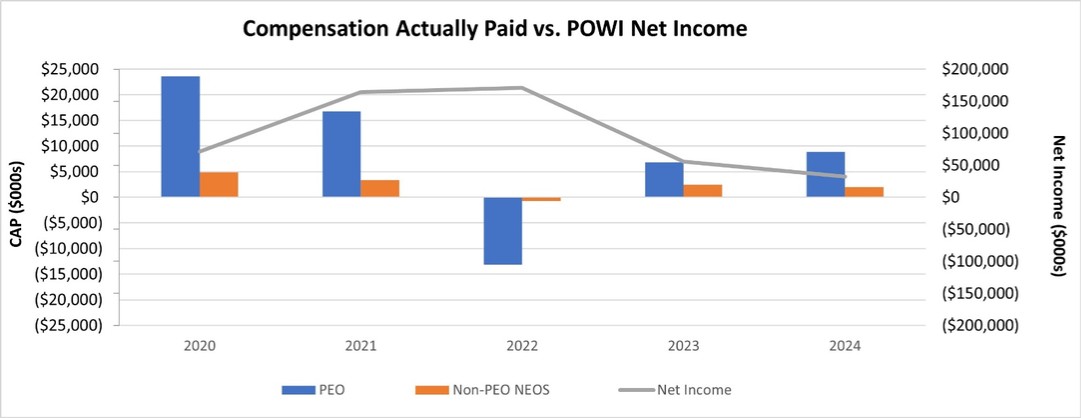
|
|
|
|
|
| Compensation Actually Paid vs. Company Selected Measure |
The following graph shows the relationship between CAP and Net Revenues: 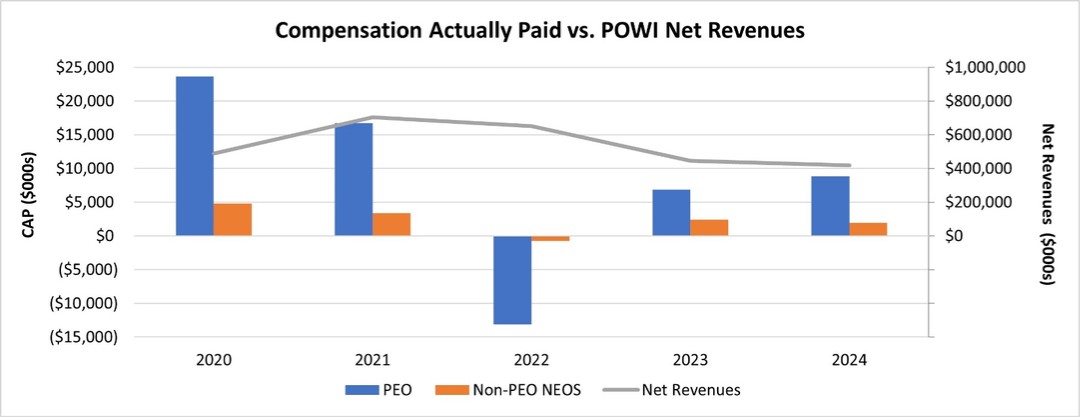
|
|
|
|
|
| Total Shareholder Return Vs Peer Group |
The following graph shows the relationship between CAP and TSR for both the Company and Industry Index, as represented by the Philadelphia Stock Exchange Semiconductor Sector Index. TSR shows the cumulative total return on an investment of $100 in cash on December 31, 2019, through December 31, 2024, in our common stock and the Industry Index, assuming that all dividends were reinvested. The return shown on the graph below is not necessarily indicative of future performance, and we do not make or endorse any predictions as to future stockholder returns.
|
|
|
|
|
| Tabular List, Table |
The following are the Company’s three most important performance measures for determining NEO compensation for 2024: | 2024 Performance Measures | Net Revenues | Non-GAAP Operating Income | Relative Revenue (1) |
| (1) | Relative Revenue refers to the Company’s Revenue CAGRs as compared to the Revenue CAGR of the analog semiconductor industry over similar periods. See section “Mechanics of 2024 Performance-based Equity Incentive Awards” above for further details. |
|
|
|
|
|
| Total Shareholder Return Amount |
$ 130.27
|
171.35
|
148.28
|
190.35
|
166.78
|
| Peer Group Total Shareholder Return Amount |
287.31
|
238.72
|
142.94
|
219.51
|
153.66
|
| Net Income (Loss) |
$ 32,234,000
|
$ 55,735,000
|
$ 170,851,000
|
$ 164,413,000
|
$ 71,176,000
|
| Company Selected Measure Amount |
418,973,000
|
444,538,000
|
651,138,000
|
703,277,000
|
488,318,000
|
| PEO Name |
Balu Balakrishnan
|
|
|
|
|
| Measure:: 1 |
|
|
|
|
|
| Pay vs Performance Disclosure |
|
|
|
|
|
| Name |
Net Revenues
|
|
|
|
|
| Measure:: 2 |
|
|
|
|
|
| Pay vs Performance Disclosure |
|
|
|
|
|
| Name |
Non-GAAP Operating Income
|
|
|
|
|
| Measure:: 3 |
|
|
|
|
|
| Pay vs Performance Disclosure |
|
|
|
|
|
| Name |
Relative Revenue (1)
|
|
|
|
|
| PEO | Exclusion of Stock Awards |
|
|
|
|
|
| Pay vs Performance Disclosure |
|
|
|
|
|
| Adjustment to Compensation, Amount |
$ (7,856,013)
|
|
|
|
|
| PEO | Fair Value of Unvested Current Year Awards at FYE |
|
|
|
|
|
| Pay vs Performance Disclosure |
|
|
|
|
|
| Adjustment to Compensation, Amount |
10,012,408
|
|
|
|
|
| PEO | Change in Value of Prior Year Awards Vesting During the Year |
|
|
|
|
|
| Pay vs Performance Disclosure |
|
|
|
|
|
| Adjustment to Compensation, Amount |
(418,538)
|
|
|
|
|
| PEO | Change in Value of Unvested Equity from Prior Years |
|
|
|
|
|
| Pay vs Performance Disclosure |
|
|
|
|
|
| Adjustment to Compensation, Amount |
(1,501,156)
|
|
|
|
|
| Non-PEO NEO | Exclusion of Stock Awards |
|
|
|
|
|
| Pay vs Performance Disclosure |
|
|
|
|
|
| Adjustment to Compensation, Amount |
(1,951,206)
|
|
|
|
|
| Non-PEO NEO | Fair Value of Unvested Current Year Awards at FYE |
|
|
|
|
|
| Pay vs Performance Disclosure |
|
|
|
|
|
| Adjustment to Compensation, Amount |
2,083,334
|
|
|
|
|
| Non-PEO NEO | Change in Value of Prior Year Awards Vesting During the Year |
|
|
|
|
|
| Pay vs Performance Disclosure |
|
|
|
|
|
| Adjustment to Compensation, Amount |
(104,137)
|
|
|
|
|
| Non-PEO NEO | Change in Value of Unvested Equity from Prior Years |
|
|
|
|
|
| Pay vs Performance Disclosure |
|
|
|
|
|
| Adjustment to Compensation, Amount |
$ (448,255)
|
|
|
|
|
