| 28 © CTO Realty Growth, Inc. | ctoreit.com
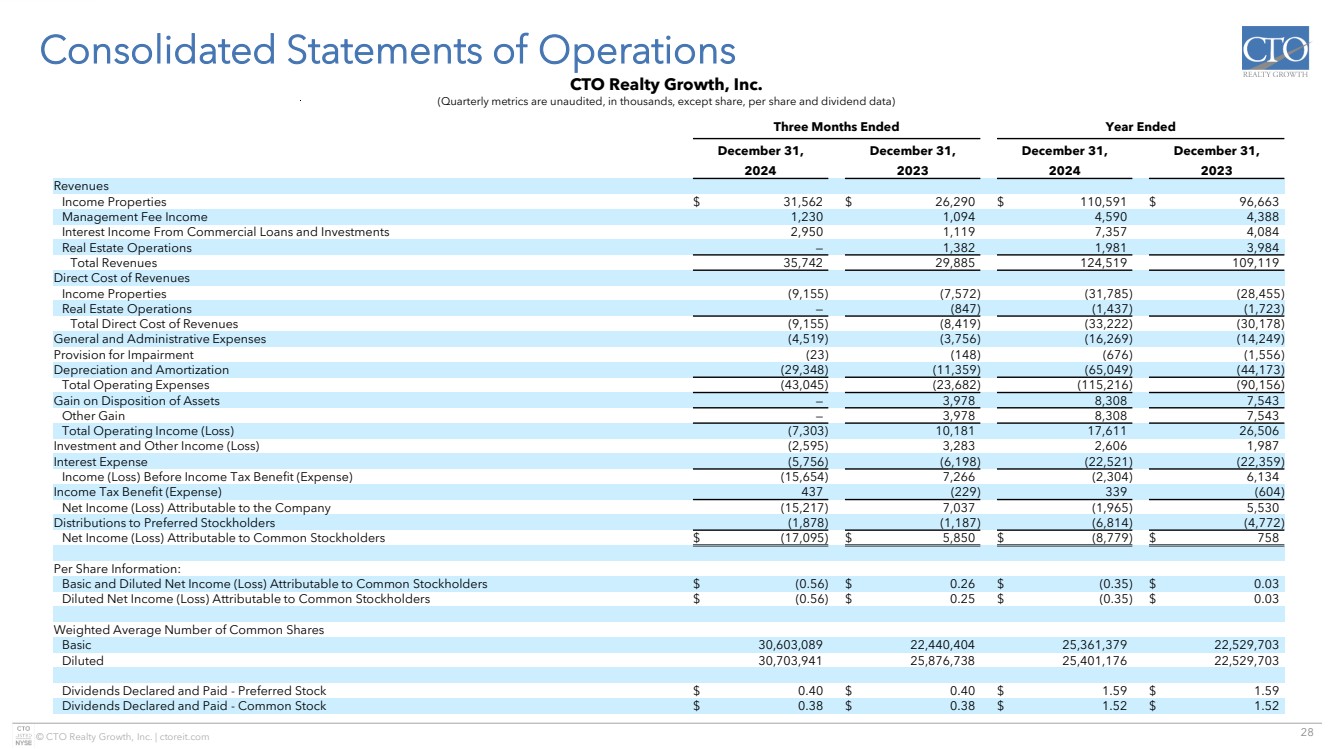
Consolidated Statements of Operations
CTO Realty Growth, Inc.
(Quarterly metrics are unaudited, in thousands, except share, per share and dividend data)
Three Months Ended Year Ended
December 31, December 31, December 31, December 31,
2024 2023 2024 2023
Revenues
Income Properties $ 31,562 $ 26,290 $ 110,591 $ 96,663
Management Fee Income 1,230 1,094 4,590 4,388
Interest Income From Commercial Loans and Investments 2,950 1,119 7,357 4,084
Real Estate Operations — 1,382 1,981 3,984
Total Revenues 35,742 29,885 124,519 109,119
Direct Cost of Revenues
Income Properties (9,155) (7,572) (31,785) (28,455)
Real Estate Operations — (847) (1,437) (1,723)
Total Direct Cost of Revenues (9,155) (8,419) (33,222) (30,178)
General and Administrative Expenses (4,519) (3,756) (16,269) (14,249)
Provision for Impairment (23) (148) (676) (1,556)
Depreciation and Amortization (29,348) (11,359) (65,049) (44,173)
Total Operating Expenses (43,045) (23,682) (115,216) (90,156)
Gain on Disposition of Assets — 3,978 8,308 7,543
Other Gain — 3,978 8,308 7,543
Total Operating Income (Loss) (7,303) 10,181 17,611 26,506
Investment and Other Income (Loss) (2,595) 3,283 2,606 1,987
Interest Expense (5,756) (6,198) (22,521) (22,359)
Income (Loss) Before Income Tax Benefit (Expense) (15,654) 7,266 (2,304) 6,134
Income Tax Benefit (Expense) 437 (229) 339 (604)
Net Income (Loss) Attributable to the Company (15,217) 7,037 (1,965) 5,530
Distributions to Preferred Stockholders (1,878) (1,187) (6,814) (4,772)
Net Income (Loss) Attributable to Common Stockholders $ (17,095) $ 5,850 $ (8,779) $ 758
Per Share Information:
Basic and Diluted Net Income (Loss) Attributable to Common Stockholders $ (0.56) $ 0.26 $ (0.35) $ 0.03
Diluted Net Income (Loss) Attributable to Common Stockholders $ (0.56) $ 0.25 $ (0.35) $ 0.03
Weighted Average Number of Common Shares
Basic 30,603,089 22,440,404 25,361,379 22,529,703
Diluted 30,703,941 25,876,738 25,401,176 22,529,703
Dividends Declared and Paid - Preferred Stock $ 0.40 $ 0.40 $ 1.59 $ 1.59
Dividends Declared and Paid - Common Stock $ 0.38 $ 0.38 $ 1.52 $ 1.52 |
