Pay vs Performance Disclosure - USD ($)
|
5 Months Ended |
7 Months Ended |
12 Months Ended |
Dec. 31, 2023 |
Aug. 14, 2023 |
Dec. 31, 2024 |
Dec. 31, 2023 |
Dec. 31, 2022 |
Dec. 31, 2021 |
Dec. 31, 2020 |
| Pay vs Performance Disclosure |
|
|
|
|
|
|
|
| Pay vs Performance Disclosure, Table |
|
|
Pay versus Performance Disclosure The following table provides a summary of compensation actually paid, as defined by the SEC (CAP), to the principal executive officer (PEO), the average CAP for the other non-PEO named executive officers (Other NEOs), total shareholder return (TSR), net income and the Company-selected financial measure (CSM) of operating income for 2024, 2023, 2022, 2021 and 2020. | | | | | | | | | | | | | | | | | | | | | | | | | | | | 2024 | | | $17,644,763 | | | $12,782,098 | | | — | | | — | | | $4,879,690 | | | $3,865,271 | | | $141 | | | $156 | | | $6,747 | | | $9,713 | 2023 | | | 2,017,348 | | | 2,017,348 | | | 15,552,576 | | | 13,105,795 | | | 3,639,648 | | | 3,680,741 | | | 148 | | | 154 | | | 6,379 | | | 9,082 | 2022 | | | — | | | — | | | 14,326,072 | | | 5,546,491 | | | 2,690,886 | | | 2,533,173 | | | 122 | | | 128 | | | 6,998 | | | 9,917 | 2021 | | | — | | | — | | | 14,523,819 | | | 23,246,960 | | | 3,188,100 | | | 4,326,065 | | | 145 | | | 155 | | | 6,523 | | | 9,338 | 2020 | | | — | | | — | | | 16,632,099 | | | 14,075,218 | | | 4,297,722 | | | 5,491,165 | | | 118 | | | 117 | | | 5,349 | | | 7,834 | | | | | | | | | | | | | | | | | | | | | | | | | | | | | | | |
(a)
| Mr. Fritz, in his capacity as Chief Executive Officer, served as our principal executive officer (PEO) for 2020, 2021, and 2022, and until August 14, 2023, when Mr. Vena became the CEO. The Other NEOs represent the following individuals for each of the years shown: Ms. Hamann, Ms. Whited, Mr. Rocker, and Mr. Gehringer for 2024, 2023, 2022, and 2021; and Mr. Vena (in his capacity as our then Chief Operating Officer), Ms. Hamann, Ms. Whited and Mr. Rocker for 2020. |
(b)
| The peer group index is the Dow Jones Transportation Index, which is included in Item 5 of the Company’s Form 10-K for the year ended December 31, 2024. |
(c)
| Net income and operating income for 2022 reflect a $92 million one-time charge for the labor agreements reached with our labor unions. Net income and operating income for 2020 reflect a $278 million non-cash impairment charge related to our Brazos yard investment. |
(d)
| CAP is defined by the SEC to include not only actual take-home pay for the reported year, but also (i) the year-end value of equity awards granted during the reported year, and (ii) the change in the value of equity awards that were unvested at the end of the prior year, measured through the date such awards vested or were forfeited, or through the end of the reported fiscal year. To calculate CAP, the following amounts were deducted from and added to the applicable executives’ “total compensation” as reported in the Summary Compensation Table (SCT). No adjustments were made to Mr. Vena’s 2023 total compensation for purposes of calculating his 2023 CAP. |
PEO V. James Vena SCT Total to CAP Reconciliation: | | | | | | | | | | | | | | | | | | | 2024 | | | $17,644,763 | | | ($12,000,196) | | | $7,137,531 | | | — | | | — | | | $12,782,098 | 2023 | | | 2,017,348 | | | — | | | — | | | — | | | — | | | 2,017,348 | | | | | | | | | | | | | | | | | | | |
PEO Lance M. Fritz SCT Total to CAP Reconciliation: | | | | | | | | | | | | | | | | | | | 2023 | | | $15,552,576 | | | ($12,000,274) | | | $10,562,712 | | | ($1,500,939) | | | $491,720 | | | $13,105,795 | 2022 | | | 14,326,072 | | | (12,000,163) | | | 2,504,547 | | | — | | | 716,035 | | | 5,546,491 | 2021 | | | 14,523,819 | | | (10,500,166) | | | 18,510,398 | | | (47,311) | | | 760,220 | | | 23,246,960 | 2020 | | | 16,632,099 | | | (10,500,105) | | | 10,583,878 | | | (3,269,470) | | | 628,816 | | | 14,075,218 | | | | | | | | | | | | | | | | | | | |
Average Non-PEO NEOs SCT Total to CAP Reconciliation: | | | | | | | | | | | | | | | | | | | 2024 | | | $4,879,690 | | | ($2,812,707) | | | $1,639,815 | | | ($7,237) | | | $165,710 | | | $3,865,271 | 2023 | | | 3,639,648 | | | (2,025,201) | | | 2,413,150 | | | (682,484) | | | 335,628 | | | 3,680,741 | 2022 | | | 2,690,886 | | | (1,812,770) | | | 594,285 | | | — | | | 1,060,772 | | | 2,533,173 | 2021 | | | 3,188,100 | | | (1,475,163) | | | 2,409,395 | | | (367,668) | | | 571,401 | | | 4,326,065 | 2020 | | | 4,297,722 | | | (2,087,623) | | | 4,094,333 | | | (1,064,470) | | | 251,203 | | | 5,491,165 | | | | | | | | | | | | | | | | | | | |
(i)
| The amounts included in this column are the grant date fair value of equity awards as reported in the “Stock Awards” and “Option Awards” columns in the SCT for each applicable year. |
(ii)
| The equity award adjustments for each applicable year reflect the year-over-year change in the fair value of equity awards as itemized in the tables below |
PEO V. James Vena Equity Award Adjustments Reconciliation: | | | | | | | | | | | | | | | | 2024 | | | $7,137,531 | | | — | | | — | | | — | | | $7,137,531 | 2023 | | | — | | | — | | | — | | | — | | | — | | | | | | | | | | | | | | | | |
PEO Lance M. Fritz Equity Award Adjustments Reconciliation: | | | | | | | | | | | | | | | | | | | 2023 | | | $11,353,821 | | | — | | | $350,903 | | | $3,250,480 | | | ($4,392,492) | | | $10,562,712 | 2022 | | | 8,228,329 | | | — | | | (1,183,911) | | | (4,539,871) | | | — | | | 2,504,547 | 2021 | | | 12,578,359 | | | — | | | (1,151,373) | | | 7,083,412 | | | — | | | 18,510,398 | 2020 | | | 11,615,105 | | | — | | | 4,891 | | | (1,036,118) | | | — | | | 10,583,878 | | | | | | | | | | | | | | | | | | | |
Average Non-PEO NEOs Equity Award Adjustments Reconciliation: | | | | | | | | | | | | | | | | 2024 | | | $1,672,955 | | | — | | | $12,414 | | | ($45,554) | | | $1,639,815 | 2023 | | | 1,916,131 | | | — | | | 44,065 | | | 452,954 | | | 2,413,150 | 2022 | | | 1,242,989 | | | — | | | (116,387) | | | (532,317) | | | 594,285 | 2021 | | | 1,767,115 | | | — | | | (83,871) | | | 726,151 | | | 2,409,395 | 2020 | | | 2,576,000 | | | 1,372,918 | | | (1,750) | | | 147,165 | | | 4,094,333 | | | | | | | | | | | | | | | | |
(iii)
| The amounts included in this column are the change in the present actuarial value of the executives’ accumulated benefit under the Company’s pension plan as reported in “Change in Pension and Nonqualified Deferred Compensation Earnings” column of the SCT for each applicable year. |
(iv)
| The total pension benefit adjustments for each applicable year include the actuarially determined service cost for services rendered during the applicable year (the “service cost”). |
|
|
|
|
|
| Company Selected Measure Name |
|
|
operating income
|
|
|
|
|
| Named Executive Officers, Footnote |
|
|
(a)
| Mr. Fritz, in his capacity as Chief Executive Officer, served as our principal executive officer (PEO) for 2020, 2021, and 2022, and until August 14, 2023, when Mr. Vena became the CEO. The Other NEOs represent the following individuals for each of the years shown: Ms. Hamann, Ms. Whited, Mr. Rocker, and Mr. Gehringer for 2024, 2023, 2022, and 2021; and Mr. Vena (in his capacity as our then Chief Operating Officer), Ms. Hamann, Ms. Whited and Mr. Rocker for 2020. |
|
|
|
|
|
| Peer Group Issuers, Footnote |
|
|
(b)
| The peer group index is the Dow Jones Transportation Index, which is included in Item 5 of the Company’s Form 10-K for the year ended December 31, 2024. |
|
|
|
|
|
| Adjustment To PEO Compensation, Footnote |
|
|
(d)
| CAP is defined by the SEC to include not only actual take-home pay for the reported year, but also (i) the year-end value of equity awards granted during the reported year, and (ii) the change in the value of equity awards that were unvested at the end of the prior year, measured through the date such awards vested or were forfeited, or through the end of the reported fiscal year. To calculate CAP, the following amounts were deducted from and added to the applicable executives’ “total compensation” as reported in the Summary Compensation Table (SCT). No adjustments were made to Mr. Vena’s 2023 total compensation for purposes of calculating his 2023 CAP. |
PEO V. James Vena SCT Total to CAP Reconciliation: | | | | | | | | | | | | | | | | | | | 2024 | | | $17,644,763 | | | ($12,000,196) | | | $7,137,531 | | | — | | | — | | | $12,782,098 | 2023 | | | 2,017,348 | | | — | | | — | | | — | | | — | | | 2,017,348 | | | | | | | | | | | | | | | | | | | |
PEO Lance M. Fritz SCT Total to CAP Reconciliation: | | | | | | | | | | | | | | | | | | | 2023 | | | $15,552,576 | | | ($12,000,274) | | | $10,562,712 | | | ($1,500,939) | | | $491,720 | | | $13,105,795 | 2022 | | | 14,326,072 | | | (12,000,163) | | | 2,504,547 | | | — | | | 716,035 | | | 5,546,491 | 2021 | | | 14,523,819 | | | (10,500,166) | | | 18,510,398 | | | (47,311) | | | 760,220 | | | 23,246,960 | 2020 | | | 16,632,099 | | | (10,500,105) | | | 10,583,878 | | | (3,269,470) | | | 628,816 | | | 14,075,218 | | | | | | | | | | | | | | | | | | | |
(i)
| The amounts included in this column are the grant date fair value of equity awards as reported in the “Stock Awards” and “Option Awards” columns in the SCT for each applicable year. |
(ii)
| The equity award adjustments for each applicable year reflect the year-over-year change in the fair value of equity awards as itemized in the tables below |
PEO V. James Vena Equity Award Adjustments Reconciliation: | | | | | | | | | | | | | | | | 2024 | | | $7,137,531 | | | — | | | — | | | — | | | $7,137,531 | 2023 | | | — | | | — | | | — | | | — | | | — | | | | | | | | | | | | | | | | |
PEO Lance M. Fritz Equity Award Adjustments Reconciliation: | | | | | | | | | | | | | | | | | | | 2023 | | | $11,353,821 | | | — | | | $350,903 | | | $3,250,480 | | | ($4,392,492) | | | $10,562,712 | 2022 | | | 8,228,329 | | | — | | | (1,183,911) | | | (4,539,871) | | | — | | | 2,504,547 | 2021 | | | 12,578,359 | | | — | | | (1,151,373) | | | 7,083,412 | | | — | | | 18,510,398 | 2020 | | | 11,615,105 | | | — | | | 4,891 | | | (1,036,118) | | | — | | | 10,583,878 | | | | | | | | | | | | | | | | | | | |
(iii)
| The amounts included in this column are the change in the present actuarial value of the executives’ accumulated benefit under the Company’s pension plan as reported in “Change in Pension and Nonqualified Deferred Compensation Earnings” column of the SCT for each applicable year. |
(iv)
| The total pension benefit adjustments for each applicable year include the actuarially determined service cost for services rendered during the applicable year (the “service cost”). |
|
|
|
|
|
| Non-PEO NEO Average Total Compensation Amount |
|
|
$ 4,879,690
|
$ 3,639,648
|
$ 2,690,886
|
$ 3,188,100
|
$ 4,297,722
|
| Non-PEO NEO Average Compensation Actually Paid Amount |
|
|
$ 3,865,271
|
3,680,741
|
2,533,173
|
4,326,065
|
5,491,165
|
| Adjustment to Non-PEO NEO Compensation Footnote |
|
|
(d)
| CAP is defined by the SEC to include not only actual take-home pay for the reported year, but also (i) the year-end value of equity awards granted during the reported year, and (ii) the change in the value of equity awards that were unvested at the end of the prior year, measured through the date such awards vested or were forfeited, or through the end of the reported fiscal year. To calculate CAP, the following amounts were deducted from and added to the applicable executives’ “total compensation” as reported in the Summary Compensation Table (SCT). No adjustments were made to Mr. Vena’s 2023 total compensation for purposes of calculating his 2023 CAP. |
Average Non-PEO NEOs SCT Total to CAP Reconciliation: | | | | | | | | | | | | | | | | | | | 2024 | | | $4,879,690 | | | ($2,812,707) | | | $1,639,815 | | | ($7,237) | | | $165,710 | | | $3,865,271 | 2023 | | | 3,639,648 | | | (2,025,201) | | | 2,413,150 | | | (682,484) | | | 335,628 | | | 3,680,741 | 2022 | | | 2,690,886 | | | (1,812,770) | | | 594,285 | | | — | | | 1,060,772 | | | 2,533,173 | 2021 | | | 3,188,100 | | | (1,475,163) | | | 2,409,395 | | | (367,668) | | | 571,401 | | | 4,326,065 | 2020 | | | 4,297,722 | | | (2,087,623) | | | 4,094,333 | | | (1,064,470) | | | 251,203 | | | 5,491,165 | | | | | | | | | | | | | | | | | | | |
(i)
| The amounts included in this column are the grant date fair value of equity awards as reported in the “Stock Awards” and “Option Awards” columns in the SCT for each applicable year. |
(ii)
| The equity award adjustments for each applicable year reflect the year-over-year change in the fair value of equity awards as itemized in the tables below |
Average Non-PEO NEOs Equity Award Adjustments Reconciliation: | | | | | | | | | | | | | | | | 2024 | | | $1,672,955 | | | — | | | $12,414 | | | ($45,554) | | | $1,639,815 | 2023 | | | 1,916,131 | | | — | | | 44,065 | | | 452,954 | | | 2,413,150 | 2022 | | | 1,242,989 | | | — | | | (116,387) | | | (532,317) | | | 594,285 | 2021 | | | 1,767,115 | | | — | | | (83,871) | | | 726,151 | | | 2,409,395 | 2020 | | | 2,576,000 | | | 1,372,918 | | | (1,750) | | | 147,165 | | | 4,094,333 | | | | | | | | | | | | | | | | |
(iii)
| The amounts included in this column are the change in the present actuarial value of the executives’ accumulated benefit under the Company’s pension plan as reported in “Change in Pension and Nonqualified Deferred Compensation Earnings” column of the SCT for each applicable year. |
(iv)
| The total pension benefit adjustments for each applicable year include the actuarially determined service cost for services rendered during the applicable year (the “service cost”). |
|
|
|
|
|
| Compensation Actually Paid vs. Total Shareholder Return |
|
|
CAP versus TSR As shown in the chart below, the PEO’s CAP and Other NEOs’ Average CAP amounts are directionally aligned with the Company’s TSR. This is due primarily to the Company’s use of equity incentives, the value of which moves in line with our TSR, in addition to the Company’s financial performance. The Other NEOs’ Average CAP in 2020 also reflects the compensation of a more senior executive who ceased to serve as one of the Other NEOs in 2021. The Other NEO’s Average CAP increased in 2023 and 2024 due primarily to changes in the Company’s stock price and the election of Ms. Whited as the Company’s President. The PEO’s CAP in 2024 reflects Mr. Vena’s first full year of service as the CEO. 
|
|
|
|
|
| Compensation Actually Paid vs. Net Income |
|
|
CAP versus Net Income The Company’s net income increased in 2021, 2022 and 2024, and decreased in 2023, while the PEO and Other NEOs’ CAP has varied significantly each year. This is due in large part to the significant emphasis the Company places on equity incentives, the value of which are affected by our TSR. In addition, the Company does not use net income to determine compensation levels or incentive plan payouts.
|
|
|
|
|
| Compensation Actually Paid vs. Company Selected Measure |
|
|
CAP versus Operating Income – Company-Selected Measure (CSM) 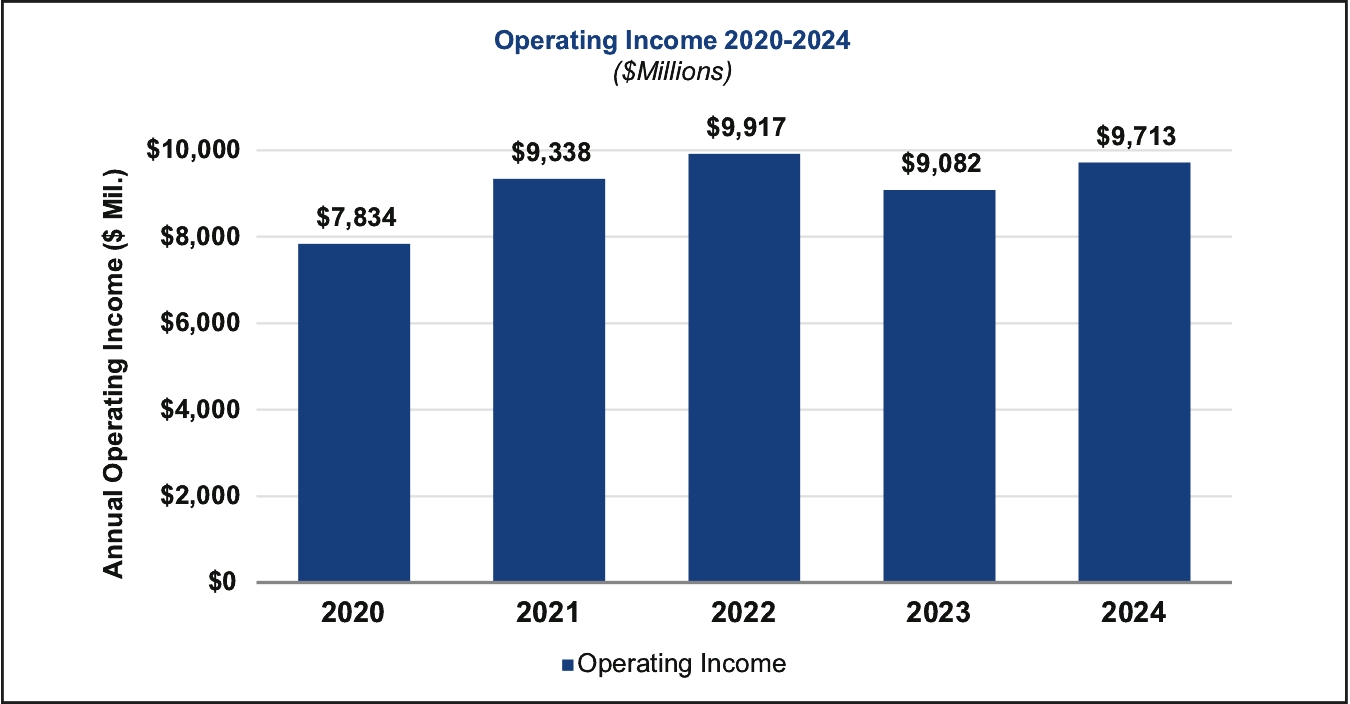 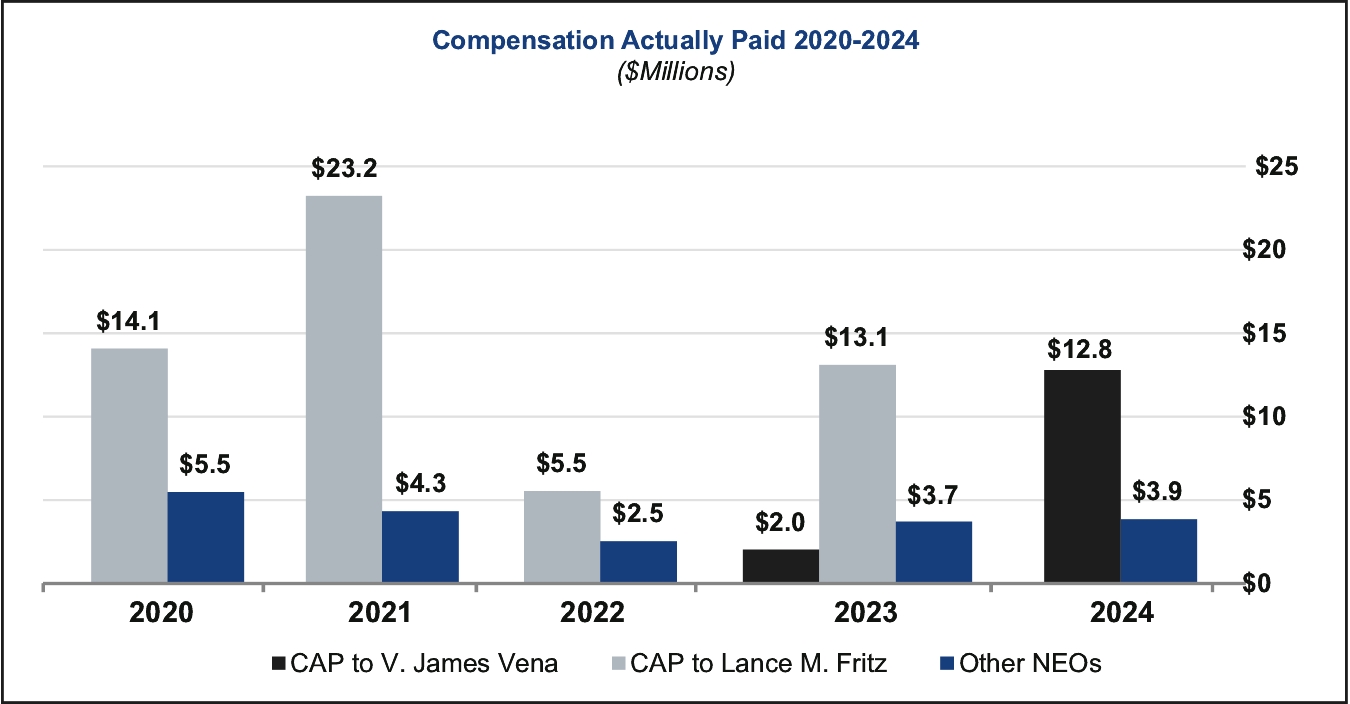 Operating income and operating ratio (of which operating income is a component) are equally weighted financial measures used in our annual incentive plan, as described in our CD&A. In addition, performance stock units awarded to our NEOs are earned based one-third (1/3) on operating income growth (OIG). The Company’s operating income has steadily increased year-over-year, except for 2023, although its impact on the PEO’s and Other NEO’s CAP has been muted or offset by other performance measures and by changes in the Company’s stock price.
|
|
|
|
|
| Total Shareholder Return Vs Peer Group |
|
|
TSR: Company versus Peer Group The following chart presents the cumulative total shareholder return, assuming reinvestment of dividends, over the 5-year period for the Company (UNP) and the Dow Jones Transportation Index (DJ Trans). As the table demonstrates, the Company’s 5-year cumulative TSR is generally aligned with our peer group index. 
|
|
|
|
|
| Tabular List, Table |
|
|
Most Important Measures to Determine 2024 CAP Below lists the most important financial metrics used to link 2024 CAP to Company performance. Operating income, operating ratio and return on invested capital are further described in our CD&A within the sections titled “2024 Annual Incentive Plan” and “Long-Term Equity Incentive Compensation.” • | Return on Invested Capital |
|
|
|
|
|
| Total Shareholder Return Amount |
|
|
$ 141
|
148
|
122
|
145
|
118
|
| Peer Group Total Shareholder Return Amount |
|
|
156
|
154
|
128
|
155
|
117
|
| Net Income (Loss) |
|
|
$ 6,747,000,000
|
$ 6,379,000,000
|
$ 6,998,000,000
|
$ 6,523,000,000
|
$ 5,349,000,000
|
| Company Selected Measure Amount |
|
|
9,713,000,000
|
9,082,000,000
|
9,917,000,000
|
9,338,000,000
|
7,834,000,000
|
| PEO Name |
Mr. Vena
|
Mr. Fritz
|
Mr. Vena
|
|
Mr. Fritz
|
Mr. Fritz
|
Mr. Fritz
|
| Equity Awards Adjustments, Footnote |
|
|
(ii)
| The equity award adjustments for each applicable year reflect the year-over-year change in the fair value of equity awards as itemized in the tables below |
PEO V. James Vena Equity Award Adjustments Reconciliation: | | | | | | | | | | | | | | | | 2024 | | | $7,137,531 | | | — | | | — | | | — | | | $7,137,531 | 2023 | | | — | | | — | | | — | | | — | | | — | | | | | | | | | | | | | | | | |
PEO Lance M. Fritz Equity Award Adjustments Reconciliation: | | | | | | | | | | | | | | | | | | | 2023 | | | $11,353,821 | | | — | | | $350,903 | | | $3,250,480 | | | ($4,392,492) | | | $10,562,712 | 2022 | | | 8,228,329 | | | — | | | (1,183,911) | | | (4,539,871) | | | — | | | 2,504,547 | 2021 | | | 12,578,359 | | | — | | | (1,151,373) | | | 7,083,412 | | | — | | | 18,510,398 | 2020 | | | 11,615,105 | | | — | | | 4,891 | | | (1,036,118) | | | — | | | 10,583,878 | | | | | | | | | | | | | | | | | | | |
Average Non-PEO NEOs Equity Award Adjustments Reconciliation: | | | | | | | | | | | | | | | | 2024 | | | $1,672,955 | | | — | | | $12,414 | | | ($45,554) | | | $1,639,815 | 2023 | | | 1,916,131 | | | — | | | 44,065 | | | 452,954 | | | 2,413,150 | 2022 | | | 1,242,989 | | | — | | | (116,387) | | | (532,317) | | | 594,285 | 2021 | | | 1,767,115 | | | — | | | (83,871) | | | 726,151 | | | 2,409,395 | 2020 | | | 2,576,000 | | | 1,372,918 | | | (1,750) | | | 147,165 | | | 4,094,333 | | | | | | | | | | | | | | | | |
|
|
|
|
|
| Charges for labor agreements |
|
|
|
|
$ 92,000,000
|
|
|
| Asset Impairment Charges |
|
|
|
|
|
|
$ 278,000,000
|
| Measure:: 1 |
|
|
|
|
|
|
|
| Pay vs Performance Disclosure |
|
|
|
|
|
|
|
| Name |
|
|
Operating Income
|
|
|
|
|
| Measure:: 2 |
|
|
|
|
|
|
|
| Pay vs Performance Disclosure |
|
|
|
|
|
|
|
| Name |
|
|
Operating Ratio
|
|
|
|
|
| Measure:: 3 |
|
|
|
|
|
|
|
| Pay vs Performance Disclosure |
|
|
|
|
|
|
|
| Name |
|
|
Return on Invested Capital
|
|
|
|
|
| V. James Vena [Member] |
|
|
|
|
|
|
|
| Pay vs Performance Disclosure |
|
|
|
|
|
|
|
| PEO Total Compensation Amount |
|
|
$ 17,644,763
|
$ 2,017,348
|
0
|
$ 0
|
0
|
| PEO Actually Paid Compensation Amount |
|
|
12,782,098
|
2,017,348
|
0
|
0
|
0
|
| Lance M. Fritz [Member] |
|
|
|
|
|
|
|
| Pay vs Performance Disclosure |
|
|
|
|
|
|
|
| PEO Total Compensation Amount |
|
|
0
|
15,552,576
|
14,326,072
|
14,523,819
|
16,632,099
|
| PEO Actually Paid Compensation Amount |
|
|
0
|
13,105,795
|
5,546,491
|
23,246,960
|
14,075,218
|
| PEO | V. James Vena [Member] | Aggregate Change in Present Value of Accumulated Benefit for All Pension Plans Reported in Summary Compensation Table |
|
|
|
|
|
|
|
| Pay vs Performance Disclosure |
|
|
|
|
|
|
|
| Adjustment to Compensation, Amount |
|
|
0
|
0
|
|
|
|
| PEO | V. James Vena [Member] | Aggregate Pension Adjustments Service Cost |
|
|
|
|
|
|
|
| Pay vs Performance Disclosure |
|
|
|
|
|
|
|
| Adjustment to Compensation, Amount |
|
|
0
|
0
|
|
|
|
| PEO | V. James Vena [Member] | Aggregate Grant Date Fair Value of Equity Award Amounts Reported in Summary Compensation Table |
|
|
|
|
|
|
|
| Pay vs Performance Disclosure |
|
|
|
|
|
|
|
| Adjustment to Compensation, Amount |
|
|
(12,000,196)
|
0
|
|
|
|
| PEO | V. James Vena [Member] | Equity Awards Adjustments, Excluding Value Reported in Compensation Table |
|
|
|
|
|
|
|
| Pay vs Performance Disclosure |
|
|
|
|
|
|
|
| Adjustment to Compensation, Amount |
|
|
7,137,531
|
0
|
|
|
|
| PEO | V. James Vena [Member] | Year-end Fair Value of Equity Awards Granted in Covered Year that are Outstanding and Unvested |
|
|
|
|
|
|
|
| Pay vs Performance Disclosure |
|
|
|
|
|
|
|
| Adjustment to Compensation, Amount |
|
|
7,137,531
|
0
|
|
|
|
| PEO | V. James Vena [Member] | Year-over-Year Change in Fair Value of Equity Awards Granted in Prior Years That are Outstanding and Unvested |
|
|
|
|
|
|
|
| Pay vs Performance Disclosure |
|
|
|
|
|
|
|
| Adjustment to Compensation, Amount |
|
|
0
|
0
|
|
|
|
| PEO | V. James Vena [Member] | Vesting Date Fair Value of Equity Awards Granted and Vested in Covered Year |
|
|
|
|
|
|
|
| Pay vs Performance Disclosure |
|
|
|
|
|
|
|
| Adjustment to Compensation, Amount |
|
|
0
|
0
|
|
|
|
| PEO | V. James Vena [Member] | Change in Fair Value as of Vesting Date of Prior Year Equity Awards Vested in Covered Year |
|
|
|
|
|
|
|
| Pay vs Performance Disclosure |
|
|
|
|
|
|
|
| Adjustment to Compensation, Amount |
|
|
0
|
0
|
|
|
|
| PEO | Lance M. Fritz [Member] | Aggregate Change in Present Value of Accumulated Benefit for All Pension Plans Reported in Summary Compensation Table |
|
|
|
|
|
|
|
| Pay vs Performance Disclosure |
|
|
|
|
|
|
|
| Adjustment to Compensation, Amount |
|
|
|
(1,500,939)
|
0
|
(47,311)
|
(3,269,470)
|
| PEO | Lance M. Fritz [Member] | Aggregate Pension Adjustments Service Cost |
|
|
|
|
|
|
|
| Pay vs Performance Disclosure |
|
|
|
|
|
|
|
| Adjustment to Compensation, Amount |
|
|
|
491,720
|
716,035
|
760,220
|
628,816
|
| PEO | Lance M. Fritz [Member] | Aggregate Grant Date Fair Value of Equity Award Amounts Reported in Summary Compensation Table |
|
|
|
|
|
|
|
| Pay vs Performance Disclosure |
|
|
|
|
|
|
|
| Adjustment to Compensation, Amount |
|
|
|
(12,000,274)
|
(12,000,163)
|
(10,500,166)
|
(10,500,105)
|
| PEO | Lance M. Fritz [Member] | Equity Awards Adjustments, Excluding Value Reported in Compensation Table |
|
|
|
|
|
|
|
| Pay vs Performance Disclosure |
|
|
|
|
|
|
|
| Adjustment to Compensation, Amount |
|
|
|
10,562,712
|
2,504,547
|
18,510,398
|
10,583,878
|
| PEO | Lance M. Fritz [Member] | Year-end Fair Value of Equity Awards Granted in Covered Year that are Outstanding and Unvested |
|
|
|
|
|
|
|
| Pay vs Performance Disclosure |
|
|
|
|
|
|
|
| Adjustment to Compensation, Amount |
|
|
|
11,353,821
|
8,228,329
|
12,578,359
|
11,615,105
|
| PEO | Lance M. Fritz [Member] | Year-over-Year Change in Fair Value of Equity Awards Granted in Prior Years That are Outstanding and Unvested |
|
|
|
|
|
|
|
| Pay vs Performance Disclosure |
|
|
|
|
|
|
|
| Adjustment to Compensation, Amount |
|
|
|
3,250,480
|
(4,539,871)
|
7,083,412
|
(1,036,118)
|
| PEO | Lance M. Fritz [Member] | Vesting Date Fair Value of Equity Awards Granted and Vested in Covered Year |
|
|
|
|
|
|
|
| Pay vs Performance Disclosure |
|
|
|
|
|
|
|
| Adjustment to Compensation, Amount |
|
|
|
0
|
0
|
0
|
0
|
| PEO | Lance M. Fritz [Member] | Change in Fair Value as of Vesting Date of Prior Year Equity Awards Vested in Covered Year |
|
|
|
|
|
|
|
| Pay vs Performance Disclosure |
|
|
|
|
|
|
|
| Adjustment to Compensation, Amount |
|
|
|
350,903
|
(1,183,911)
|
(1,151,373)
|
4,891
|
| PEO | Lance M. Fritz [Member] | Prior Year End Fair Value of Equity Awards Granted in Any Prior Year that Fail to Meet Applicable Vesting Conditions During Covered Year |
|
|
|
|
|
|
|
| Pay vs Performance Disclosure |
|
|
|
|
|
|
|
| Adjustment to Compensation, Amount |
|
|
|
(4,392,492)
|
0
|
0
|
0
|
| Non-PEO NEO | Aggregate Change in Present Value of Accumulated Benefit for All Pension Plans Reported in Summary Compensation Table |
|
|
|
|
|
|
|
| Pay vs Performance Disclosure |
|
|
|
|
|
|
|
| Adjustment to Compensation, Amount |
|
|
(7,237)
|
(682,484)
|
0
|
(367,668)
|
(1,064,470)
|
| Non-PEO NEO | Aggregate Pension Adjustments Service Cost |
|
|
|
|
|
|
|
| Pay vs Performance Disclosure |
|
|
|
|
|
|
|
| Adjustment to Compensation, Amount |
|
|
165,710
|
335,628
|
1,060,772
|
571,401
|
251,203
|
| Non-PEO NEO | Aggregate Grant Date Fair Value of Equity Award Amounts Reported in Summary Compensation Table |
|
|
|
|
|
|
|
| Pay vs Performance Disclosure |
|
|
|
|
|
|
|
| Adjustment to Compensation, Amount |
|
|
(2,812,707)
|
(2,025,201)
|
(1,812,770)
|
(1,475,163)
|
(2,087,623)
|
| Non-PEO NEO | Equity Awards Adjustments, Excluding Value Reported in Compensation Table |
|
|
|
|
|
|
|
| Pay vs Performance Disclosure |
|
|
|
|
|
|
|
| Adjustment to Compensation, Amount |
|
|
1,639,815
|
2,413,150
|
594,285
|
2,409,395
|
4,094,333
|
| Non-PEO NEO | Year-end Fair Value of Equity Awards Granted in Covered Year that are Outstanding and Unvested |
|
|
|
|
|
|
|
| Pay vs Performance Disclosure |
|
|
|
|
|
|
|
| Adjustment to Compensation, Amount |
|
|
1,672,955
|
1,916,131
|
1,242,989
|
1,767,115
|
2,576,000
|
| Non-PEO NEO | Year-over-Year Change in Fair Value of Equity Awards Granted in Prior Years That are Outstanding and Unvested |
|
|
|
|
|
|
|
| Pay vs Performance Disclosure |
|
|
|
|
|
|
|
| Adjustment to Compensation, Amount |
|
|
(45,554)
|
452,954
|
(532,317)
|
726,151
|
147,165
|
| Non-PEO NEO | Vesting Date Fair Value of Equity Awards Granted and Vested in Covered Year |
|
|
|
|
|
|
|
| Pay vs Performance Disclosure |
|
|
|
|
|
|
|
| Adjustment to Compensation, Amount |
|
|
0
|
0
|
0
|
0
|
1,372,918
|
| Non-PEO NEO | Change in Fair Value as of Vesting Date of Prior Year Equity Awards Vested in Covered Year |
|
|
|
|
|
|
|
| Pay vs Performance Disclosure |
|
|
|
|
|
|
|
| Adjustment to Compensation, Amount |
|
|
$ 12,414
|
$ 44,065
|
$ (116,387)
|
$ (83,871)
|
$ (1,750)
|
