0000843006false--12-31Q22024One Glenwood Drive0.001100000000000.0012000000038152123831711722501980002100000008430062024-01-012024-06-3000008430062024-06-0100008430062023-03-012023-03-200000843006us-gaap:OtherCustomerMember2023-01-012023-06-300000843006us-gaap:OtherCustomerMember2024-01-012024-06-300000843006isdr:ComplianceMember2024-01-012024-06-300000843006isdr:CommunicationMember2024-01-012024-06-300000843006isdr:ComplianceMember2023-04-012023-06-300000843006isdr:ComplianceMember2024-04-012024-06-300000843006isdr:ComplianceMember2023-01-012023-06-300000843006isdr:CommunicationMember2023-04-012023-06-300000843006isdr:CommunicationMember2024-04-012024-06-300000843006isdr:CommunicationMember2023-01-012023-06-300000843006isdr:MarchTwentyNineteenMember2024-06-300000843006isdr:MarchTwentyNineteenMember2024-01-012024-06-300000843006isdr:UnvestedRestrictedStockMember2024-06-300000843006isdr:TwentyFourteenPlanMember2020-06-012020-06-170000843006isdr:TwentyFourteenPlanMember2016-06-012016-06-100000843006isdr:TwentyTwentyThreePlanMember2024-01-012024-06-300000843006isdr:TwentyFourteenPlanMember2024-01-012024-06-300000843006isdr:TwentyTwentyThreePlanMember2024-06-300000843006isdr:TwentyFourteenPlanMember2024-06-300000843006isdr:StockOptionTotalMember2024-01-012024-06-300000843006isdr:StockOptionFiveMember2024-01-012024-06-300000843006isdr:StockOptionFourMember2024-01-012024-06-300000843006isdr:StockOptionThreeMember2024-01-012024-06-300000843006isdr:StockOptionTwoMember2024-01-012024-06-300000843006isdr:StockOptionOneMember2024-01-012024-06-300000843006isdr:StockOptionTotalMember2024-03-310000843006isdr:StockOptionFiveMember2024-03-310000843006isdr:StockOptionFourMember2024-03-310000843006isdr:StockOptionThreeMember2024-03-310000843006isdr:StockOptionTwoMember2024-03-310000843006isdr:StockOptionOneMember2024-03-310000843006us-gaap:CanadaRevenueAgencyMember2024-06-300000843006srt:EuropeMember2024-06-300000843006srt:MaximumMemberus-gaap:TechnologyBasedIntangibleAssetsMember2024-01-012024-06-300000843006srt:MinimumMemberus-gaap:TechnologyBasedIntangibleAssetsMember2024-01-012024-06-300000843006us-gaap:NoncompeteAgreementsMember2024-01-012024-06-300000843006isdr:DistributionPartnerRelationshipsMember2024-01-012024-06-300000843006us-gaap:CustomerListsMember2024-01-012024-06-300000843006srt:MaximumMemberus-gaap:CustomerRelationshipsMember2024-01-012024-06-300000843006us-gaap:CommonStockMember2024-01-012024-06-300000843006us-gaap:RetainedEarningsMember2024-06-300000843006us-gaap:AccumulatedOtherComprehensiveIncomeMember2024-06-300000843006us-gaap:AdditionalPaidInCapitalMember2024-06-300000843006us-gaap:CommonStockMember2024-06-300000843006us-gaap:RetainedEarningsMember2024-04-012024-06-300000843006us-gaap:AccumulatedOtherComprehensiveIncomeMember2024-04-012024-06-300000843006us-gaap:AdditionalPaidInCapitalMember2024-04-012024-06-300000843006us-gaap:CommonStockMember2024-04-012024-06-3000008430062024-03-310000843006us-gaap:RetainedEarningsMember2024-03-310000843006us-gaap:AccumulatedOtherComprehensiveIncomeMember2024-03-310000843006us-gaap:AdditionalPaidInCapitalMember2024-03-310000843006us-gaap:CommonStockMember2024-03-3100008430062024-01-012024-03-310000843006us-gaap:RetainedEarningsMember2024-01-012024-03-310000843006us-gaap:AccumulatedOtherComprehensiveIncomeMember2024-01-012024-03-310000843006us-gaap:AdditionalPaidInCapitalMember2024-01-012024-03-310000843006us-gaap:CommonStockMember2024-01-012024-03-310000843006us-gaap:RetainedEarningsMember2023-12-310000843006us-gaap:AccumulatedOtherComprehensiveIncomeMember2023-12-310000843006us-gaap:AdditionalPaidInCapitalMember2023-12-310000843006us-gaap:CommonStockMember2023-12-3100008430062023-06-300000843006us-gaap:RetainedEarningsMember2023-06-300000843006us-gaap:AccumulatedOtherComprehensiveIncomeMember2023-06-300000843006us-gaap:AdditionalPaidInCapitalMember2023-06-300000843006us-gaap:CommonStockMember2023-06-300000843006us-gaap:RetainedEarningsMember2023-04-012023-06-300000843006us-gaap:AccumulatedOtherComprehensiveIncomeMember2023-04-012023-06-300000843006us-gaap:AdditionalPaidInCapitalMember2023-04-012023-06-300000843006us-gaap:CommonStockMember2023-04-012023-06-3000008430062023-03-310000843006us-gaap:RetainedEarningsMember2023-03-310000843006us-gaap:AccumulatedOtherComprehensiveIncomeMember2023-03-310000843006us-gaap:AdditionalPaidInCapitalMember2023-03-310000843006us-gaap:CommonStockMember2023-03-3100008430062023-01-012023-03-310000843006us-gaap:RetainedEarningsMember2023-01-012023-03-310000843006us-gaap:AccumulatedOtherComprehensiveIncomeMember2023-01-012023-03-310000843006us-gaap:AdditionalPaidInCapitalMember2023-01-012023-03-310000843006us-gaap:CommonStockMember2023-01-012023-03-3100008430062022-12-310000843006us-gaap:RetainedEarningsMember2022-12-310000843006us-gaap:AccumulatedOtherComprehensiveIncomeMember2022-12-310000843006us-gaap:AdditionalPaidInCapitalMember2022-12-310000843006us-gaap:CommonStockMember2022-12-3100008430062023-01-012023-06-3000008430062023-04-012023-06-3000008430062024-04-012024-06-3000008430062023-12-3100008430062024-06-3000008430062024-08-08iso4217:USDxbrli:sharesiso4217:USDxbrli:sharesxbrli:pure
UNITED STATES
SECURITIES AND EXCHANGE COMMISSION
Washington, D.C. 20549
———————
FORM 10-Q
———————
☒ | QUARTERLY REPORT PURSUANT TO SECTION 13 OR 15(d) OF THE SECURITIES EXCHANGE ACT OF 1934 |
For the quarterly period ended: June 30, 2024
or
☐ | TRANSITION REPORT PURSUANT TO SECTION 13 OR 15(d) OF THE SECURITIES EXCHANGE ACT OF 1934 |
For the transition period from: _____________ to _____________

Issuer Direct Corporation |
(Exact name of registrant as specified in its charter) |
Delaware | | 1-10185 | | 26-1331503 |
(State or Other Jurisdiction of Incorporation) | | (Commission File Number) | | (I.R.S. Employer Identification No.) |
One Glenwood Avenue, Suite 1001, Raleigh NC 27603
(Address of Principal Executive Office) (Zip Code)
(919) 481-4000
(Registrant’s telephone number, including area code)
N/A
(Former name, former address and former fiscal year, if changed since last report)
Securities registered pursuant to Section 12(b) of the Act:
Title of each class | | Trading Symbol(s) | | Name of each exchange on which registered |
Common Stock, par value $0.001 | | ISDR | | NYSE American |
Indicate by check mark whether the registrant (1) has filed all reports required to be filed by Section 13 or 15(d) of the Securities Exchange Act of 1934 during the preceding 12 months (or for such shorter period that the registrant was required to file such reports), and (2) has been subject to such filing requirements for the past 90 days. Yes ☒ No ☐
Indicate by check mark whether the registrant has submitted electronically and posted on its corporate website, if any, every Interactive Data File required to be submitted and posted pursuant to Rule 405 of Regulation S-T during the preceding 12 months (or for such shorter period that the registrant was required to submit and post such files). Yes ☒ No ☐
Indicate by check mark whether the registrant is a large accelerated filer, an accelerated filer, a non-accelerated filer, smaller reporting company, or an emerging growth company. See the definitions of “large accelerated filer,” “accelerated filer”, “smaller reporting company” and "emerging growth company" in Rule 12b-2 of the Exchange Act. (Check one):
Large accelerated filer | ☐ | Accelerated filer | ☐ |
Non-accelerated Filer | ☐ | Smaller reporting company | ☒ |
(Do not check if a smaller reporting company) | | Emerging growth company | ☐ |
If an emerging growth company, indicate by check mark if the registrant has elected not to use the extended transition period for complying with any new or revised financial accounting standards provided pursuant to Section 13(a) of the Exchange Act. ☐
Indicate by check mark whether the registrant is a shell company (as defined in Rule 12b-2 of the Act) Yes ☐ No ☒
Indicate the number of shares outstanding of each of the issuer’s classes of common stock, as of the latest practicable date 3,833,977 shares of common stock were issued and outstanding as of August 8, 2024.
TABLE OF CONTENTS
PART I – FINANCIAL INFORMATION
PART I – FINANCIAL INFORMATION
ITEM 1. FINANCIAL STATEMENTS
ISSUER DIRECT CORPORATION AND SUBSIDIARIES
CONSOLIDATED BALANCE SHEETS
(in thousands, except share and per share amounts)
| | June 30, | | | December 31, | |
| | 2024 | | | 2023 | |
ASSETS | | (unaudited) | | | | |
Current assets: | | | | | | |
Cash and cash equivalents | | $ | 4,020 | | | $ | 5,714 | |
Accounts receivable (net of allowance for doubtful accounts of $1,156 and $1,119, respectively | | | 4,686 | | | | 4,368 | |
Income tax receivable | | | 202 | | | | 232 | |
Other current assets | | | 1,331 | | | | 1,190 | |
Total current assets | | | 10,239 | | | | 11,504 | |
Capitalized software (net of accumulated amortization of $3,524 and $3,424, respectively) | | | 856 | | | | 556 | |
Fixed assets (net of accumulated depreciation of $841 and $765, respectively) | | | 435 | | | | 495 | |
Right-of-use asset – leases | | | 894 | | | | 1,022 | |
Other long-term assets | | | 344 | | | | 158 | |
Goodwill | | | 21,927 | | | | 21,927 | |
Intangible assets (net of accumulated amortization of $10,926 and $9,562, respectively) | | | 28,126 | | | | 29,490 | |
Total assets | | $ | 62,821 | | | $ | 65,152 | |
| | | | | | | | |
LIABILITIES AND STOCKHOLDERS’ EQUITY | | | | | | | | |
Current liabilities: | | | | | | | | |
Accounts payable | | $ | 1,077 | | | $ | 1,308 | |
Accrued expenses | | | 1,983 | | | | 1,919 | |
Income taxes payable | | | 23 | | | | 11 | |
Current portion of long-term debt | | | 4,000 | | | | 4,000 | |
Deferred revenue | | | 5,476 | | | | 5,412 | |
Total current liabilities | | | 12,559 | | | | 12,650 | |
Long-term debt (net of debt discount of $78 and $87, respectively) | | | 13,922 | | | | 15,913 | |
Deferred income tax liability | | | 59 | | | | 139 | |
Lease liabilities – long-term | | | 840 | | | | 1,009 | |
Other long-term liabilities | | | — | | | | 21 | |
Total liabilities | | | 27,380 | | | | 29,732 | |
Commitments and contingencies | | | | | | | | |
Stockholders' equity: | | | | | | | | |
Preferred stock, $0.001 par value, 1,000,000 shares authorized, no shares issued and outstanding as of June 30, 2024 and December 31, 2023, respectively. | | | — | | | | — | |
Common stock $0.001 par value, 20,000,000 shares authorized, 3,831,711 and 3,815,212 shares issued and outstanding as of June 30, 2024 and December 31, 2023, respectively. | | | 4 | | | | 4 | |
Additional paid-in capital | | | 23,731 | | | | 23,531 | |
Other accumulated comprehensive loss | | | (96 | ) | | | (49 | ) |
Retained earnings | | | 11,802 | | | | 11,934 | |
Total stockholders' equity | | | 35,441 | | | | 35,420 | |
Total liabilities and stockholders’ equity | | $ | 62,821 | | | $ | 65,152 | |
The accompanying notes are an integral part of these unaudited financial statements.
ISSUER DIRECT CORPORATION AND SUBSIDIARIES
CONSOLIDATED STATEMENTS OF OPERATIONS
(UNAUDITED)
(in thousands, except share and per share amounts)
| | For the Three Months Ended | | | For the Six Months Ended | |
| | June 30, | | | June 30, | | | June 30, | | | June 30, | |
| | 2024 | | | 2023 | | | 2024 | | | 2023 | |
Revenues | | $ | 7,687 | | | $ | 9,651 | | | $ | 14,649 | | | $ | 18,270 | |
Cost of revenues | | | 1,785 | | | | 2,336 | | | | 3,506 | | | | 4,165 | |
Gross profit | | | 5,902 | | | | 7,315 | | | | 11,143 | | | | 14,105 | |
Operating costs and expenses: | | | | | | | | | | | | | | | | |
General and administrative | | | 2,164 | | | | 2,274 | | | | 3,983 | | | | 4,606 | |
Sales and marketing expenses | | | 1,970 | | | | 2,039 | | | | 4,066 | | | | 4,420 | |
Product development | | | 719 | | | | 532 | | | | 1,373 | | | | 1,306 | |
Depreciation and amortization | | | 715 | | | | 723 | | | | 1,439 | | | | 1,445 | |
Total operating costs and expenses | | | 5,568 | | | | 5,568 | | | | 10,861 | | | | 11,777 | |
Operating income | | | 334 | | | | 1,747 | | | | 282 | | | | 2,328 | |
Interest expense, net | | | (294 | ) | | | (281 | ) | | | (570 | ) | | | (519 | ) |
Other income (expense), net | | | 14 | | | | 379 | | | | 219 | | | | (156 | ) |
Income (loss) before taxes | | | 54 | | | | 1,845 | | | | (69 | ) | | | 1,653 | |
Income tax expense | | | 47 | | | | 482 | | | | 63 | | | | 434 | |
Net income (loss) | | $ | 7 | | | $ | 1,363 | | | $ | (132 | ) | | $ | 1,219 | |
Income (loss) per share – basic | | $ | 0.00 | | | $ | 0.36 | | | $ | (0.03 | ) | | $ | 0.32 | |
Income (loss) per share – fully diluted | | $ | 0.00 | | | $ | 0.36 | | | $ | (0.03 | ) | | $ | 0.32 | |
Weighted average number of common shares outstanding – basic | | | 3,821 | | | | 3,795 | | | | 3,818 | | | | 3,793 | |
Weighted average number of common shares outstanding – fully diluted | | | 3,823 | | | | 3,808 | | | | 3,821 | | | | 3,809 | |
The accompanying notes are an integral part of these unaudited financial statements.
ISSUER DIRECT CORPORATION AND SUBSIDIARIES
CONSOLIDATED STATEMENTS OF COMPREHENSIVE INCOME (LOSS)
(UNAUDITED)
(in thousands)
| | For the Three Months Ended | | | For the Six Months Ended | |
| | June 30, | | | June 30, | | | June 30, | | | June 30, | |
| | 2024 | | | 2023 | | | 2024 | | | 2023 | |
Net income (loss) | | $ | 7 | | | $ | 1,363 | | | $ | (132 | ) | | $ | 1,219 | |
Foreign currency translation adjustment | | | (13 | ) | | | 44 | | | | (47 | ) | | | 45 | |
Comprehensive (loss) income | | $ | (6 | ) | | $ | 1,407 | | | $ | (179 | ) | | $ | 1,264 | |
The accompanying notes are an integral part of these unaudited financial statements.
ISSUER DIRECT CORPORATION AND SUBSIDIARIES
CONSOLIDATED STATEMENTS OF STOCKHOLDERS’ EQUITY
(UNAUDITED)
(in thousands, except share and per share amounts)
| | Common Stock | | | Additional Paid-in | | | Accumulated Other Comprehensive | | | Retained | | | Total Stockholders’ | |
| | Shares | | | Amount | | | Capital | | | Income (Loss) | | | Earnings | | | Equity | |
Balance at December 31, 2022 | | | 3,791,020 | | | $ | 4 | | | $ | 22,147 | | | $ | (96 | ) | | $ | 11,168 | | | $ | 33,223 | |
Stock-based compensation expense | | | — | | | | — | | | | 337 | | | | — | | | | — | | | | 337 | |
Foreign currency translation | | | — | | | | — | | | | — | | | | 1 | | | | — | | | | 1 | |
Net loss | | | — | | | | — | | | | — | | | | — | | | | (144 | ) | | | (144 | ) |
Balance at March 31, 2023 | | | 3,791,020 | | | $ | 4 | | | $ | 22,484 | | | $ | (95 | ) | | $ | 11,024 | | | $ | 33,417 | |
Stock-based compensation expense | | | — | | | | — | | | | 354 | | | | — | | | | — | | | | 354 | |
Exercise of stock awards, net of tax | | | 18,129 | | | | — | | | | — | | | | — | | | | — | | | | — | |
Foreign currency translation | | | — | | | | — | | | | — | | | | 44 | | | | — | | | | 44 | |
Net income | | | — | | | | — | | | | — | | | | — | | | | 1,363 | | | | 1,363 | |
Balance at June 30, 2023 | | | 3,809,149 | | | $ | 4 | | | $ | 22,838 | | | $ | (51 | ) | | $ | 12,387 | | | $ | 35,178 | |
| | | | | | | | | | | | | | | | | | | | | | | | |
Balance at December 31, 2023 | | | 3,815,212 | | | $ | 4 | | | $ | 23,531 | | | $ | (49 | ) | | $ | 11,934 | | | $ | 35,420 | |
Stock-based compensation expense | | | — | | | | — | | | | (67 | ) | | | — | | | | — | | | | (67 | ) |
Exercise of stock awards, net of tax | | | 2,167 | | | | — | | | | — | | | | — | | | | — | | | | — | |
Foreign currency translation | | | — | | | | — | | | | — | | | | (34 | ) | | | — | | | | (34 | ) |
Net loss | | | — | | | | — | | | | — | | | | — | | | | (139 | ) | | | (139 | ) |
Balance at March 31, 2024 | | | 3,817,379 | | | $ | 4 | | | $ | 23,464 | | | $ | (83 | ) | | $ | 11,795 | | | $ | 35,180 | |
Stock-based compensation expense | | | — | | | | — | | | | 267 | | | | — | | | | — | | | | 267 | |
Exercise of stock awards, net of tax | | | 14,332 | | | | — | | | | — | | | | — | | | | — | | | | — | |
Foreign currency translation | | | — | | | | — | | | | — | | | | (13 | ) | | | — | | | | (13 | ) |
Net income | | | — | | | | — | | | | — | | | | — | | | | 7 | | | | 7 | |
Balance at June 30, 2024 | | | 3,831,711 | | | $ | 4 | | | $ | 23,731 | | | $ | (96 | ) | | $ | 11,802 | | | $ | 35,441 | |
The accompanying notes are an integral part of these unaudited financial statements.
ISSUER DIRECT CORPORATION AND SUBSIDIARIES
CONSOLIDATED STATEMENTS OF CASH FLOWS
(UNAUDITED)
(in thousands)
| | For the Six Months Ended | |
| | June 30, | | | June 30, | |
| | 2024 | | | 2023 | |
Cash flows from operating activities: | | | | | | |
Net (loss) income | | $ | (132 | ) | | $ | 1,219 | |
Adjustments to reconcile net income to net cash provided by operating activities: | | | | | | | | |
Depreciation and amortization | | | 1,540 | | | | 1,472 | |
Provision for credit losses | | | 595 | | | | 260 | |
Deferred income taxes | | | (72 | ) | | | (299 | ) |
Change in fair value of interest rate swaps | | | (219 | ) | | | (214 | ) |
Stock-based compensation expense | | | 200 | | | | 691 | |
Non-cash interest adjustment on note payable | | | 8 | | | | 4 | |
Changes in operating assets and liabilities: | | | | | | | | |
Decrease (increase) in accounts receivable | | | (928 | ) | | | (1,587 | ) |
Decrease (increase) in other assets | | | 52 | | | | (256 | ) |
Increase (decrease) in accounts payable | | | (230 | ) | | | (89 | ) |
Increase (decrease) in accrued expenses | | | (110 | ) | | | 488 | |
Increase (decrease) in deferred revenue | | | 92 | | | | 314 | |
Net cash provided by operating activities | | | 796 | | | | 2,003 | |
| | | | | | | | |
Cash flows from investing activities: | | | | | | | | |
Capitalized software | | | (400 | ) | | | (167 | ) |
Purchase of fixed assets | | | (16 | ) | | | (11 | ) |
Purchase of acquired business, net of cash received | | | — | | | | 350 | |
Net cash provided by (used in) investing activities | | | (416 | ) | | | 172 | |
| | | | | | | | |
Cash flows from financing activities: | | | | | | | | |
Payment of note payable | | | (2,000 | ) | | | (22,000 | ) |
Issuance of secured promissory note | | | — | | | | 19,988 | |
Payment for capitalized debt issuance costs | | | — | | | | (88 | ) |
Net cash used in financing activities | | | (2,000 | ) | | | (2,100 | ) |
| | | | | | | | |
Net change in cash and cash equivalents | | | (1,620 | ) | | | 75 | |
Cash and cash equivalents – beginning | | | 5,714 | | | | 4,832 | |
Currency translation adjustment | | | (74 | ) | | | 54 | |
Cash and cash equivalents – ending | | $ | 4,020 | | | $ | 4,961 | |
| | | | | | | | |
Supplemental disclosures: | | | | | | | | |
Cash paid for income taxes | | $ | 101 | | | $ | 158 | |
Cash paid for interest | | $ | 754 | | | $ | 887 | |
The accompanying notes are an integral part of these unaudited financial statements.
ISSUER DIRECT CORPORATION AND SUBSIDIARIES
NOTES TO CONSOLIDATED FINANCIAL STATEMENTS
(UNAUDITED)
Note 1. Basis of Presentation
The unaudited interim consolidated balance sheet as of June 30, 2024 and consolidated statements of operations, comprehensive income, stockholders’ equity and cash flows for the three and six-month periods ended June 30, 2024 and 2023 included herein, have been prepared in accordance with the instructions for Form 10-Q under the Securities Exchange Act of 1934, as amended (the “Exchange Act”), and Article 10 of Regulation S-X under the Exchange Act. In the opinion of management, they include all normal recurring adjustments necessary for a fair presentation of the financial statements. Results of operations reported for the interim periods are not necessarily indicative of results for the entire year. Certain information and footnote disclosures normally included in financial statements prepared in accordance with accounting principles generally accepted in the United States ("US GAAP") have been condensed or omitted pursuant to such rules and regulations relating to interim financial statements. The interim financial information should be read in conjunction with the 2023 audited financial statements of Issuer Direct Corporation (the “Company”, “We”, or “Our”) filed on Form 10-K for the year ended December 31, 2023.
Note 2. Summary of Significant Accounting Policies
The consolidated financial statements include the accounts of the Company and its wholly owned subsidiaries. Significant intercompany accounts and transactions are eliminated in consolidation.
Earnings Per Share (EPS)
Earnings per share accounting guidance requires that basic net income per common share be computed by dividing net income for the period by the weighted average number of common shares outstanding during the period. Diluted net income per share is computed by dividing the net income for the period by the weighted average number of common and dilutive common equivalent shares outstanding during the period. Shares issuable upon the exercise of stock options totaling 70,750 and 68,750 were excluded in the computation of diluted earnings per common share during the three and six-month periods ended June 30, 2024, respectively, because their impact was anti-dilutive. There were 72,250 shares issuable upon the exercise of stock options excluded in the computation of diluted earnings per common share during the three and six-month periods ended June 30, 2023, because their impact was anti-dilutive.
Revenue Recognition
Substantially all the Company’s revenue comes from contracts with customers for subscriptions to its cloud-based products or contracts for Communications and Compliance products and services. Customers consist of public corporate issuers and professional firms, such as investor and public relations firms. In the case of news distribution and webcasting offerings, customers also include private companies. The Company accounts for a contract with a customer when there is an enforceable contract between the Company and the customer, the rights of the parties are identified, the contract has economic substance, and collectability of the contract consideration is probable. The Company's revenues are measured based on consideration specified in the contract with each customer.
The Company's contracts include either a subscription to its entire platform, certain modules within the platform or to its Press Release Optimizer Plan (“PRO”), or an agreement to perform services, or any combination thereof, and often contain multiple subscriptions and services. For these bundled contracts, the Company accounts for individual subscriptions and services as separate performance obligations if they are distinct, which is when a product or service is separately identifiable from other items in the bundled package, and a customer can benefit from it on its own or with other resources that are readily available to the customer. The Company separates revenue from its contracts into two revenue streams: i) Communications and ii) Compliance. Performance obligations of Communications contracts include providing subscriptions to certain modules or our entire Communications platform, distributing press releases on a per release basis or conducting webcasts, virtual annual meetings, or other events on a per event basis. PRO subscription contracts contain two performance obligations: (i) the first is a series of distinct services that include, but are not limited to, developing specific media plans, and creating content to be distributed and (ii) the second performance obligation being access to the PRO platform along with distribution of press releases, ongoing support, and assessment of performance as a stand-ready obligation. Performance obligations of Compliance contracts include providing subscriptions to certain Compliance modules or other stand-ready obligations to deliver services and annual report printing and distribution. Additionally, services are provided on a per project basis. Set up fees for disclosure services are considered a separate performance obligation and are satisfied upfront. Set up fees for the transfer agent module and investor relations content management module are immaterial. The Company’s subscription and service contracts are generally for one year, with automatic renewal clauses included in the contract until the contract is cancelled. The contracts do not contain any rights of returns, guarantees, or warranties. Since contracts are generally for one year, all the revenue is expected to be recognized within one year from the contract start date. As such, the Company has elected the optional exemption that allows the Company not to disclose the transaction price allocated to performance obligations that are unsatisfied or partially satisfied at the end of each reporting period.
The Company recognizes revenue for subscriptions evenly over the contract period, upon distribution for per release contracts and upon event completion for webcasting and virtual annual meeting events. For service contracts that include stand ready obligations, revenue is recognized evenly over the contract period. For all other services delivered on a per project or event basis, the revenue is recognized at the completion of the event. The Company believes recognizing revenue for subscriptions and stand ready obligations using a time-based measure of progress, best reflects the Company’s performance in satisfying the obligations.
For bundled contracts, revenue is allocated to each performance obligation based on its relative standalone selling price. Standalone selling prices are based on observable prices at which the Company separately sells the subscription or service. If a standalone selling price is not directly observable, the Company uses the residual method to allocate any remaining price to that subscription or service. The Company reviews standalone selling prices, at least annually, and updates these estimates if necessary.
The Company invoices its customers based on the billing schedules designated in its contracts, typically upfront on either a monthly, quarterly or annual basis or per transaction at the completion of the performance obligation. Deferred revenue for the periods presented was primarily related to press release packages which have been prepaid, however the releases have not yet been disseminated, as well as, subscription and service contracts, which are billed upfront, quarterly, or annually, however the revenue has not yet been recognized. The associated deferred revenue is generally recognized as press releases are disseminated for press release packages and ratably over the billing period for subscriptions. Deferred revenue as of June 30, 2024 and December 31, 2023, was $5,476,000 and $5,412,000, respectively, and is expected to be recognized within one year. Revenue recognized for the six months ended June 30, 2024 and 2023, which was included in the deferred revenue balance at the beginning of each reporting period, was approximately $4,934,000 and $4,337,000, respectively. Accounts receivable, net of allowance for credit losses, related to contracts with customers was $4,686,000 and $4,368,000 as of June 30, 2024 and December 31, 2023, respectively. Since substantially all the contracts have terms of one year or less, the Company has elected to use the practical expedient regarding the existence of a significant financing.
Costs to obtain contracts with customers consist primarily of sales commissions. As of June 30, 2024 and December 31, 2023, the Company has capitalized $118,000 and $130,000, respectively, of costs to obtain contracts that are expected to be amortized over more than one year. For contract costs expected to be amortized in less than one year, the Company has elected to use the practical expedient allowing the recognition of incremental costs of obtaining a contract as an expense when incurred. The Company has considered historical renewal rates, expectations of future renewals and economic factors in making these determinations.
Cash Equivalents
For purposes of the Company’s financial statements, the Company considers all highly liquid investments purchased with an original maturity date of three months or less to be cash equivalents.
Accounts Receivable and Allowance for Credit Losses
The Company adopted Financial Accounting Standards Codification (“ASC”) Topic 326, Financial Statements – Credit Losses (“Topic 326”) with an adoption date of January 1, 2023. As a result, the Company changed its accounting policy for allowance for doubtful accounts using an expected losses model rather than using incurred losses. The new model is based on the credit losses expected to arise over the life of the asset based on the Company’s expectations as of the balances sheet date through analyzing historical customer data as well as taking into consideration current economic trends. The Company adopted Topic 326 and determined it did not have a material financial impact.
The roll forward of the allowance for doubtful accounts for the three and six-months ended June 30, 2024 and 2023, are as follows (in 000’s):
| | For the Three Months Ended | | | For the Six Months Ended | |
| | June 30, | | | June 30, | | | June 30, | | | June 30, | |
| | 2024 | | | 2023 | | | 2024 | | | 2023 | |
| | | | | | | | | | | | |
Beginning balance | | $ | 1,144 | | | $ | 858 | | | $ | 1,119 | | | $ | 745 | |
Provision for credit losses | | | 313 | | | | 109 | | | | 595 | | | | 260 | |
Write-offs | | | (301 | ) | | | (11 | ) | | | (558 | ) | | | (49 | ) |
Ending Balance | | | 1,156 | | | | 956 | | | | 1,156 | | | | 956 | |
Concentration of Credit Risk
Financial instruments and related items which potentially subject the Company to concentrations of credit risk consist primarily of cash, cash equivalents and accounts receivables. The Company places its cash and temporary cash investments with credit quality institutions. As of June 30, 2024, the Company’s domestic cash balance is spread among different depository institutions such that there is no balance which exceeds the FDIC insurance limit of $250,000. The Company also had cash-on-hand of $64,000 in Europe and $1,293,000 in Canada as of June 30, 2024.
The Company believes it did not have any financial instruments that could have potentially subjected us to significant concentrations of credit risk for any relevant period.
Use of Estimates
The preparation of financial statements in conformity with US GAAP requires management to make estimates and assumptions that affect the reported amounts of assets and liabilities and disclosure of contingent assets and liabilities at the date of the financial statements and the reported amounts of revenues and expenses during the reporting period. Significant estimates include the allowance for credit losses and the valuation of goodwill, intangible assets, deferred tax assets, and stock-based compensation. Actual results could differ from those estimates.
Income Taxes
Deferred income tax assets and liabilities are computed for differences between the financial statement and tax bases of assets and liabilities that will result in future taxable or deductible amounts based on enacted tax laws and rates applicable to the periods in which the differences are expected to affect taxable income. Valuation allowances are established, when necessary, to reduce deferred income tax assets to the amounts expected to be realized. For any uncertain tax positions, the Company recognizes the impact of a tax position, only if it is more likely than not of being sustained upon examination, based on the technical merits of the position. The Company’s policy regarding the classification of interest and penalties is to classify them as income tax expense in the financial statements, if applicable.
Capitalized Software
Costs incurred to develop the Company’s cloud-based platform products are capitalized when the preliminary project phase is complete, management commits to fund the project and it is probable the project will be completed and used for its intended purposes. Once the software is substantially complete and ready for its intended use, the software is amortized over its estimated useful life, which is typically four years. Costs related to design or maintenance of the software are expensed as incurred. Capitalized costs and amortization for the three and six-month periods ended June 30, 2024 and 2023, are as follows (in thousands):
| | For the Three Months Ended | | | For the Six Months Ended | |
| | June 30, | | | June 30, | | | June 30, | | | June 30, | |
| | 2024 | | | 2023 | | | 2024 | | | 2023 | |
| | | | | | | | | | | | |
Capitalized software development costs | | $ | 155 | | | $ | 167 | | | $ | 400 | | | $ | 167 | |
Amortization included in cost of revenues | | | 54 | | | | 13 | | | | 100 | | | | 28 | |
Impairment of Long-lived Assets
In accordance with the authoritative guidance for accounting for long-lived assets, assets such as property and equipment, trademarks, and intangible assets subject to amortization, are reviewed for impairment whenever events or changes in circumstances indicate that the carrying amount of an asset group may not be recoverable. Recoverability of asset groups to be held and used is measured by a comparison of the carrying amount of an asset group to estimated undiscounted future cash flows expected to be generated by the asset group. If the carrying amount of an asset group exceeds its estimated future cash flows, an impairment charge is recognized by the amount by which the carrying amount of an asset group exceeds fair value of the asset group.
Lease Accounting
The Company determines if an arrangement is a lease at inception. Operating lease agreements are primarily for office space and are included within lease right-of-use (“ROU”) assets and lease liabilities on the consolidated balance sheet.
ROU assets represent the right to use an underlying asset for the lease term and lease liabilities represent the obligation to make lease payments arising from the lease. ROU assets and lease liabilities are recognized at the commencement date based on the present value of lease payments over the lease term. Variable lease payments consist of non-lease services related to the lease and payments under operating leases classified as short-term. Variable lease payments are excluded from the ROU assets and lease liabilities and are recognized in the period in which the obligation for those payments is incurred. As most of the leases do not provide an implicit rate, the Company uses its incremental borrowing rate based on the information available at commencement date in determining the present value of lease payments. ROU assets include any lease payments due and exclude lease incentives. Rental expense for lease payments related to operating leases is recognized on a straight-line basis over the lease term.
Fair Value Measurements
Accounting Standards Codification (“ASC”) Topic 820 establishes a fair value hierarchy that requires an entity to maximize the use of observable inputs and minimize the use of unobservable inputs when measuring fair value. Assets and liabilities recorded at fair value in the financial statements are categorized based upon the hierarchy of levels of judgment associated with the inputs used to measure their fair value. Hierarchical levels directly related to the amount of subjectivity associated with the inputs to fair valuation of these assets and liabilities, are as follows:
| · | Level 1 - Quoted prices are available in active markets for identical assets or liabilities at the reporting date. Generally, this includes debt and equity securities that are traded in an active market. Cash and cash equivalents are quoted at Level 1. |
| · | Level 2 - Observable inputs other than Level 1 prices such as quoted prices for similar assets or liabilities; quoted prices in markets that are not active; or other inputs that are observable or can be corroborated by observable market data for substantially the full term of the assets or liabilities. The fair value of the Company’s long-term debt and interest rate swap are quoted at Level 2. |
| | |
| · | Level 3 - Unobservable inputs that are supported by little or no market activity and that are significant to the fair value of the assets or liabilities. Level 3 assets and liabilities include financial instruments whose value is determined using pricing models, discounted cash flow methodologies, or other valuation techniques, as well as instruments for which the determination of fair value requires significant management judgment or estimation. |
As of June 30, 2024 and December 31, 2023, the Company believes the fair value of its financial instruments, such as, accounts receivable, long-term debt, the line of credit, and accounts payable approximate their carrying amounts.
Translation of Foreign Financial Statements
The financial statements of the foreign subsidiaries of the Company have been translated into U.S. dollars. All assets and liabilities have been translated at current rates of exchange in effect at the end of the period. Income and expense items have been translated at the average exchange rates for the year or the applicable interim period. The gains or losses that result from this process are recorded as a separate component of other accumulated comprehensive income until the entity is sold or substantially liquidated.
Business Combinations, Goodwill, and Intangible Assets
The authoritative guidance for business combinations specifies the criteria for recognizing and reporting intangible assets apart from goodwill. The Company records the assets acquired and liabilities assumed in business combinations at their respective fair values at the date of acquisition, with any excess purchase price recorded as goodwill. Goodwill is an asset representing the future economic benefits arising from other assets acquired in a business combination that are not individually identified and separately recognized. Intangible assets consist of client relationships, customer lists, distribution partner relationships, software, technology, non-compete agreements and trademarks that are initially measured at fair value. At the time of the business combination, trademarks may be considered an indefinite-lived asset and, as such, are not amortized as there may be no foreseeable limit to cash flows generated from them. For the Newswire acquisition the Company determined the trademarks acquired were considered a definite lived asset which will be amortized over a period of 15 years. The client relationships (5-10 years), customer lists (3 years), distribution partner relationships (10 years), non-compete agreements (5 years) and software and technology (3-7 years) are amortized over their estimated useful lives. The goodwill and intangible assets are assessed annually for impairment, or whenever conditions indicate the asset may be impaired, and any such impairment will be recognized in the period identified.
As of June 30, 2024, the Company’s market capitalization is less than the carrying value of its equity, plus net debt. This may be an indicator of impairment of the Company’s long-lived assets, however, at this time, management believes the Company’s stock price is in temporary decline and also considers other factors such as future growth, positive cash flow and other measures the Company is able to control in determining if a quantitative test is necessary. Should the stock price continue to remain at levels below the Company’s carrying value, a quantitative test may be necessary, which could conclude an impairment exists.
Comprehensive Income
Comprehensive income consists of net income and other comprehensive income related to changes in the cumulative foreign currency translation adjustment.
Advertising
The Company expenses advertising as incurred. During the three and six-month periods ended June 30, 2024, advertising expense was $339,000 and $778,000, respectively. During the three and six-month periods ended June 30, 2023, advertising expense was $364,000 and $826,000, respectively.
Stock-based Compensation
The authoritative guidance for stock compensation requires that companies estimate the fair value of share-based payment awards on the date of the grant using an option-pricing model. The associated cost is recognized over the period during which an employee or director is required to provide service in exchange for the award.
Note 3: Equity
Dividends
The Company did not pay any dividends during the three and six-month periods ended June 30, 2024 and 2023.
Preferred stock and common stock
There were no issuances of preferred stock or common stock during the three and six-month periods ended June 30, 2024 and 2023, other than stock awarded to employees and the Board of Directors.
2014 Equity Incentive Plan
On May 23, 2014, the shareholders of the Company approved the 2014 Equity Incentive Plan, as amended (the “2014 Plan”). Under the terms of the 2014 Plan, the Company is authorized to issue incentive awards for common stock up to 200,000 shares to employees and other personnel. On June 10, 2016 and June 17, 2020, the shareholders of the Company approved an additional 200,000 and 200,000 awards, respectively, to be issued under the 2014 Plan, bringing the total number of shares to be awarded to 600,000. The awards may be in the form of incentive stock options, nonqualified stock options, restricted stock, restricted stock units and performance awards. The 2014 Plan was effective through March 31, 2024. As of June 30, 2024, there are 105,076 shares which remain to be granted under the 2014 Plan. These shares were assumed by the 2023 Plan described below.
On June 7, 2023, the shareholders of the Company approved the 2023 Equity Incentive Plan (the “2023 Plan”). Under the terms of the 2023 Plan, the Company is authorized to issue incentive awards for common stock up to 300,000 shares to employees and other personnel. The awards may be in the form of incentive stock options, nonqualified stock options, restricted stock, restricted stock units and performance awards. The 2023 Plan is effective through April 1, 2033. As of June 30, 2024, there are 358,244 shares which remain to be granted under the 2023 Plan, including 105,076 shares assumed under the 2014 Plan described above.
The following table summarizes information about stock options outstanding and exercisable at June 30, 2024:
| | Options Outstanding | | | Options Exercisable | |
Exercise Price Range | | Number | | | Weighted Average Remaining Contractual Life (in Years) | | | Weighted Average Exercise Price | | | Number | |
$ 0.01 - 8.00 | | | 5,000 | | | | 1.39 | | | $ | 6.80 | | | | 5,000 | |
$ 8.01 - 11.00 | | | 3,000 | | | | 3.50 | | | $ | 10.25 | | | | 3,000 | |
$ 11.01 - 16.00 | | | 18,000 | | | | 4.03 | | | $ | 13.12 | | | | 18,000 | |
$ 16.01 - 27.00 | | | 38,000 | | | | 7.55 | | | $ | 24.96 | | | | 15,500 | |
$ 27.01 - 27.71 | | | 12,750 | | | | 7.55 | | | $ | 27.71 | | | | — | |
Total | | | 76,750 | | | | 6.16 | | | $ | 20.88 | | | | 41,500 | |
As of June 30, 2024, the Company had unrecognized stock compensation related to the options of $291,000, which will be recognized through 2027.
During the three and six-months ended June 30, 2024, the Company granted 6,000 and 32,500, respectively, of restricted stock units to employees and contractors, which vest at various intervals over the next 3 years. The average grant date fair value of these grants was $9.70 and $13.91 per share during the three and six-month periods ended June 30, 2024, respectively. During the three and six-months ended June 30, 2023, the Company granted 14,332 and 74,732 restricted stock units, with a grant date fair value of $18.70 and $26.08 per share, respectively. During the three and six-month periods ended June 30, 2024, 14,332 and 16,499 restricted stock units with an average intrinsic value of $18.70 and 19.95 per share, respectively, vested. As of June 30, 2024, there was $1,143,000 of unrecognized compensation cost related to our unvested restricted stock units, which will be recognized through 2027.
Note 4: Income Taxes
The Company recognized an income tax expense of $47,000 and $63,000 for the three and six-month period ended June 30, 2024, compared to income tax expense of $482,000 and $434,000 during the same periods of 2023. At the end of each interim period, the Company estimates the effective tax rate expected to be applicable for the full fiscal year and this rate is applied to the results for the year-to-date period, and then adjusted for any discrete period items. For the three and six-month periods ended June 30, 2024 and 2023, the variance between our effective tax rate and the U.S. statutory rate of 21% is primarily attributable to state income tax and expenses not deductible for tax purposes. For the three and six-month periods ended June 30, 2024, the effective tax rate was also impacted by additional expense associated with vesting of stock-based compensation.
Note 5: Leases
Leasing activity generally consists of office leases. In March 2019, we signed a new lease to move the corporate headquarters to Raleigh, North Carolina. The new lease, which had a lease commencement date of October 2, 2019, expires December 31, 2027. Minimum lease payments are $2,997,000, not including a tenant improvement allowance of $488,000, which is included in fixed assets as of June 30, 2024. The Company recognized a ROU asset and corresponding lease liability of $2,596,000, which represents the present value of minimum lease payments discounted at 3.77%, the Company’s incremental borrowing rate at lease inception.
Lease liabilities totaled $1,224,000 as of June 30, 2024. The current portion of this liability of $384,000 is included in Accrued expenses on the Consolidated balance sheets and the long-term portion of $840,000 is included in Lease liabilities on the Consolidated Balance Sheets. Rent expense consists of both operating lease expense from amortization of our ROU assets as well as variable lease expense which consists of non-lease components of office leases (i.e. common area maintenance) or rent expense associated with short-term leases. The components of lease expense were as follows (in 000’s):
| | For the Three Months Ended | | | For the Six Months Ended | |
| | June 30, | | | June 30, | | | June 30, | | | June 30, | |
| | 2024 | | | 2023 | | | 2024 | | | 2023 | |
Lease expense | | | | | | | | | | | | |
Operating lease expense | | $ | 76 | | | $ | 76 | | | $ | 152 | | | $ | 152 | |
Variable lease expense | | | 18 | | | | 15 | | | | 32 | | | | 21 | |
Total lease expense | | $ | 94 | | | $ | 91 | | | $ | 184 | | | $ | 173 | |
The weighted-average remaining non-cancelable lease term for our operating leases was 3.50 years as of June 30, 2024. As of June 30, 2024, the weighted-average discount rate used to determine the lease liability was 3.77%. The future minimum lease payments to be made under non-cancelable operating leases on June 30, 2024, are as follows (in 000’s):
Year Ended December 31: | | | |
2024 | | $ | 191 | |
2025 | | | 390 | |
2026 | | | 401 | |
2027 | | | 412 | |
Total lease payments | | | 1,394 | |
Present value adjustment | | | (170 | ) |
Lease liability | | $ | 1,224 | |
We have performed an evaluation of our other contracts with customers and suppliers in accordance with Topic 842 and have determined that, except for the leases described above, none of our contracts contain a lease.
Note 6: Revenue
The Company considers itself to be a single reportable segment under the authoritative guidance for segment reporting, specifically a communications and compliance company for publicly traded and private companies. The following tables present revenue disaggregated by revenue stream in (000’s):
| | Three months ended June 30, | |
Revenue Streams | | 2024 | | | 2023 | |
Communications | | $ | 5,944 | | | | 77.3 | % | | $ | 5,936 | | | | 61.5 | % |
Compliance | | | 1,743 | | | | 22.7 | % | | | 3,715 | | | | 38.5 | % |
Total | | $ | 7,687 | | | | 100.0 | % | | $ | 9,651 | | | | 100.0 | % |
| | Six months ended June 30, | |
Revenue Streams | | 2024 | | | 2023 | |
Communications | | $ | 11,403 | | | | 77.8 | % | | $ | 12,502 | | | | 68.4 | % |
Compliance | | | 3,246 | | | | 22.2 | % | | | 5,768 | | | | 31.6 | % |
Total | | $ | 14,649 | | | | 100.0 | % | | $ | 18,270 | | | | 100.0 | % |
The Company did not have any customers during the three and six-month periods ended June 30, 2024 or the six-month period ended June 30, 2023 that accounted for more than 10% of our revenue. There was one customer during the three-month period ended June 30, 2023 that accounted for more than 10% of revenue.
Note 7: Credit Agreement
On March 20, 2023 (the “Closing Date”), the Company entered into a $25 million credit agreement (the “Credit Agreement”) with Pinnacle Bank (“Pinnacle”). The Credit Agreement provides for the following: (i) term loan facility in an aggregate principal amount of $20 million (the “Term Loan”), and (ii) revolving line of credit in an up to aggregate principal amount of $5 million (the “Revolving LOC”), subject to an 85% limit based on the current eligible accounts receivable (as defined in the Credit Agreement).
Pursuant to the terms of the Credit Agreement, the per annum interest rate of the Term Loan is variable based on the one-month secured overnight financing rate (“SOFR”) plus 2.35%, subject to a minimum SOFR of 2.00%. However, the Term Loan issued on the Closing Date has a per annum interest rate of 6.217%, which was fixed with respect to the entire principal amount as a result of an interest rate swap agreement entered into between the Company and Pinnacle on the Closing Date in accordance with the terms of the Credit Agreement.
The Company began making monthly interest only payments on the Term Loan on April 1, 2023. On January 1, 2024, the Company began making monthly principal payments of $333,333 plus interest payments on the Term Loan until the maturity date of December 20, 2028.
The proceeds of the Term Loan along with certain cash on hand of the Company were used to repay in its entirety the one-year Secured Promissory Note (the “Seller Note”) issued to Lead Capital, LLC (“the Seller”) in connection with the Company’s November 1, 2022 acquisition of iNewswire.com LLC (“Newswire”) for a lump sum payment of $22,880,000. In order to settle the Seller Note on March 20, 2023, the Company paid $370,000 to Seller, with the Seller agreeing to forgive $440,000 of interest which would have otherwise been due. The $370,000 payment is recorded in Other income (expense), net on the Consolidated statements of operations for the six months ended June 30, 2023.
Effective June 25, 2024, the aggregate principal amount of the Revolving LOC was reduced to $1,500,000. The Company currently has no plans to utilize the Revolving LOC but may do so in the future. If the Company does utilize any funds under the Revolving LOC, the funds will bear interest at a per annum rate equal to the then current SOFR plus 2.05%. Effective June 25, 2024, Pinnacle’s commitment to fund under the Revolving LOC was amended to terminate on June 30, 2025, unless terminated earlier pursuant to the terms of the Credit Agreement. The Company terminated its existing $3,000,000 unsecured line of credit with Fifth Third Bank immediately prior to the Closing Date. As of June 30, 2024, there was no outstanding balance under the Revolving LOC and the interest rate was 7.39%.
The Credit Agreement originally contained financial covenants, which commenced with fiscal quarter ending June 30, 2023, and were subsequently amended on June 25, 2024, as follows:
| Original | As Amended |
Fiscal Quarter | Fixed Charge Coverage Ratio | Fixed Charge Coverage Ratio |
Each fiscal quarter ending on or after June 30, 2023 through June 30, 2024 | 1.2:1.0 | 1.2:1.0 |
Fiscal quarter ending on or after September 30, 2024 through March 31, 2025 | 1.2:1.0 | 1.15:1.0 |
Each fiscal quarter ending on or after June 30, 2025 | 1.2:1.0 | 1.2:1.0 |
| | |
| Leverage Ratio | Leverage Ratio |
Each fiscal quarter ending on or after June 30, 2023 through September 30, 2023 | 2.75:1.0 | 2.75:1.0 |
Fiscal quarter ending December 31, 2023 | 2.5:1.0 | 2.5:1.0 |
Fiscal quarter ending March 31, 2024 | 2.5:1.0 | 2.75:1.0 |
Each fiscal quarter ending on or after June 30, 2024 through September 30, 2024 | 2.5:1.0 | 3.5:1.0 |
Fiscal quarter ending December 31, 2024 | 2.5:1.0 | 3.0:1.0 |
Fiscal quarter ending March 31, 2025 | 2.5:1.0 | 2.85:1.0 |
Each fiscal quarter ending on or after June 30, 2025 | 2.5:1.0 | 2.75:1.0 |
Additionally, as long as the Company maintains a Leverage Ratio greater than 2.75 : 1.0, the Company is required to maintain unrestricted liquidity, as defined in the amendment, of not less than $1,500,000, beginning June 30, 2024.
The Credit Agreement also contains customary affirmative covenants for a transaction of this nature, including among other things, covenants relating to: maintenance of adequate financial and accounting books and records, delivery of financial statements and other information, preservation of existence of the Company and subsidiaries, payment of taxes and claims, compliance with laws, maintenance of insurance, foreign qualification, use of proceeds, cash management system, maintenance of properties, and conduct of business.
The Credit Agreement also contains customary negative covenants for a transaction of this nature, including, among other things, covenants relating to debt, liens, investments, negative pledges, dividends and other debt payments, restriction on fundamental changes, sale of assets, transactions with affiliates, restrictive agreements, and changes in fiscal year.
The Credit Agreement also contains various Events of Default (subject to certain grace periods, to the extent applicable), including among other things, Events of Default for the nonpayment of principal, interest or fees; breach of certain covenants; inaccuracy of the representations or warranties in any material respect; bankruptcy or insolvency; dissolution or change of control; certain unsatisfied judgments; defaults under material agreements; certain unfunded liabilities under employee benefit plans; certain unsatisfied judgments; certain ERISA violations; and the invalidity or unenforceability of the Credit Agreement. If an Event of Default occurs, the Company may be required to repay all amounts outstanding under the Credit Agreement. The Term Loan and any advances under the Revolving LOC are secured by a first priority lien and security interest to the benefit of Pinnacle in the Event of Default on all of the Company’s current or future assets and each of the Guarantor’s current or future assets.
Note 8: Interest Rate Swap
The Company entered into an interest rate swap agreement to convert its interest rate exposure from variable rate to fixed rate to control cash outflows related to interest on its variable rate debt. The Company has $20,000,000 of notional amount interest rate swap agreement, which amortizes in-line with its long-term credit agreement. Under the swap agreement, the Company pays a fixed rate of interest at 6.217% and receives an average variable rate of SOFR + 2.35% adjusted monthly. At June 30, 2024, the weighted average rate was 7.69%.
The carrying amount for the Company’s derivative financial instrument is the estimated fair value of the financial instrument. The Company’s derivative is not exchange listed and therefore the fair value is estimated under a mark-to-market approach using an analytics model that is a readily observable market input. This model reflects the contractual terms of the derivative, such as notional value and expiration date, as well as market-based observables including interest rates, yield curves, and the credit quality of the counterparty. The model also incorporates the Company’s creditworthiness in order to appropriately reflect non-performance risk. Inputs to the derivative pricing model are generally observable and do not contain a high level of subjectivity, and accordingly, the Company’s derivative is classified within Level 2 of the fair value hierarchy. While the Company believes its estimate results in a reasonable reflection of the fair value of the instrument, the estimated value may not be representative of actual value that could have been realized or that will be realized in the near future.
In accounting for the interest rate swap, the Company has determined it does not qualify for hedge accounting. The fair value of the swap agreement as of June 30, 2024 and December 31, 2023 was a net asset of $198,000 and net liability of $21,000, respectively, and is included in Other long-term assets and Other long-term liabilities, in the Consolidated Balance Sheets. The fair value of the swap agreement excludes accrued interest and takes into consideration current interest rates and current likelihood of the swap counterparty’s compliance with its contractual obligations. During the three and six-month periods ended June 30, 2024, we recognized a gain of $14,000 and $219,000, respectively, in Other income (expense) in the Consolidated statements of operations, as a result of the interest rate swap. During the three and six-month periods ended June 30, 2023, we recognized a gain of $379,000 and $214,000, respectively, in Other income (expense) in the Consolidated statements of operations, as a result of the interest rate swap.
ITEM 2. MANAGEMENT’S DISCUSSION AND ANALYSIS OF FINANCIAL CONDITION AND RESULTS OF OPERATIONS.
The discussion of the financial condition and results of operations of the Company set forth below should be read in conjunction with the consolidated financial statements and related notes thereto included elsewhere in this Form10-Q. This Form10-Q contains forward-looking statements that involve risks and uncertainties. The statements contained in this Form10-Q that are not purely historical are forward-looking statements within the meaning of Section 27a of the Securities Act and Section 21e of the Exchange Act. When used in this Form10-Q, or in the documents incorporated by reference into this Form 10-Q, the words “anticipate,” “believe,” “estimate,” “intend” and “expect” and similar expressions are intended to identify such forward-looking statements. Such forward-looking statements include, without limitation, the statements regarding the Company’s strategy, future sales, future expenses, future liquidity, and capital resources. All forward-looking statements in this Form10-Q are based upon information available to the Company on the date of this Form10-Q, and the Company assumes no obligation to update any such forward-looking statements. The Company’s actual results could differ materially from those discussed in this Form10-Q for many reasons. Factors that could cause or contribute to such differences (“Cautionary Statements”) include, but are not limited to, those discussed in Item 1. Business — “Risk Factors” and elsewhere in the Company’s Annual Report on Form10-K for the year ended December 31, 2023, which are incorporated by reference into this Form 10-Q. All subsequent written and oral forward-looking statements attributable to the Company, or persons acting on the Company’s behalf, are expressly qualified in their entirety by the Cautionary Statements.
Overview
Issuer Direct Corporation and its subsidiaries are hereinafter collectively referred to as “Issuer Direct”, the “Company”, “We” or “Our” unless otherwise noted. Our corporate headquarters are located at One Glenwood Ave., Suite 1001, Raleigh, North Carolina, 27603.
We announce material financial information to our investors using our investor relations website, SEC filings, investor events, news and earnings releases, public conference calls, webcasts, and social media. We use these channels to communicate with our investors and the public about our company, our products and services and other related matters. It is possible that information we post on some of these channels could be deemed to be material information. Therefore, we encourage investors, the media and others interested in Issuer Direct to review the information we post to all our channels, including our social media accounts.
We are a leading communications and compliance company, providing solutions for both public relations and investor relations professionals. Our comprehensive solutions are used by thousands of customers from emerging startups to multi-billion-dollar global brands, ensuring their most important moments are reaching the right audiences, via our industry leading newswire, IR website solutions, events technology and compliance solutions. Our platform efficiently and effectively helps our customers manage their events when seeking to distribute their messaging to key constituents, investors, markets and regulatory systems around the globe.
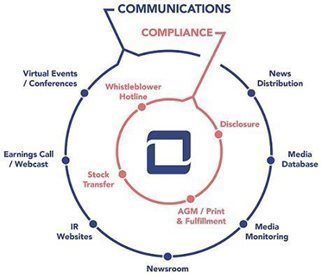
Our platform consists of several related but distinct Communications and Compliance modules that companies and customers utilize every quarter. As such, we disclose our revenue in the following two main categories: (i) Communications and (ii) Compliance. Set forth below is an infographic depicting the products included in each of these two main categories we provide today:
Long term, we expect the Communications portion of our business to continue to increase, both in terms of overall revenue and as compared to the Compliance portion of our business. Therefore, we plan to continue to invest in offerings we intend to incorporate into and complement our Communications product lineup. Within most of our target markets, customers require several individual services and/or software providers to meet their communications and investor relations needs. We believe our platform can address all these needs in a single, secure, cloud-based platform - one that offers a customer control, increases efficiencies, demonstrates clear value and, most importantly, delivers consistent and compliant messaging from one centralized platform.
We work with a diverse customer base, which includes not only corporate issuers and private companies, but also investment banks, professional firms, such as investor relations and public relations firms, as well as the accounting and legal communities. Our customers and their service providers utilize our platform and related solutions from document creation all the way to dissemination to regulatory bodies, news outlets, financial platforms, and our customers’ shareholders. Private companies primarily use our news distribution, newsroom and webcasting products and services to disseminate their message globally.
We also work with several select stock exchanges by making available certain parts of our platform under agreements to integrate our offerings within their products. We believe such partnerships will continue to yield increased exposure to a targeted customer base that could impact our revenue and overall brand in the market.
Communications
Our Communications platform consists of our press release distribution businesses branded as ACCESSWIRE and Newswire, our webcasting and events business, professional conference and events software, as well as our investor relations website technology. Our ACCESSWIRE and Newswire news distribution platforms have been integrated into one dissemination platform that will give our customers all the distribution benefits of our global distribution footprint. These products are sold as the leading part of our Communications subscription, as well as individually to customers around the globe and are further described below. Like other newswires, ours are dependent upon several key partners for its news distribution. Disruption in any of our partnerships could have a materially adverse impact on our overall business.
ACCESSWIRE
Our leading press release offering, which is marketed under the brand ACCESSWIRE, is a news dissemination and media outreach service. The ACCESSWIRE product offering focuses on press release distribution for both private and public companies globally. We believe ACCESSWIRE is becoming a competitive alternative in the newswire industry because we have been able to use our technological advancements to allow customers to self-edit releases or use our editorial staff as desired to edit releases. We continue to expand our distribution points, improve our targeting and enhance our analytics reporting. We also offer an e-commerce element to our ACCESSWIRE product, whereby customers can self-select their distribution, register, and then upload their press release for editorial review in minutes. We believe these enhancements have helped increase ACCESSWIRE revenues each year compared to the prior year, a trend we expect to continue over the next several years. We have also been able to maintain high gross margins while providing our customer flexible pricing, with options to pay per release or enter longer-term agreements for a designated package of releases.
Newswire
The Newswire brand was acquired on November 1, 2022, as part of the iNewswire, LLC transaction. Today we continue to operate this brand independently as a stand-alone front-end marketing and news distribution brand option for private companies. Its distribution was fully integrated into ACCESSWIRE’s distribution network in early 2023. Newswire began in 2016 as an ecommerce news distribution platform, that has evolved over the years to serve thousands of customers globally. Additionally, the brand added new products to complement its news distribution services, such as media database, media rooms and PR Optimizer (”PRO”).
Our PRO offering, formally Media Advantage Platform, automates media and marketing communications for businesses seeking to deliver the right message to the right audience at the right time for the right purpose. Through the PRO offering, we provide content and media communications services that provide customers the opportunity to optimize their content and increase their media visibility, therefore building their brand awareness and engaging a larger audience. With the flexibility of these offerings, customers have the ability to choose between support with content optimization, increased media visibility, or both for optimal results. We believe the PRO product offering provides the most effective and efficient integrated media and content communication program available in the market today.
We believe for the near term we will operate the newswire brand (newswire.com) platform separate from ACCESSWIRE as there are clear customer segmentation differentiation and offerings surrounding both the Investor Relations and Public Relations Community. However, as the market changes, we could move the brands together and alter the offerings to remain competitive in the market.
Media Suite
As part of the iNewswire acquisition, we acquired certain assets that with further development resulted in our ability to release a subscription add-on to our Newswire and ACCESSWIRE brands, which we call Media Suite. The Media Suite offering provides communication professionals with the opportunity to build their story, incorporate artificial intelligence (AI) if desired, effectively pitch the media, and monitor their internal brand as well as their competitors. This is all accomplished with a blend of human curation and an advanced AI engine that ultimately serves as the foundation of an easy-to-use workflow we branded as our Media Suite. Media Suite is a recurring subscription product, with three subscription options available: Media Suite Starter, Media Suite Plus, and Media Suite Enterprise, each providing different combinations of our solutions to help our customers reach their goals.
Media Suite includes three products: Media Database, Media Pitching, and Media Monitoring, all of which are further described below.
Media Database – Our media database is based on the idea that pitching the media should be a targeted endeavor. Our dataset includes only the journalists that are actively writing and publishing articles. We built this component in reverse, looking at the tens of millions of articles published annually and sorted articles by industry, publication and journalist, then curated the most accurate data of each contact and made it available within our media database. Additionally, within the interface we made it easy to see each article published by every journalist a user may want to connect with, making Media Suite a compelling combination of the right features and intelligence between database, pitching, and monitoring.
Media Pitching – Pitching is a critical part of the Media Suite because it allows the user to contact and connect with the most active journalists in their industry. Media Suite not only gives the user the professionals to pitch, it also offers AIMee, our AI writing and recommendation engine, to enhance the user’s message, write a new message and highlight engageable content to help bring their pitch to the forefront.
Media Monitoring – a brand Monitoring solution is extremely important, and every company should consider monitoring not only their brands, but their products, executives and competitors mentioned in all mediums – print, broadcast media and television, web, radio, video, blogs and social media. Our monitoring solution offers many of these mediums and we will continue to undergo expansion in each of these mediums with a goal of being a comprehensive media monitoring solution within the next year. Our media monitoring solution ties together our journalist contacts and mention analytics into and with a customer’s dashboard of daily activity.
Media Room
A natural addition to our ACCESSWIRE and investor relations website business is our corporate Media Room. This product offering can be an add-on to any customer’s ACCESSWIRE or Communications subscription account. The Media Room suite includes a custom newsroom page builder, a brand asset manager and contact manager.
Our Media Room suite addresses the needs of our customers looking to build connections with media, journalists, customers and if applicable the investment community. According to a survey from TekGroup, a majority of journalists and media professionals indicated the importance of newsrooms that include digital media, press kits and video. We believe our Media Room suite accomplishes this by making it a part of our new Media Suite, giving us a further competitive advantage in the market. This also allows our customers to have one media platform to manage all their assets, brands and outreach.
Webcasting & Events
Our webcasting and events business is comprised of our earnings call webcasting solutions and our virtual meeting and events software (such as annual meetings, deal/non-deal road shows, analyst days and shareholder days).
Our Webcasting Platform is a cloud-based webcast, webinar and virtual meeting platform that delivers live and on-demand streaming of events to audiences of all sizes. Our solution allows customers to create, produce and deliver events, which we feel has significantly strengthened our webcasting product and Communications offering. The platform architecture gives us the ability to host thousands of webcasts each year, expanding and diversifying our webcast business from our historical earnings-based events to include any type of virtual event.
Traditional earnings calls and webcasts are a highly competitive market with the majority of the business being driven from practitioners in investor relations and communications firms. We estimate there are approximately 5,000 companies in North America conducting earnings events each quarter that include a teleconference, webcast or both as part of their events. Our platform incorporates other elements of the earnings event, including earnings date/call announcement, earnings press release and SEC Form 8-K filings. There are a handful of our competitors that can offer this integrated full-service solution today, however, we believe our real-time event setup and integrated approach offers a more effective way to manage the process. As we expand our platform, it is vital for us to have solutions that service both our core public companies but also a growing segment of private customers.
Professional Conference and Events Software
Our professional conference and events software is a subscription offering we currently license to investor conference organizers. This software, which is also available as a native mobile app, offers organizers, issuers and investors the ability to register, request and approve one-on-one meetings, manage schedules, perform event promotion and sponsorship, print attendee badges and manage lodging. This cloud-based product can be used in a virtual or in person conference setting and is integrated within our Communications subscription offerings of newswire, newsrooms, webcasting and shareholder targeting. We believe this integration gives us a unique offering for professional conference organizers that is not available elsewhere in the market.
Investor Relations Websites
Our investor relations content network is another component of our Communications offering, which is used to create the investor relations’ tab of a company’s website. This investor relations content network is a robust series of data feeds including news feeds, stock feeds, fundamentals, regulatory filings, corporate governance and many other components which are aggregated from most of the major exchanges and news distribution outlets around the world. Customers can subscribe to one or more of these data feeds or as a component of a fully designed and hosted website for pre-IPO companies, SEC reporting companies and partners seeking to display our content on their corporate sites. The clear benefit to our investor relations content network is its integration with our other Communications offerings. As such, companies can produce content for public distribution and it is automatically linked to their corporate website, distributed to targeted groups and placed into our data feed partners.
During 2023 we released significant upgrades to our investor relations website, that included ADA Compliance (Americans with Disabilities Act) which ensures that people with disabilities have the same access to all areas of a business's premises, specifically, customers’ websites. This add-on requires a recurring annual subscription and is delivered fully integrated into and with our investor relations website offering.
Compliance
Our Compliance offerings consist of our disclosure software for financial reporting, stock transfer services, whistleblower hotline and related annual meeting, print and shareholder distribution services. Some of these products are sold as part of a Compliance subscription as well as individually to customers around the globe.
Disclosure Software and Services
Our disclosure reporting module is a document conversion, editing and filing offering which is designed for reporting companies and professionals seeking to insource the document drafting, editing and filing processes to the SEC’s EDGAR system. Our disclosure business also offers companies the ability to use our in-house staff to assist in the conversion, tagging and filing of their documents. We generate revenues in disclosure both from software and services and, in most cases, customers have both components within their annual agreements, while others pay for services as they are completed.
Whistleblower Hotline
Our whistleblower hotline is an add-on product within our platform. This system delivers secure notifications and basic incident workflow management processes that align with a company’s corporate governance whistleblower policy. As a supported and subsidized bundle product of the New York Stock Exchange (“NYSE”) offerings, we are introduced to new IPO customers and other larger cap customers listed on the NYSE. Since 2014, we have been a named NYSE subsidy provider of this Whistleblower solution. Recently, we have been working on upgrading the incident response and management component of the workflow, which is expected to be deployed this year.
Stock Transfer Module
A valued subscription module in our Compliance offering is the ability for our customers to gain access to real-time information about their shareholders, stock ledgers and reports and to issue new shares from our cloud-based stock transfer module. Managing the capitalization table of a public company or pre-IPO company is a cornerstone of corporate governance and transparency, and as such companies and community banks have chosen us to assist with their stock transfer needs, including bond offerings and dividend management. This is an industry which has experienced declining overall revenues as it was affected by the replacement of paper certificates with digital certificates. However, we have been focused on selling subscriptions of the stock transfer component of our platform, allowing customers to gain access to our cloud-based system in order to move shares or query shareholders, which we believe has resulted in a more efficient process for both our customers and us.
Annual Meeting / Proxy Voting Platform
Our proxy module is marketed as a fully integrated, real-time voting platform for our customers and their shareholders of record. This module is utilized for every annual meeting or special meeting we manage for our customers and offers both full-set mailing and notice of internet availability options.
This module has been incorporated within our webcasting offering to enable our customers the ability to conduct their annual meetings in-person or fully virtual. Our solution incorporates shareholder and guest registration, voting integration, real-time statistics on attendance, audio video and presentation features as well as fully managed meeting managers and inspector of elections. We believe a virtual component to an annual meeting is both a benefit to all shareholders and a corporate governance advantage.
Shareholder Distribution
In the past, we have worked on refining the model of digital distribution of our customers’ message to the investment community and beyond. This was accomplished by integrating our shareholder outreach module, Investor Network, into and with our Compliance offerings. Most of the customers subscribing to this module today are historical PrecisionIR (“PIR”) – Annual Report Service (“ARS”) users, as well as new customers purchasing the entire platform subscription. We migrated some of the customers from the traditional ARS business into this new digital subscription business, however, we continue to operate a portion of this legacy physical hard copy delivery of annual reports and prospectuses for customers who opt to take advantage of it. We continue to see customer attrition for customers who subscribe to both the electronic and physical distribution of reports as a stand-alone product.
Results of Operations
Comparison of results of operations for the three and six-months ended June 30, 2024 and 2023 (in 000’s):
| | Three Months Ended June 30, | | | Percentage of Revenue(1) | |
| | 2024 | | | 2023 | | | 2024 | | | 2023 | |
Revenue: | | | | | | | | | | | | |
Communications revenue | | $ | 5,944 | | | $ | 5,936 | | | | 77 | % | | | 62 | % |
Compliance revenue | | | 1,743 | | | | 3,715 | | | | 23 | % | | | 38 | % |
Total revenue | | | 7,687 | | | | 9,651 | | | | 100 | % | | | 100 | % |
Cost of revenue: | | | | | | | | | | | | | | | | |
Communications cost of revenue | | | 1,326 | | | | 1,433 | | | | 22 | % | | | 24 | % |
Compliance cost of revenue | | | 459 | | | | 903 | | | | 26 | % | | | 24 | % |
Total cost of revenue | | | 1,785 | | | | 2,336 | | | | 23 | % | | | 24 | % |
Gross Margin: | | | | | | | | | | | | | | | | |
Communications gross margin | | | 4,618 | | | | 4,503 | | | | 78 | % | | | 76 | % |
Compliance gross margin | | | 1,284 | | | | 2,812 | | | | 74 | % | | | 76 | % |
Total gross margin | | | 5,902 | | | | 7,315 | | | | 77 | % | | | 76 | % |
Operating Expenses: | | | | | | | | | | | | | | | | |
General and administrative | | | 2,164 | | | | 2,274 | | | | 28 | % | | | 24 | % |
Sales and marketing | | | 1,970 | | | | 2,039 | | | | 26 | % | | | 21 | % |
Product development | | | 719 | | | | 532 | | | | 9 | % | | | 6 | % |
Depreciation and amortization | | | 715 | | | | 723 | | | | 9 | % | | | 7 | % |
Total expenses | | | 5,568 | | | | 5,568 | | | | 72 | % | | | 58 | % |
Operating income | | | 334 | | | | 1,747 | | | | 4 | % | | | 18 | % |
Interest expense, net | | | (294 | ) | | | (281 | ) | | | (4 | )% | | | (3 | )% |
Other income | | | 14 | | | | 379 | | | | 0 | % | | | 4 | % |
Income before income taxes | | | 54 | | | | 1,845 | | | | 1 | % | | | 19 | % |
Income tax expense | | | 47 | | | | 482 | | | | 1 | % | | | 5 | % |
Net income | | $ | 7 | | | $ | 1,363 | | | | 0 | % | | | 14 | % |
| | Six Months Ended June 30, | | | Percentage of Revenue(1) | |
| | 2024 | | | 2023 | | | 2024 | | | 2023 | |
Revenue: | | | | | | | | | | | | |
Communications revenue | | $ | 11,403 | | | $ | 12,502 | | | | 78 | % | | | 68 | % |
Compliance revenue | | | 3,246 | | | | 5,768 | | | | 22 | % | | | 32 | % |
Total revenue | | | 14,649 | | | | 18,270 | | | | 100 | % | | | 100 | % |
Cost of revenue: | | | | | | | | | | | | | | | | |
Communications cost of revenue | | | 2,668 | | | | 2,817 | | | | 23 | % | | | 23 | % |
Compliance cost of revenue | | | 838 | | | | 1,348 | | | | 26 | % | | | 23 | % |
Total cost of revenue | | | 3,506 | | | | 4,165 | | | | 24 | % | | | 23 | % |
Gross Margin: | | | | | | | | | | | | | | | | |
Communications gross margin | | | 8,735 | | | | 9,685 | | | | 77 | % | | | 77 | % |
Compliance gross margin | | | 2,408 | | | | 4,420 | | | | 74 | % | | | 77 | % |
Total gross margin | | | 11,143 | | | | 14,105 | | | | 76 | % | | | 77 | % |
Operating Expenses: | | | | | | | | | | | | | | | | |
General and administrative | | | 3,983 | | | | 4,606 | | | | 27 | % | | | 25 | % |
Sales and marketing | | | 4,066 | | | | 4,420 | | | | 28 | % | | | 24 | % |
Product development | | | 1,373 | | | | 1,306 | | | | 9 | % | | | 7 | % |
Depreciation and amortization | | | 1,439 | | | | 1,445 | | | | 10 | % | | | 8 | % |
Total expenses | | | 10,861 | | | | 11,777 | | | | 74 | % | | | 64 | % |
Operating income | | | 282 | | | | 2,328 | | | | 2 | % | | | 13 | % |
Interest expense, net | | | (570 | ) | | | (519 | ) | | | (4 | )% | | | (3 | )% |
Other income (expense), net | | | 219 | | | | (156 | ) | | | 1 | % | | | (1 | )% |
(Loss) income before income taxes | | | (69 | ) | | | 1,653 | | | | 0 | % | | | 9 | % |
Income tax expense | | | 63 | | | | 434 | | | | 0 | % | | | 2 | % |
Net (loss) income | | $ | (132 | ) | | $ | 1,219 | | | | (1 | )% | | | 7 | % |
| (1) | Percentage of revenue is calculated as the relevant revenue, expense, income amount divided by total revenue, except for communications and compliance cost of revenue and communications and compliance gross margin, which are divided by the related component of revenue. |
Revenues
Total revenue decreased $1,964,000, or 20%, to $7,687,000 during the three months ended June 30, 2024, as compared to $9,651,000 for the same period of 2023. Total revenue decreased by $3,621,000, also 20%, to $14,649,000 during the six months ended June 30, 2024, as compared to $18,270,000 during the same period of 2023. For the three months ended June 30, 2024, the decrease is attributable to a decrease in revenue from our Compliance revenue stream, however for the six months ended June 30, 2024, the decrease in revenue is attributable to a decrease in both our Compliance and Communications revenue streams.
Communications revenue increased $8,000 to $5,944,000 for the three months ended June 30, 2024, compared to $5,936,000 for the same period of 2023. For the six months ended June 30, 2024, Communications revenue decreased $1,099,000, or 9% to $11,403,000 from $12,502,000 for the same period of 2023. The decrease in revenue for the six months ended June 30, 2024, is primarily attributable to lower volumes from our Newswire brand. Communications revenue represented 77% and 78% of total revenue during the three and six months ended June 30, 2024, respectively, as compared to 62% and 68%, respectively, for the same periods of 2023.
Compliance revenue decreased $1,972,000, or 53% and $2,522,000, or 44%, during the three and six months ended June 30, 2024, respectively, as compared to the same periods of 2023. The decrease is primarily related to a decrease in revenue from our print and proxy fulfillment services due to a few one-time, significant transactions which occurred during the three and six months ended June 30, 2023, however, did not occur in the current year. Additionally, we experienced a decrease in revenue from our transfer agent services due to a decrease in corporate actions and directives during the period.
Revenue Backlog
As of June 30, 2024, our deferred revenue balance was $5,476,000, which we expect to recognize over the next twelve months, compared to $5,412,000 as of December 31, 2023, an increase of 1%. Deferred revenue primarily consists of advance billings for pre-paid packages of our news distribution products as well as advance billings for subscriptions of our cloud-based products and annual service contracts.
Cost of Revenues
Communications cost of revenues consist primarily of direct labor costs, newswire distribution costs, teleconferencing costs, and third-party licensing costs. Compliance cost of revenues consist primarily of direct labor costs, warehousing, logistics, print production materials and postage. Cost of revenues decreased $551,000, or 24% and $659,000, or 16%, during the three and six months ended June 30, 2024, respectively, as compared to the same periods of 2023. Overall gross margin decreased $1,413,000, or 19% and $2,962,000, or 21%, during the three and six months ended June 30, 2024, respectively, as compared to the same periods of 2023. Overall gross margin percentage increased to 77% for the three months ended June 30, 2024, as compared to 76% during the same period of 2023, however, decreased 1% during the six months ended June 30, 2024, as compared to the same period of 2023.
Cost of revenues associated with our Communications revenue decreased $107,000, or 7% and $149,000, or 5%, during the three and six months ended June 30, 2024, respectively, as compared to the same periods of 2023. The decreases are primarily due optimization of our editorial staff and lower distribution costs. Gross margin percentage associated with our Communications revenue was 78% and 77% for the three and six-months ended June 30, 2024, respectively, as compared to 76% and 77% during the same periods of 2023.
Cost of revenues associated with our Compliance revenue decreased $444,000, or 49% and $510,000, or 38%, during the three and six months ended June 30, 2024, respectively, as compared to the same period of 2023. The decrease is due to lower print and postage costs associated with the decreased revenue from print and proxy fulfillment services during the periods. As a result, gross margin percentage associated with our Compliance revenue decreased to 74% for the three and six-months ended June 30, 2024, as compared to 76% and 77%, respectively, for the same periods of 2023.
General and Administrative Expenses
General and administrative expenses consist primarily of salaries, bonuses, stock-based compensation, insurance, fees for professional services, general corporate expenses (including provision for credit losses) and facility and equipment expenses. General and administrative expenses were $2,164,000 during the three months ended June 30, 2024, a decrease of $110,000, or 5%, as compared to the same period of 2023. General and administrative expenses were $3,983,000 for the six months ended June 30, 2024, a decrease of $623,000, or 14%, as compared to the same period of 2023. The decreases are primarily driven by a benefit to stock compensation expense as a result of the resignation of an executive officer, a decrease in corporate headcount, as well as, lower one-time transaction and integrations costs, partially offset by an increase in the provision for credit losses.
As a percentage of revenue, general and administrative expenses were 28% and 27% for the three and six-months ended June 30, 2024, respectively, as compared to 24% and 25% for the same periods of 2023.
Sales and Marketing Expenses
Sales and marketing expenses consist primarily of salaries, stock-based compensation, sales commissions, advertising expenses, tradeshow expenses and other marketing expenses. Sales and marketing expenses were $1,970,000 for the three months ended June 30, 2024, a decrease of $69,000, or 3%, as compared to the same period of 2023. Sales and marketing expenses were $4,066,000 for the six months ended June 30, 2024, a decrease of $354,000, or 8% as compared to the same period of 2023. These decreases are primarily due to lower employee-related expenses, including commissions.
As a percentage of revenue, sales and marketing expenses were 26% and 28% for the three and six months ended June 30, 2024, respectively, as compared to 21% and 24% for the same periods of 2023.
Product Development Expenses
Product development expenses consist primarily of salaries, stock-based compensation, bonuses, and licenses to develop new products and technology to complement and/or enhance our platform. Product development expenses increased $187,000, or 35% and $67,000, or 5% to $719,000 and $1,373,000 during the three and six months ended June 30, 2024, respectively, as compared to the same periods of 2023. These increases are primarily due to an increase in headcount as we continue to invest in our products and technology. During the three and six months ended June 30, 2024, we capitalized $155,000 and $400,000, respectively, compared to $167,000 during both the three and six months ended June 30, 2023.
As a percentage of revenue, product development expenses were 9% for both the three and six months ended June 30, 2024, respectively, as compared to 6% and 7% for the same periods of 2023.
Interest expense, net
We recognized interest expense of $315,000 and $623,000 for the three and six months ended June 30, 2024, respectively, compared to $375,000 and 712,000 during the same periods of 2023. Interest expense for these periods is related to our long-term credit agreement. For the six months ended June 30, 2023, interest expense is also attributed to the $22,000,000 Seller Note. These amounts are partially offset by interest income of $21,000 and $53,000 for the three and six months ended June 30, 2024, respectively, and $94,000 and $193,000 for the three and six months ended June 30, 2023, from deposit and money market accounts.
Other income (expense), net
Other income (expense), net represents the change in fair value of our interest rate swap. For the six months ended June 30, 2023, Other income (expense), net also includes expense related to $370,000 paid to extinguish the Seller Note.
Income Taxes
The Company recognized an income tax expense of $47,000 and $63,000 for the three and six-month period ended June 30, 2024, compared to income tax expense of $482,000 and $434,000 during the same periods of 2023. At the end of each interim period, the Company estimates the effective tax rate expected to be applicable for the full fiscal year and this rate is applied to the results for the year-to-date period, and then adjusted for any discrete period items. For the three and six-month periods ended June 30, 2024 and 2023, the variance between our effective tax rate and the U.S. statutory rate of 21% is primarily attributable to state income tax and expenses not deductible for tax purposes. For the three and six-month periods ended June 30, 2024, the effective tax rate was also impacted by additional expense associated with vesting of stock-based compensation.
Liquidity and Capital Resources
As of June 30, 2024, we had $4,020,000 in cash and cash equivalents and $4,686,000 in net accounts receivable. Current liabilities as of June 30, 2024, totaled $12,559,000 including our accounts payable, deferred revenue, accrued payroll liabilities, income taxes payable, current portion of long-term debt, current portion of lease liabilities and other accrued expenses. On June 30, 2024, our current liabilities exceeded our current assets by $2,320,000.
See Note 7 to our financial statements regarding information on our Credit Agreement.
Disclosure about Off-Balance Sheet Arrangements
We do not have any transactions, agreements or other contractual arrangements that constitute off-balance sheet arrangements.
Non-GAAP Measures
Management believes that certain non-GAAP measures, such as non-GAAP free cash flow, non-GAAP adjusted free cash flow, non-GAAP adjusted EBITDA (“adjusted EBITDA”), and non-GAAP adjusted net income (“adjusted net income”) provide useful information about our operating results and enhance the overall ability to assess our financial performance. We use these measures, together with other measures of performance prepared in accordance with accounting principles generally accepted in the United States (“GAAP”), to compare the relative performance of operations in planning, budgeting, and reviewing the performance of our business. Adjusted EBITDA and adjusted net income allow investors to make a more meaningful comparison between our core business operating results over different periods of time. We believe that adjusted EBITDA and adjusted net income, when viewed with our results under US GAAP and the accompanying reconciliations, provide useful information about our business without regard to potential distortions. By eliminating potential differences in results of operations between periods caused by factors such as acquisition-related expenses and other items as described below, we believe adjusted EBITDA and adjusted net income can provide a useful additional basis for comparing the current performance of the underlying operations being evaluated.
Management uses free cash flow, which is defined as net cash flows provided by operating activities less payments for purchases of fixed assets and capitalized software, in reviewing the financial performance and cash generation by our various business groups and evaluating cash levels. We believe free cash flow is a useful measure for investors because it portrays our ability to grow organically and generate cash from our businesses for purposes such as paying interest on our indebtedness, repaying debt, funding business acquisitions, investing in product development, re-purchasing our common stock, and paying dividends, if it is determined we do so in the future. In addition, securities analysts, investors, and others frequently use free cash flow in their evaluation of companies. Adjusted free cash flow represents a further non-GAAP adjustment to free cash flow to exclude the effect of cash paid for acquisition and integration related activities and unusual or non-recurring transactions. Management believes that by excluding these infrequent or unusual items from free cash flow, it better portrays our ability to generate cash, as such items are not indicative of the Company’s operating performance for the period.
The uses of these non-GAAP financial measures are not intended to be considered in isolation of, or as substitute for, the financial information prepared and presented in accordance with US GAAP. Free cash flow and adjusted free cash flow do not necessarily represent funds available for discretionary use and are not necessarily a measure of our ability to fund our cash needs. Our calculation of free cash flow and adjusted free cash flow may differ from similarly titled measures used by other companies, limiting their usefulness as a comparative measure. Free cash flow and adjusted free cash flow are non-GAAP financial measures.
For the three and six months ended June 30, 2024 and 2023, free cash flow and adjusted free cash flow were as follows:
| | Three Months Ended June 30, | |
| | 2024 | | | 2023 | |
| | | | | | |
Net cash (used in) provided by operating activities (US GAAP) | | $ | (190 | ) | | $ | 1,731 | |
Payments for purchase of fixed assets and capitalized software | | | (155 | ) | | | (163 | ) |
Free cash flow (Non-GAAP) | | | (345 | ) | | | 1,568 | |
Cash paid for acquisition and/or integration related items (1) | | | — | | | | 204 | |
Cash paid for other unusual items (2) | | | 53 | | | | — | |
Adjusted free cash flow (Non-GAAP) | | $ | (292 | ) | | $ | 1,772 | |
| | Six Months Ended June 30, | |
| | 2024 | | | 2023 | |
| | | | | | |
Net cash provided by operating activities (US GAAP) | | $ | 796 | | | $ | 2,003 | |
Payments for purchase of fixed assets and capitalized software | | | (416 | ) | | | (168 | ) |
Free cash flow (Non-GAAP) | | | 380 | | | | 1,835 | |
Cash paid for acquisition and/or integration related items (1) | | | 23 | | | | 281 | |
Cash paid for other unusual items (2) | | | 88 | | | | 395 | |
Adjusted free cash flow (Non-GAAP) | | $ | 491 | | | $ | 2,511 | |
| (1) | This adjustment gives effect to one-time corporate projects, including acquisition and/or integration related expenses, paid during the periods. |
| (2) | For the three and six months ended June 30, 2024, this adjustment gives effect to payments for one-time accounting fees, termination benefits and other non-recurring or unusual expenses. During the six months ended June 30, 2023, this adjustment is primarily related to a one-time payment of $370,000 related to the early termination of the note payable associated with the Newswire acquisition. |
Adjusted EBITDA and adjusted net income are non-GAAP financial measures and should not be considered as a substitute for analysis of our results as reported under US GAAP. These measures are defined differently by different companies, and accordingly, such measures may not be comparable to similarly titled measures of other companies and have important limitations as an analytical tool.
A reconciliation of net income to adjusted EBITDA for the three and six months ended June 30, 2024 and 2023, is presented in the following table (in 000’s):
| | Three Months Ended June 30, | |
| | 2024 | | | 2023 | |
| | Amount | | | Amount | |
| | | | | | |
Net income: | | $ | 7 | | | $ | 1,363 | |
Adjustments: | | | | | | | | |
Depreciation and amortization | | | 770 | | | | 736 | |
Interest expense, net | | | 294 | | | | 281 | |
Income tax expense | | | 47 | | | | 482 | |
EBITDA | | | 1,118 | | | | 2,862 | |
Acquisition and/or integration costs(1) | | | 42 | | | | 137 | |
Other non-recurring expenses(2) | | | 38 | | | | (334 | ) |
Stock-based compensation expense(3) | | | 267 | | | | 354 | |
Adjusted EBITDA: | | $ | 1,465 | | | $ | 3,019 | |
| | Six Months Ended June 30, | |
| | 2024 | | | 2023 | |
| | Amount | | | Amount | |
| | | | | | |
Net (loss) income: | | $ | (132 | ) | | $ | 1,219 | |
Adjustments: | | | | | | | | |
Depreciation and amortization | | | 1,540 | | | | 1,472 | |
Interest expense, net | | | 570 | | | | 519 | |
Income tax expense | | | 63 | | | | 434 | |
EBITDA | | | 2,041 | | | | 3,644 | |
Acquisition and/or integration costs(1) | | | 107 | | | | 371 | |
Other non-recurring expenses(2) | | | (132 | ) | | | 201 | |
Stock-based compensation expense(3) | | | 200 | | | | 691 | |
Adjusted EBITDA: | | $ | 2,216 | | | $ | 4,907 | |
| (1) | This adjustment gives effect to one-time corporate projects, including acquisition and/or integration related expenses, incurred during the periods. |
| (2) | For the three and six months ended June 30, 2024, this adjustment gives effect to a gain recorded on the change in fair value of our interest rate swap of $14,000 and $219,000, respectively, partially offset by one-time accounting fees, termination benefits and other non-recurring or unusual expenses of $52,000 and $87,000, respectively. For the three months ended June 30, 2023, this adjustment gives effect to a gain recorded on the change in fair value of our interest rate swap of $379,000, partially offset by one-time, non-recurring expenses of $45,000. For the six months ended June 30, 2023, this adjustment gives effect to $370,000 payment related to early extinguishment of our Seller Note and one-time non-recurring expenses of $45,000, partially offset by a gain recorded on the change in fair value of our interest rate swap of $214,000. |
| (3) | The adjustments represent stock-based compensation expense related to awards of stock options, restricted stock units, or common stock in exchange for services. Although we expect to continue to award stock in exchange for services, the amount of stock-based compensation is excluded as it is subject to change as a result of one-time or non-recurring projects. |
A reconciliation of net income to adjusted net income for the three and six months ended June 30, 2024 and 2023 is presented in the following table (in 000’s):
| | Three Months Ended June 30, | |
| | 2024 | | | 2023 | |
| | Amount | | | Per diluted share | | | Amount | | | Per diluted share | |
| | | | | | | | | | | | |
Net income: | | $ | 7 | | | $ | 0.00 | | | $ | 1,363 | | | $ | 0.36 | |
Adjustments: | | | | | | | | | | | | | | | | |
Amortization of intangible assets(1) | | | 678 | | | | 0.18 | | | | 685 | | | | 0.18 | |
Stock-based compensation expense(2) | | | 267 | | | | 0.07 | | | | 354 | | | | 0.09 | |
Other unusual items(3) | | | 80 | | | | 0.02 | | | | (197 | ) | | | (0.05 | ) |
Discrete items impacting income tax expense | | | 30 | | | | 0.01 | | | | — | | | | — | |
Tax impact of adjustments(4) | | | (215 | ) | | | (0.06 | ) | | | (177 | ) | | | (0.05 | ) |
Non-GAAP net income: | | $ | 847 | | | $ | 0.22 | | | $ | 2,028 | | | $ | 0.53 | |
Weighted average number of common shares outstanding – diluted | | | 3,823 | | | | | | | | 3,808 | | | | | |
| | Six Months Ended June 30, | |
| | 2024 | | | 2023 | |
| | Amount | | | Per diluted share | | | Amount | | | Per diluted share | |
| | | | | | | | | | | | |
Net (loss) income: | | $ | (132 | ) | | $ | (0.03 | ) | | $ | 1,219 | | | $ | 0.32 | |
Adjustments: | | | | | | | | | | | | | | | | |
Amortization of intangible assets(1) | | | 1,363 | | | | 0.36 | | | | 1,370 | | | | 0.36 | |
Stock-based compensation expense(2) | | | 200 | | | | 0.05 | | | | 691 | | | | 0.18 | |
Other unusual items(3) | | | (25 | ) | | | (0.01 | ) | | | 572 | | | | 0.15 | |
Discrete items impacting income tax expense | | | 85 | | | | 0.02 | | | | — | | | | — | |
Tax impact of adjustments(4) | | | (323 | ) | | | (0.08 | ) | | | (553 | ) | | | (0.14 | ) |
Non-GAAP net income: | | $ | 1,168 | | | $ | 0.31 | | | $ | 3,299 | | | $ | 0.87 | |
Weighted average number of common shares outstanding – diluted | | | 3,821 | | | | | | | | 3,809 | | | | | |
| (1) | The adjustments represent the amortization of intangible assets related to acquired assets and companies. |
| (2) | The adjustments represent stock-based compensation expense related to awards of stock options, restricted stock units, or common stock in exchange for services. Although we expect to continue to award stock in exchange for services, the amount of stock-based compensation is excluded as it is subject to change as a result of one-time or non-recurring projects. |
| (3) | For the three and six months ended June 30, 2024, this adjustment gives effect to a gain recorded on the change in fair value of our interest rate swap of $14,000 and $219,000, respectively, partially offset by one-time accounting fees, termination benefits and other non-recurring or unusual expenses, including acquisition and integration expenses of $94,000 and $194,000, respectively. For the three months ended June 30, 2023, this adjustment gives effect to a gain recorded on the change in fair value of our interest rate swap of $379,000, partially offset by one-time, non-recurring expenses, including acquisition and/or integration expenses of $182,000. For the six months ended June 30, 2023, this adjustment gives effect to one-time, non-recurring expenses, including acquisition and/or integration expenses of $371,000, $370,000 payment related to early extinguishment of our Seller Note and one-time non-recurring expenses of $45,000, partially offset by a gain recorded on the change in fair value of our interest rate swap of $214,000. |
| (4) | This adjustment gives effect to the tax impact of all non-GAAP adjustments at the current Federal tax rate of 21%. |
Outlook
The following statements are forward looking and are subject to factors that could cause actual results to differ materially from those suggested here, including, without limitation, demand for and acceptance of our services, new developments, competition and general economic or market conditions, particularly in the domestic and international capital markets. Refer also to the Cautionary Statement Concerning Forward Looking Statements included in this report.
Market factors like the current military conflicts in Ukraine and Israel, instability in global energy markets, global inflation and the increase of interest rates have contributed to significant global economic and political uncertainty, disrupted global trade and supply chains, adversely impacted many industries, and contributed to significant volatility in financial markets. Overall, despite many uncertainties in the market regarding the economic and political outlook, we believe the demand for our platforms and services is stable in a majority of the markets we serve. The historical success of our Communications offering has been led by our ACCESSWIRE branded newswire, which is now complemented by the Newswire business.
We believe there is demand for our products around the world, led by our ACCESSWIRE and Newswire brands, as companies seek to find better platforms and tools to disseminate and communicate their messages in a more efficient and collaborative way. However, under current accounting standards, in the event our stock price continues to decline, or we do not see stable to increased demand for our combined newswire business through 2024 and beyond, it may be possible we will be required to write down goodwill and/or intangible assets, specifically related to the Newswire acquisition, if we determine the assets have been impaired. If a write-down of goodwill and/or intangible assets were to occur, it would likely have a short-term material negative effect on our consolidated financial statements.
We believe the continued transition to a platform subscription model has been and will continue to be key for our long-term sustainable growth. We will also continue to focus on the following key strategic initiatives during 2024:
| · | Expanding our Communications products and adapting to this changing industry, |
| · | Evaluating acquisitions in areas of strategic focus, |
| · | Aligning our sales and marketing teams to be entirely focused on our Communications offerings, |
| · | Expanding customer base, |
| · | Expanding our newswire distribution, |
| · | Investing in technology advancements and upgrades, |
| · | Generating profitable sustainable growth |
| · | Generating cash flows from operations. |
We have invested and will continue to invest in our product sets, platforms and intellectual property development via internal development and acquisitions. Acquisitions remain a core part of our strategy and we believe acquisitions are key to enhancing our overall offerings in the market and are necessary to keep our competitive advantages and facilitate the next round of growth that management believes it can achieve. If we are successful in this effort, we believe we can further increase our market share as we move forward.
Off-Balance Sheet Arrangements
We have no off-balance sheet arrangements that have or are reasonably likely to have a current or future effect on our financial condition, changes in financial condition, revenues or expenses, results of operations, liquidity, capital expenditures or capital resources that is material to stockholders.
ITEM 3. QUANTITATIVE AND QUALITATIVE DISCLOSURES ABOUT MARKET RISK.
Not applicable.
ITEM 4. CONTROLS AND PROCEDURES.
As of the end of the period covered by this quarterly report on Form10-Q, the Company’s Chief Executive Officer and Interim Chief Financial Officer conducted an evaluation of the Company’s disclosure controls and procedures (as defined in Rules 13a-15 and 15d-15 of the Securities Exchange Act of 1934). Based upon this evaluation, the Company’s Chief Executive Officer and Chief Financial Officer concluded that the Company’s disclosure controls and procedures are effective and have not materially changed since its most recent annual report except for the resignation of our former Chief Financial Officer, Timothy Pitoniak, effective March 8, 2024. Mr. Pitoniak was replaced by Steven Knerr as our Interim Chief Financial Officer effective March 8, 2024. Immediately prior to the appointment, Mr. Knerr was the Company’s Vice President of Finance and Controller. Mr. Knerr has served as the Company’s Controller from August 2013 until May 2015, its interim Chief Financial Officer from May 2015 until November 2015 and its Chief Financial Officer from November 2015 until January 2022, when he assumed the role of Vice President of Finance and Controller.
PART II – OTHER INFORMATION
ITEM 1. LEGAL PROCEEDINGS.
From time to time, we may be involved in litigation that arises through the normal course of business. As of the date of this filing, we are neither a party to any litigation nor are we aware of any such threatened or pending litigation which we believe might result in a material adverse effect to our business.
ITEM 1A. RISK FACTORS.
In addition to the other information set forth in this quarterly report, you should carefully consider the factors discussed in Part I, “Item 1A. Risk Factors” in our 2023 Annual Report on Form 10-K, which could materially affect our business, financial condition or future results. There have been no material changes during fiscal 2024 to the risk fctors that were included in the Form 10-K.
ITEM 2. UNREGISTERED SALES OF EQUITY SECURITIES AND USE OF PROCEEDS.
None.
ITEM 3. DEFAULTS UPON SENIOR SECURITIES.
None.
ITEM 4. MINE SAFETY DISCLOSURE.
Not applicable.
ITEM 5. OTHER INFORMATION.
None.
ITEM 6. EXHIBITS.
(a) Exhibits.
_______________________________
* | filed or furnished herewith |
** | submitted electronically herewith |
SIGNATURES
Pursuant to the requirements of the Securities Exchange Act of 1934, the registrant has duly caused this report to be signed on its behalf by the undersigned thereunto duly authorized.
Date: August 8, 2024
| ISSUER DIRECT CORPORATION | |
| | | |
| By: | /s/ Brian R. Balbirnie | |
| | Brian R. Balbirnie | |
| | Chief Executive Officer | |
| By: | /s/ Steven Knerr | |
| | Steven Knerr | |
| | Interim Chief Financial Officer | |
nullnullnullnull
v3.24.2.u1
| X |
- DefinitionBoolean flag that is true when the XBRL content amends previously-filed or accepted submission.
| Name: |
dei_AmendmentFlag |
| Namespace Prefix: |
dei_ |
| Data Type: |
xbrli:booleanItemType |
| Balance Type: |
na |
| Period Type: |
duration |
|
| X |
- DefinitionEnd date of current fiscal year in the format --MM-DD.
| Name: |
dei_CurrentFiscalYearEndDate |
| Namespace Prefix: |
dei_ |
| Data Type: |
xbrli:gMonthDayItemType |
| Balance Type: |
na |
| Period Type: |
duration |
|
| X |
- DefinitionFiscal period values are FY, Q1, Q2, and Q3. 1st, 2nd and 3rd quarter 10-Q or 10-QT statements have value Q1, Q2, and Q3 respectively, with 10-K, 10-KT or other fiscal year statements having FY.
| Name: |
dei_DocumentFiscalPeriodFocus |
| Namespace Prefix: |
dei_ |
| Data Type: |
dei:fiscalPeriodItemType |
| Balance Type: |
na |
| Period Type: |
duration |
|
| X |
- DefinitionThis is focus fiscal year of the document report in YYYY format. For a 2006 annual report, which may also provide financial information from prior periods, fiscal 2006 should be given as the fiscal year focus. Example: 2006.
| Name: |
dei_DocumentFiscalYearFocus |
| Namespace Prefix: |
dei_ |
| Data Type: |
xbrli:gYearItemType |
| Balance Type: |
na |
| Period Type: |
duration |
|
| X |
- DefinitionFor the EDGAR submission types of Form 8-K: the date of the report, the date of the earliest event reported; for the EDGAR submission types of Form N-1A: the filing date; for all other submission types: the end of the reporting or transition period. The format of the date is YYYY-MM-DD.
| Name: |
dei_DocumentPeriodEndDate |
| Namespace Prefix: |
dei_ |
| Data Type: |
xbrli:dateItemType |
| Balance Type: |
na |
| Period Type: |
duration |
|
| X |
- DefinitionBoolean flag that is true only for a form used as an quarterly report. Reference 1: http://www.xbrl.org/2003/role/presentationRef
-Publisher SEC
-Name Form 10-Q
-Number 240
-Section 308
-Subsection a
| Name: |
dei_DocumentQuarterlyReport |
| Namespace Prefix: |
dei_ |
| Data Type: |
xbrli:booleanItemType |
| Balance Type: |
na |
| Period Type: |
duration |
|
| X |
- DefinitionBoolean flag that is true only for a form used as a transition report. Reference 1: http://www.xbrl.org/2003/role/presentationRef
-Publisher SEC
-Name Forms 10-K, 10-Q, 20-F
-Number 240
-Section 13
-Subsection a-1
| Name: |
dei_DocumentTransitionReport |
| Namespace Prefix: |
dei_ |
| Data Type: |
xbrli:booleanItemType |
| Balance Type: |
na |
| Period Type: |
duration |
|
| X |
- DefinitionThe type of document being provided (such as 10-K, 10-Q, 485BPOS, etc). The document type is limited to the same value as the supporting SEC submission type, or the word 'Other'.
| Name: |
dei_DocumentType |
| Namespace Prefix: |
dei_ |
| Data Type: |
dei:submissionTypeItemType |
| Balance Type: |
na |
| Period Type: |
duration |
|
| X |
- DefinitionAddress Line 1 such as Attn, Building Name, Street Name
| Name: |
dei_EntityAddressAddressLine1 |
| Namespace Prefix: |
dei_ |
| Data Type: |
xbrli:normalizedStringItemType |
| Balance Type: |
na |
| Period Type: |
duration |
|
| X |
- DefinitionAddress Line 2 such as Street or Suite number
| Name: |
dei_EntityAddressAddressLine2 |
| Namespace Prefix: |
dei_ |
| Data Type: |
xbrli:normalizedStringItemType |
| Balance Type: |
na |
| Period Type: |
duration |
|
| X |
- Definition
+ References
+ Details
| Name: |
dei_EntityAddressCityOrTown |
| Namespace Prefix: |
dei_ |
| Data Type: |
xbrli:normalizedStringItemType |
| Balance Type: |
na |
| Period Type: |
duration |
|
| X |
- DefinitionCode for the postal or zip code
| Name: |
dei_EntityAddressPostalZipCode |
| Namespace Prefix: |
dei_ |
| Data Type: |
xbrli:normalizedStringItemType |
| Balance Type: |
na |
| Period Type: |
duration |
|
| X |
- DefinitionName of the state or province.
| Name: |
dei_EntityAddressStateOrProvince |
| Namespace Prefix: |
dei_ |
| Data Type: |
dei:stateOrProvinceItemType |
| Balance Type: |
na |
| Period Type: |
duration |
|
| X |
- DefinitionA unique 10-digit SEC-issued value to identify entities that have filed disclosures with the SEC. It is commonly abbreviated as CIK. Reference 1: http://www.xbrl.org/2003/role/presentationRef
-Publisher SEC
-Name Exchange Act
-Number 240
-Section 12
-Subsection b-2
| Name: |
dei_EntityCentralIndexKey |
| Namespace Prefix: |
dei_ |
| Data Type: |
dei:centralIndexKeyItemType |
| Balance Type: |
na |
| Period Type: |
duration |
|
| X |
- DefinitionIndicate number of shares or other units outstanding of each of registrant's classes of capital or common stock or other ownership interests, if and as stated on cover of related periodic report. Where multiple classes or units exist define each class/interest by adding class of stock items such as Common Class A [Member], Common Class B [Member] or Partnership Interest [Member] onto the Instrument [Domain] of the Entity Listings, Instrument.
| Name: |
dei_EntityCommonStockSharesOutstanding |
| Namespace Prefix: |
dei_ |
| Data Type: |
xbrli:sharesItemType |
| Balance Type: |
na |
| Period Type: |
instant |
|
| X |
- DefinitionIndicate 'Yes' or 'No' whether registrants (1) have filed all reports required to be filed by Section 13 or 15(d) of the Securities Exchange Act of 1934 during the preceding 12 months (or for such shorter period that registrants were required to file such reports), and (2) have been subject to such filing requirements for the past 90 days. This information should be based on the registrant's current or most recent filing containing the related disclosure.
| Name: |
dei_EntityCurrentReportingStatus |
| Namespace Prefix: |
dei_ |
| Data Type: |
dei:yesNoItemType |
| Balance Type: |
na |
| Period Type: |
duration |
|
| X |
- DefinitionIndicate if registrant meets the emerging growth company criteria. Reference 1: http://www.xbrl.org/2003/role/presentationRef
-Publisher SEC
-Name Exchange Act
-Number 240
-Section 12
-Subsection b-2
| Name: |
dei_EntityEmergingGrowthCompany |
| Namespace Prefix: |
dei_ |
| Data Type: |
xbrli:booleanItemType |
| Balance Type: |
na |
| Period Type: |
duration |
|
| X |
- DefinitionCommission file number. The field allows up to 17 characters. The prefix may contain 1-3 digits, the sequence number may contain 1-8 digits, the optional suffix may contain 1-4 characters, and the fields are separated with a hyphen.
| Name: |
dei_EntityFileNumber |
| Namespace Prefix: |
dei_ |
| Data Type: |
dei:fileNumberItemType |
| Balance Type: |
na |
| Period Type: |
duration |
|
| X |
- DefinitionIndicate whether the registrant is one of the following: Large Accelerated Filer, Accelerated Filer, Non-accelerated Filer. Definitions of these categories are stated in Rule 12b-2 of the Exchange Act. This information should be based on the registrant's current or most recent filing containing the related disclosure. Reference 1: http://www.xbrl.org/2003/role/presentationRef
-Publisher SEC
-Name Exchange Act
-Number 240
-Section 12
-Subsection b-2
| Name: |
dei_EntityFilerCategory |
| Namespace Prefix: |
dei_ |
| Data Type: |
dei:filerCategoryItemType |
| Balance Type: |
na |
| Period Type: |
duration |
|
| X |
- DefinitionTwo-character EDGAR code representing the state or country of incorporation.
| Name: |
dei_EntityIncorporationStateCountryCode |
| Namespace Prefix: |
dei_ |
| Data Type: |
dei:edgarStateCountryItemType |
| Balance Type: |
na |
| Period Type: |
duration |
|
| X |
- DefinitionBoolean flag that is true when the registrant has submitted electronically every Interactive Data File required to be submitted pursuant to Rule 405 of Regulation S-T during the preceding 12 months (or for such shorter period that the registrant was required to submit such files). Reference 1: http://www.xbrl.org/2003/role/presentationRef
-Publisher SEC
-Name Regulation S-T
-Number 232
-Section 405
| Name: |
dei_EntityInteractiveDataCurrent |
| Namespace Prefix: |
dei_ |
| Data Type: |
dei:yesNoItemType |
| Balance Type: |
na |
| Period Type: |
duration |
|
| X |
- DefinitionThe exact name of the entity filing the report as specified in its charter, which is required by forms filed with the SEC. Reference 1: http://www.xbrl.org/2003/role/presentationRef
-Publisher SEC
-Name Exchange Act
-Number 240
-Section 12
-Subsection b-2
| Name: |
dei_EntityRegistrantName |
| Namespace Prefix: |
dei_ |
| Data Type: |
xbrli:normalizedStringItemType |
| Balance Type: |
na |
| Period Type: |
duration |
|
| X |
- DefinitionBoolean flag that is true when the registrant is a shell company as defined in Rule 12b-2 of the Exchange Act. Reference 1: http://www.xbrl.org/2003/role/presentationRef
-Publisher SEC
-Name Exchange Act
-Number 240
-Section 12
-Subsection b-2
| Name: |
dei_EntityShellCompany |
| Namespace Prefix: |
dei_ |
| Data Type: |
xbrli:booleanItemType |
| Balance Type: |
na |
| Period Type: |
duration |
|
| X |
- DefinitionIndicates that the company is a Smaller Reporting Company (SRC). Reference 1: http://www.xbrl.org/2003/role/presentationRef
-Publisher SEC
-Name Exchange Act
-Number 240
-Section 12
-Subsection b-2
| Name: |
dei_EntitySmallBusiness |
| Namespace Prefix: |
dei_ |
| Data Type: |
xbrli:booleanItemType |
| Balance Type: |
na |
| Period Type: |
duration |
|
| X |
- DefinitionThe Tax Identification Number (TIN), also known as an Employer Identification Number (EIN), is a unique 9-digit value assigned by the IRS. Reference 1: http://www.xbrl.org/2003/role/presentationRef
-Publisher SEC
-Name Exchange Act
-Number 240
-Section 12
-Subsection b-2
| Name: |
dei_EntityTaxIdentificationNumber |
| Namespace Prefix: |
dei_ |
| Data Type: |
dei:employerIdItemType |
| Balance Type: |
na |
| Period Type: |
duration |
|
| X |
- DefinitionLocal phone number for entity.
| Name: |
dei_LocalPhoneNumber |
| Namespace Prefix: |
dei_ |
| Data Type: |
xbrli:normalizedStringItemType |
| Balance Type: |
na |
| Period Type: |
duration |
|
| X |
- DefinitionTitle of a 12(b) registered security. Reference 1: http://www.xbrl.org/2003/role/presentationRef
-Publisher SEC
-Name Exchange Act
-Number 240
-Section 12
-Subsection b
| Name: |
dei_Security12bTitle |
| Namespace Prefix: |
dei_ |
| Data Type: |
dei:securityTitleItemType |
| Balance Type: |
na |
| Period Type: |
duration |
|
| X |
- DefinitionName of the Exchange on which a security is registered. Reference 1: http://www.xbrl.org/2003/role/presentationRef
-Publisher SEC
-Name Exchange Act
-Number 240
-Section 12
-Subsection d1-1
| Name: |
dei_SecurityExchangeName |
| Namespace Prefix: |
dei_ |
| Data Type: |
dei:edgarExchangeCodeItemType |
| Balance Type: |
na |
| Period Type: |
duration |
|
| X |
- DefinitionTrading symbol of an instrument as listed on an exchange.
| Name: |
dei_TradingSymbol |
| Namespace Prefix: |
dei_ |
| Data Type: |
dei:tradingSymbolItemType |
| Balance Type: |
na |
| Period Type: |
duration |
|
v3.24.2.u1
CONSOLIDATED BALANCE SHEETS - USD ($)
|
Jun. 30, 2024 |
Dec. 31, 2023 |
| Current assets: |
|
|
| Cash and cash equivalents |
$ 4,020,000
|
$ 5,714,000
|
| Accounts receivable (net of allowance for doubtful accounts of $1,156 and $1,119, respectively |
4,686,000
|
4,368,000
|
| Income tax receivable |
202,000
|
232,000
|
| Other current assets |
1,331,000
|
1,190,000
|
| Total current assets |
10,239,000
|
11,504,000
|
| Capitalized software (net of accumulated amortization of $3,524 and $3,424, respectively) |
856,000
|
556,000
|
| Fixed assets (net of accumulated depreciation of $841 and $765, respectively) |
435,000
|
495,000
|
| Right-of-use asset - leases |
894,000
|
1,022,000
|
| Other long-term assets |
344,000
|
158,000
|
| Goodwill |
21,927,000
|
21,927,000
|
| Intangible assets (net of accumulated amortization of $10,926 and $9,562, respectively) |
28,126,000
|
29,490,000
|
| Total assets |
62,821,000
|
65,152,000
|
| Current liabilities: |
|
|
| Accounts payable |
1,077,000
|
1,308,000
|
| Accrued expenses |
1,983,000
|
1,919,000
|
| Income taxes payable |
23,000
|
11,000
|
| Current portion of long-term debt |
4,000,000
|
4,000,000
|
| Deferred revenue |
5,476,000
|
5,412,000
|
| Total current liabilities |
12,559,000
|
12,650,000
|
| Long-term debt (net of debt discount of $78 and $87, respectively) |
13,922,000
|
15,913,000
|
| Deferred income tax liability |
59,000
|
139,000
|
| Lease liabilities - long-term |
840,000
|
1,009,000
|
| Other long-term liabilities |
0
|
21,000
|
| Total liabilities |
27,380,000
|
29,732,000
|
| Stockholders' equity: |
|
|
| Preferred stock, $0.001 par value, 1,000,000 shares authorized, no shares issued and outstanding as of June 30, 2024 and December 31, 2023, respectively. |
0
|
0
|
| Common stock $0.001 par value, 20,000,000 shares authorized, 3,831,711 and 3,815,212 shares issued and outstanding as of June 30, 2024 and December 31, 2023, respectively. |
4,000
|
4,000
|
| Additional paid-in capital |
23,731,000
|
23,531,000
|
| Other accumulated comprehensive loss |
(96,000)
|
(49,000)
|
| Retained earnings |
11,802,000
|
11,934,000
|
| Total stockholders' equity |
35,441,000
|
35,420,000
|
| Total liabilities and stockholders' equity |
$ 62,821,000
|
$ 65,152,000
|
| X |
- DefinitionCarrying value as of the balance sheet date of liabilities incurred (and for which invoices have typically been received) and payable to vendors for goods and services received that are used in an entity's business. Used to reflect the current portion of the liabilities (due within one year or within the normal operating cycle if longer). Reference 1: http://fasb.org/us-gaap/role/ref/legacyRef
-Topic 210
-SubTopic 10
-Name Accounting Standards Codification
-Section S99
-Paragraph 1
-Subparagraph (SX 210.5-02(19)(a))
-Publisher FASB
-URI https://asc.fasb.org/1943274/2147480566/210-10-S99-1
Reference 2: http://www.xbrl.org/2003/role/exampleRef
-Topic 852
-SubTopic 10
-Name Accounting Standards Codification
-Section 55
-Paragraph 10
-Publisher FASB
-URI https://asc.fasb.org/1943274/2147481372/852-10-55-10
| Name: |
us-gaap_AccountsPayableCurrent |
| Namespace Prefix: |
us-gaap_ |
| Data Type: |
xbrli:monetaryItemType |
| Balance Type: |
credit |
| Period Type: |
instant |
|
| X |
- DefinitionAmount, after allowance for credit loss, of right to consideration from customer for product sold and service rendered in normal course of business, classified as current. Reference 1: http://www.xbrl.org/2009/role/commonPracticeRef
-Topic 310
-SubTopic 10
-Name Accounting Standards Codification
-Section 45
-Paragraph 2
-Publisher FASB
-URI https://asc.fasb.org/1943274/2147481990/310-10-45-2
| Name: |
us-gaap_AccountsReceivableNetCurrent |
| Namespace Prefix: |
us-gaap_ |
| Data Type: |
xbrli:monetaryItemType |
| Balance Type: |
debit |
| Period Type: |
instant |
|
| X |
- DefinitionCarrying value as of the balance sheet date of obligations incurred and payable, pertaining to costs that are statutory in nature, are incurred on contractual obligations, or accumulate over time and for which invoices have not yet been received or will not be rendered. Examples include taxes, interest, rent and utilities. Used to reflect the current portion of the liabilities (due within one year or within the normal operating cycle if longer). Reference 1: http://fasb.org/us-gaap/role/ref/legacyRef
-Topic 210
-SubTopic 10
-Name Accounting Standards Codification
-Section S99
-Paragraph 1
-Subparagraph (SX 210.5-02(20))
-Publisher FASB
-URI https://asc.fasb.org/1943274/2147480566/210-10-S99-1
| Name: |
us-gaap_AccruedLiabilitiesCurrent |
| Namespace Prefix: |
us-gaap_ |
| Data Type: |
xbrli:monetaryItemType |
| Balance Type: |
credit |
| Period Type: |
instant |
|
| X |
- DefinitionAmount, after tax, of accumulated increase (decrease) in equity from transaction and other event and circumstance from nonowner source. Reference 1: http://fasb.org/us-gaap/role/ref/legacyRef
-Name Accounting Standards Codification
-Topic 220
-SubTopic 10
-Section 45
-Paragraph 14A
-Publisher FASB
-URI https://asc.fasb.org/1943274/2147482790/220-10-45-14A
Reference 2: http://fasb.org/us-gaap/role/ref/legacyRef
-Topic 220
-SubTopic 10
-Name Accounting Standards Codification
-Section 45
-Paragraph 11
-Publisher FASB
-URI https://asc.fasb.org/1943274/2147482790/220-10-45-11
Reference 3: http://www.xbrl.org/2003/role/disclosureRef
-Topic 944
-SubTopic 40
-Name Accounting Standards Codification
-Section 65
-Paragraph 2
-Subparagraph (g)(2)(ii)
-Publisher FASB
-URI https://asc.fasb.org/1943274/2147480016/944-40-65-2
Reference 4: http://www.xbrl.org/2003/role/disclosureRef
-Topic 944
-SubTopic 40
-Name Accounting Standards Codification
-Section 65
-Paragraph 2
-Subparagraph (h)(2)
-Publisher FASB
-URI https://asc.fasb.org/1943274/2147480016/944-40-65-2
Reference 5: http://www.xbrl.org/2003/role/disclosureRef
-Topic 210
-SubTopic 10
-Name Accounting Standards Codification
-Section S99
-Paragraph 1
-Subparagraph (SX 210.5-02(30)(a)(4))
-Publisher FASB
-URI https://asc.fasb.org/1943274/2147480566/210-10-S99-1
Reference 6: http://www.xbrl.org/2003/role/disclosureRef
-Topic 944
-SubTopic 210
-Name Accounting Standards Codification
-Section S99
-Paragraph 1
-Subparagraph (SX 210.7-03(a)(23)(a)(3))
-Publisher FASB
-URI https://asc.fasb.org/1943274/2147478777/944-210-S99-1
Reference 7: http://fasb.org/us-gaap/role/ref/legacyRef
-Name Accounting Standards Codification
-Topic 220
-SubTopic 10
-Section 45
-Paragraph 14
-Publisher FASB
-URI https://asc.fasb.org/1943274/2147482790/220-10-45-14
| Name: |
us-gaap_AccumulatedOtherComprehensiveIncomeLossNetOfTax |
| Namespace Prefix: |
us-gaap_ |
| Data Type: |
xbrli:monetaryItemType |
| Balance Type: |
credit |
| Period Type: |
instant |
|
| X |
- DefinitionAmount of excess of issue price over par or stated value of stock and from other transaction involving stock or stockholder. Includes, but is not limited to, additional paid-in capital (APIC) for common and preferred stock. Reference 1: http://www.xbrl.org/2003/role/exampleRef
-Topic 852
-SubTopic 10
-Name Accounting Standards Codification
-Section 55
-Paragraph 10
-Publisher FASB
-URI https://asc.fasb.org/1943274/2147481372/852-10-55-10
Reference 2: http://www.xbrl.org/2009/role/commonPracticeRef
-Topic 946
-SubTopic 210
-Name Accounting Standards Codification
-Section S99
-Paragraph 1
-Subparagraph (SX 210.6-04(18))
-Publisher FASB
-URI https://asc.fasb.org/1943274/2147479170/946-210-S99-1
Reference 3: http://fasb.org/us-gaap/role/ref/legacyRef
-Topic 210
-SubTopic 10
-Name Accounting Standards Codification
-Section S99
-Paragraph 1
-Subparagraph (SX 210.5-02(30)(a)(1))
-Publisher FASB
-URI https://asc.fasb.org/1943274/2147480566/210-10-S99-1
| Name: |
us-gaap_AdditionalPaidInCapital |
| Namespace Prefix: |
us-gaap_ |
| Data Type: |
xbrli:monetaryItemType |
| Balance Type: |
credit |
| Period Type: |
instant |
|
| X |
- DefinitionAmount of asset recognized for present right to economic benefit. Reference 1: http://www.xbrl.org/2003/role/exampleRef
-Topic 280
-SubTopic 10
-Name Accounting Standards Codification
-Section 55
-Paragraph 48
-Publisher FASB
-URI https://asc.fasb.org/1943274/2147482785/280-10-55-48
Reference 2: http://www.xbrl.org/2003/role/exampleRef
-Topic 280
-SubTopic 10
-Name Accounting Standards Codification
-Section 55
-Paragraph 49
-Publisher FASB
-URI https://asc.fasb.org/1943274/2147482785/280-10-55-49
Reference 3: http://www.xbrl.org/2003/role/disclosureRef
-Topic 270
-SubTopic 10
-Name Accounting Standards Codification
-Section 50
-Paragraph 1
-Subparagraph (i)
-Publisher FASB
-URI https://asc.fasb.org/1943274/2147482964/270-10-50-1
Reference 4: http://www.xbrl.org/2003/role/disclosureRef
-Topic 280
-SubTopic 10
-Name Accounting Standards Codification
-Section 50
-Paragraph 32
-Subparagraph (ee)
-Publisher FASB
-URI https://asc.fasb.org/1943274/2147482810/280-10-50-32
Reference 5: http://fasb.org/us-gaap/role/ref/otherTransitionRef
-Topic 280
-SubTopic 10
-Name Accounting Standards Codification
-Section 50
-Paragraph 32
-Subparagraph (d)
-Publisher FASB
-URI https://asc.fasb.org/1943274/2147482810/280-10-50-32
Reference 6: http://www.xbrl.org/2003/role/disclosureRef
-Topic 280
-SubTopic 10
-Name Accounting Standards Codification
-Section 50
-Paragraph 22
-Publisher FASB
-URI https://asc.fasb.org/1943274/2147482810/280-10-50-22
Reference 7: http://www.xbrl.org/2003/role/disclosureRef
-Topic 810
-SubTopic 10
-Name Accounting Standards Codification
-Section 50
-Paragraph 3
-Subparagraph (bb)
-Publisher FASB
-URI https://asc.fasb.org/1943274/2147481203/810-10-50-3
Reference 8: http://www.xbrl.org/2003/role/disclosureRef
-Topic 810
-SubTopic 10
-Name Accounting Standards Codification
-Section 45
-Paragraph 25
-Subparagraph (a)
-Publisher FASB
-URI https://asc.fasb.org/1943274/2147481231/810-10-45-25
Reference 9: http://www.xbrl.org/2003/role/disclosureRef
-Topic 235
-SubTopic 10
-Name Accounting Standards Codification
-Section S99
-Paragraph 1
-Subparagraph (SX 210.4-08(g)(1)(ii))
-Publisher FASB
-URI https://asc.fasb.org/1943274/2147480678/235-10-S99-1
Reference 10: http://www.xbrl.org/2003/role/disclosureRef
-Topic 323
-SubTopic 10
-Name Accounting Standards Codification
-Section 50
-Paragraph 3
-Subparagraph (c)
-Publisher FASB
-URI https://asc.fasb.org/1943274/2147481687/323-10-50-3
Reference 11: http://www.xbrl.org/2003/role/disclosureRef
-Topic 825
-SubTopic 10
-Name Accounting Standards Codification
-Section 50
-Paragraph 28
-Subparagraph (f)
-Publisher FASB
-URI https://asc.fasb.org/1943274/2147482907/825-10-50-28
Reference 12: http://www.xbrl.org/2003/role/exampleRef
-Topic 852
-SubTopic 10
-Name Accounting Standards Codification
-Section 55
-Paragraph 10
-Publisher FASB
-URI https://asc.fasb.org/1943274/2147481372/852-10-55-10
Reference 13: http://www.xbrl.org/2003/role/exampleRef
-Topic 946
-SubTopic 830
-Name Accounting Standards Codification
-Section 55
-Paragraph 12
-Publisher FASB
-URI https://asc.fasb.org/1943274/2147479168/946-830-55-12
Reference 14: http://www.xbrl.org/2003/role/disclosureRef
-Topic 944
-SubTopic 210
-Name Accounting Standards Codification
-Section S99
-Paragraph 1
-Subparagraph (SX 210.7-03(a)(12))
-Publisher FASB
-URI https://asc.fasb.org/1943274/2147478777/944-210-S99-1
Reference 15: http://www.xbrl.org/2003/role/disclosureRef
-Topic 946
-SubTopic 210
-Name Accounting Standards Codification
-Section S99
-Paragraph 1
-Subparagraph (SX 210.6-04(8))
-Publisher FASB
-URI https://asc.fasb.org/1943274/2147479170/946-210-S99-1
Reference 16: http://www.xbrl.org/2003/role/disclosureRef
-Topic 210
-SubTopic 10
-Name Accounting Standards Codification
-Section S99
-Paragraph 1
-Subparagraph (SX 210.5-02(18))
-Publisher FASB
-URI https://asc.fasb.org/1943274/2147480566/210-10-S99-1
Reference 17: http://www.xbrl.org/2003/role/disclosureRef
-Topic 470
-SubTopic 10
-Name Accounting Standards Codification
-Section S99
-Paragraph 1A
-Subparagraph (SX 210.13-01(a)(4)(i))
-Publisher FASB
-URI https://asc.fasb.org/1943274/2147480097/470-10-S99-1A
Reference 18: http://www.xbrl.org/2009/role/commonPracticeRef
-Topic 470
-SubTopic 10
-Name Accounting Standards Codification
-Section S99
-Paragraph 1A
-Subparagraph (SX 210.13-01(a)(4)(ii))
-Publisher FASB
-URI https://asc.fasb.org/1943274/2147480097/470-10-S99-1A
Reference 19: http://www.xbrl.org/2009/role/commonPracticeRef
-Topic 470
-SubTopic 10
-Name Accounting Standards Codification
-Section S99
-Paragraph 1A
-Subparagraph (SX 210.13-01(a)(4)(iii))
-Publisher FASB
-URI https://asc.fasb.org/1943274/2147480097/470-10-S99-1A
Reference 20: http://www.xbrl.org/2003/role/disclosureRef
-Topic 470
-SubTopic 10
-Name Accounting Standards Codification
-Section S99
-Paragraph 1A
-Subparagraph (SX 210.13-01(a)(4)(iii)(A))
-Publisher FASB
-URI https://asc.fasb.org/1943274/2147480097/470-10-S99-1A
Reference 21: http://www.xbrl.org/2003/role/disclosureRef
-Topic 470
-SubTopic 10
-Name Accounting Standards Codification
-Section S99
-Paragraph 1A
-Subparagraph (SX 210.13-01(a)(4)(iv))
-Publisher FASB
-URI https://asc.fasb.org/1943274/2147480097/470-10-S99-1A
Reference 22: http://www.xbrl.org/2003/role/disclosureRef
-Topic 470
-SubTopic 10
-Name Accounting Standards Codification
-Section S99
-Paragraph 1A
-Subparagraph (SX 210.13-01(a)(5))
-Publisher FASB
-URI https://asc.fasb.org/1943274/2147480097/470-10-S99-1A
Reference 23: http://www.xbrl.org/2003/role/disclosureRef
-Topic 470
-SubTopic 10
-Name Accounting Standards Codification
-Section S99
-Paragraph 1B
-Subparagraph (SX 210.13-02(a)(4)(i))
-Publisher FASB
-URI https://asc.fasb.org/1943274/2147480097/470-10-S99-1B
Reference 24: http://www.xbrl.org/2003/role/disclosureRef
-Topic 470
-SubTopic 10
-Name Accounting Standards Codification
-Section S99
-Paragraph 1B
-Subparagraph (SX 210.13-02(a)(4)(iii)(A))
-Publisher FASB
-URI https://asc.fasb.org/1943274/2147480097/470-10-S99-1B
Reference 25: http://www.xbrl.org/2003/role/disclosureRef
-Topic 470
-SubTopic 10
-Name Accounting Standards Codification
-Section S99
-Paragraph 1B
-Subparagraph (SX 210.13-02(a)(4)(iii)(B))
-Publisher FASB
-URI https://asc.fasb.org/1943274/2147480097/470-10-S99-1B
Reference 26: http://www.xbrl.org/2003/role/disclosureRef
-Topic 470
-SubTopic 10
-Name Accounting Standards Codification
-Section S99
-Paragraph 1B
-Subparagraph (SX 210.13-02(a)(4)(iv))
-Publisher FASB
-URI https://asc.fasb.org/1943274/2147480097/470-10-S99-1B
Reference 27: http://www.xbrl.org/2003/role/disclosureRef
-Topic 470
-SubTopic 10
-Name Accounting Standards Codification
-Section S99
-Paragraph 1B
-Subparagraph (SX 210.13-02(a)(5))
-Publisher FASB
-URI https://asc.fasb.org/1943274/2147480097/470-10-S99-1B
Reference 28: http://www.xbrl.org/2009/role/commonPracticeRef
-Topic 852
-SubTopic 10
-Name Accounting Standards Codification
-Section 50
-Paragraph 7
-Subparagraph (a)
-Publisher FASB
-URI https://asc.fasb.org/1943274/2147481404/852-10-50-7
Reference 29: http://www.xbrl.org/2003/role/disclosureRef
-Topic 280
-SubTopic 10
-Name Accounting Standards Codification
-Section 50
-Paragraph 30
-Subparagraph (c)
-Publisher FASB
-URI https://asc.fasb.org/1943274/2147482810/280-10-50-30
Reference 30: http://fasb.org/us-gaap/role/ref/legacyRef
-Topic 942
-SubTopic 210
-Name Accounting Standards Codification
-Section S99
-Paragraph 1
-Subparagraph (SX 210.9-03(11))
-Publisher FASB
-URI https://asc.fasb.org/1943274/2147478546/942-210-S99-1
| Name: |
us-gaap_Assets |
| Namespace Prefix: |
us-gaap_ |
| Data Type: |
xbrli:monetaryItemType |
| Balance Type: |
debit |
| Period Type: |
instant |
|
| X |
- DefinitionAmount of asset recognized for present right to economic benefit, classified as current. Reference 1: http://www.xbrl.org/2003/role/disclosureRef
-Topic 810
-SubTopic 10
-Name Accounting Standards Codification
-Section 50
-Paragraph 3
-Subparagraph (bb)
-Publisher FASB
-URI https://asc.fasb.org/1943274/2147481203/810-10-50-3
Reference 2: http://www.xbrl.org/2003/role/disclosureRef
-Topic 810
-SubTopic 10
-Name Accounting Standards Codification
-Section 45
-Paragraph 25
-Subparagraph (a)
-Publisher FASB
-URI https://asc.fasb.org/1943274/2147481231/810-10-45-25
Reference 3: http://www.xbrl.org/2003/role/disclosureRef
-Topic 235
-SubTopic 10
-Name Accounting Standards Codification
-Section S99
-Paragraph 1
-Subparagraph (SX 210.4-08(g)(1)(ii))
-Publisher FASB
-URI https://asc.fasb.org/1943274/2147480678/235-10-S99-1
Reference 4: http://www.xbrl.org/2003/role/disclosureRef
-Topic 323
-SubTopic 10
-Name Accounting Standards Codification
-Section 50
-Paragraph 3
-Subparagraph (c)
-Publisher FASB
-URI https://asc.fasb.org/1943274/2147481687/323-10-50-3
Reference 5: http://www.xbrl.org/2003/role/disclosureRef
-Topic 825
-SubTopic 10
-Name Accounting Standards Codification
-Section 50
-Paragraph 28
-Subparagraph (f)
-Publisher FASB
-URI https://asc.fasb.org/1943274/2147482907/825-10-50-28
Reference 6: http://www.xbrl.org/2003/role/exampleRef
-Topic 852
-SubTopic 10
-Name Accounting Standards Codification
-Section 55
-Paragraph 10
-Publisher FASB
-URI https://asc.fasb.org/1943274/2147481372/852-10-55-10
Reference 7: http://www.xbrl.org/2003/role/disclosureRef
-Topic 210
-SubTopic 10
-Name Accounting Standards Codification
-Section 45
-Paragraph 1
-Publisher FASB
-URI https://asc.fasb.org/1943274/2147483467/210-10-45-1
Reference 8: http://www.xbrl.org/2003/role/disclosureRef
-Topic 210
-SubTopic 10
-Name Accounting Standards Codification
-Section S99
-Paragraph 1
-Subparagraph (SX 210.5-02(9))
-Publisher FASB
-URI https://asc.fasb.org/1943274/2147480566/210-10-S99-1
Reference 9: http://www.xbrl.org/2003/role/disclosureRef
-Topic 470
-SubTopic 10
-Name Accounting Standards Codification
-Section S99
-Paragraph 1A
-Subparagraph (SX 210.13-01(a)(4)(i))
-Publisher FASB
-URI https://asc.fasb.org/1943274/2147480097/470-10-S99-1A
Reference 10: http://www.xbrl.org/2009/role/commonPracticeRef
-Topic 470
-SubTopic 10
-Name Accounting Standards Codification
-Section S99
-Paragraph 1A
-Subparagraph (SX 210.13-01(a)(4)(ii))
-Publisher FASB
-URI https://asc.fasb.org/1943274/2147480097/470-10-S99-1A
Reference 11: http://www.xbrl.org/2009/role/commonPracticeRef
-Topic 470
-SubTopic 10
-Name Accounting Standards Codification
-Section S99
-Paragraph 1A
-Subparagraph (SX 210.13-01(a)(4)(iii))
-Publisher FASB
-URI https://asc.fasb.org/1943274/2147480097/470-10-S99-1A
Reference 12: http://www.xbrl.org/2003/role/disclosureRef
-Topic 470
-SubTopic 10
-Name Accounting Standards Codification
-Section S99
-Paragraph 1A
-Subparagraph (SX 210.13-01(a)(4)(iii)(A))
-Publisher FASB
-URI https://asc.fasb.org/1943274/2147480097/470-10-S99-1A
Reference 13: http://www.xbrl.org/2003/role/disclosureRef
-Topic 470
-SubTopic 10
-Name Accounting Standards Codification
-Section S99
-Paragraph 1A
-Subparagraph (SX 210.13-01(a)(4)(iv))
-Publisher FASB
-URI https://asc.fasb.org/1943274/2147480097/470-10-S99-1A
Reference 14: http://www.xbrl.org/2003/role/disclosureRef
-Topic 470
-SubTopic 10
-Name Accounting Standards Codification
-Section S99
-Paragraph 1A
-Subparagraph (SX 210.13-01(a)(5))
-Publisher FASB
-URI https://asc.fasb.org/1943274/2147480097/470-10-S99-1A
Reference 15: http://www.xbrl.org/2003/role/disclosureRef
-Topic 470
-SubTopic 10
-Name Accounting Standards Codification
-Section S99
-Paragraph 1B
-Subparagraph (SX 210.13-02(a)(4)(i))
-Publisher FASB
-URI https://asc.fasb.org/1943274/2147480097/470-10-S99-1B
Reference 16: http://www.xbrl.org/2003/role/disclosureRef
-Topic 470
-SubTopic 10
-Name Accounting Standards Codification
-Section S99
-Paragraph 1B
-Subparagraph (SX 210.13-02(a)(4)(iii)(A))
-Publisher FASB
-URI https://asc.fasb.org/1943274/2147480097/470-10-S99-1B
Reference 17: http://www.xbrl.org/2003/role/disclosureRef
-Topic 470
-SubTopic 10
-Name Accounting Standards Codification
-Section S99
-Paragraph 1B
-Subparagraph (SX 210.13-02(a)(4)(iii)(B))
-Publisher FASB
-URI https://asc.fasb.org/1943274/2147480097/470-10-S99-1B
Reference 18: http://www.xbrl.org/2003/role/disclosureRef
-Topic 470
-SubTopic 10
-Name Accounting Standards Codification
-Section S99
-Paragraph 1B
-Subparagraph (SX 210.13-02(a)(4)(iv))
-Publisher FASB
-URI https://asc.fasb.org/1943274/2147480097/470-10-S99-1B
Reference 19: http://www.xbrl.org/2003/role/disclosureRef
-Topic 470
-SubTopic 10
-Name Accounting Standards Codification
-Section S99
-Paragraph 1B
-Subparagraph (SX 210.13-02(a)(5))
-Publisher FASB
-URI https://asc.fasb.org/1943274/2147480097/470-10-S99-1B
Reference 20: http://www.xbrl.org/2009/role/commonPracticeRef
-Topic 852
-SubTopic 10
-Name Accounting Standards Codification
-Section 50
-Paragraph 7
-Subparagraph (a)
-Publisher FASB
-URI https://asc.fasb.org/1943274/2147481404/852-10-50-7
| Name: |
us-gaap_AssetsCurrent |
| Namespace Prefix: |
us-gaap_ |
| Data Type: |
xbrli:monetaryItemType |
| Balance Type: |
debit |
| Period Type: |
instant |
|
| X |
- References
+ Details
| Name: |
us-gaap_AssetsCurrentAbstract |
| Namespace Prefix: |
us-gaap_ |
| Data Type: |
xbrli:stringItemType |
| Balance Type: |
na |
| Period Type: |
duration |
|
| X |
- DefinitionThe carrying amount of capitalized computer software costs net of accumulated amortization as of the balance sheet date. Reference 1: http://www.xbrl.org/2003/role/disclosureRef
-Topic 985
-SubTopic 20
-Name Accounting Standards Codification
-Section 50
-Paragraph 1
-Subparagraph (a)
-Publisher FASB
-URI https://asc.fasb.org/1943274/2147481283/985-20-50-1
| Name: |
us-gaap_CapitalizedComputerSoftwareNet |
| Namespace Prefix: |
us-gaap_ |
| Data Type: |
xbrli:monetaryItemType |
| Balance Type: |
debit |
| Period Type: |
instant |
|
| X |
- DefinitionAmount of cash and cash equivalents, and cash and cash equivalents restricted to withdrawal or usage. Excludes amount for disposal group and discontinued operations. Cash includes, but is not limited to, currency on hand, demand deposits with banks or financial institutions, and other accounts with general characteristics of demand deposits. Cash equivalents include, but are not limited to, short-term, highly liquid investments that are both readily convertible to known amounts of cash and so near their maturity that they present insignificant risk of changes in value because of changes in interest rates. Reference 1: http://www.xbrl.org/2003/role/disclosureRef
-Topic 230
-SubTopic 10
-Name Accounting Standards Codification
-Section 50
-Paragraph 8
-Publisher FASB
-URI https://asc.fasb.org/1943274/2147482913/230-10-50-8
Reference 2: http://fasb.org/us-gaap/role/ref/legacyRef
-Topic 230
-SubTopic 10
-Name Accounting Standards Codification
-Section 45
-Paragraph 24
-Publisher FASB
-URI https://asc.fasb.org/1943274/2147482740/230-10-45-24
Reference 3: http://fasb.org/us-gaap/role/ref/legacyRef
-Name Accounting Standards Codification
-Topic 230
-SubTopic 10
-Section 45
-Paragraph 4
-Publisher FASB
-URI https://asc.fasb.org/1943274/2147482740/230-10-45-4
| Name: |
us-gaap_CashCashEquivalentsRestrictedCashAndRestrictedCashEquivalents |
| Namespace Prefix: |
us-gaap_ |
| Data Type: |
xbrli:monetaryItemType |
| Balance Type: |
debit |
| Period Type: |
instant |
|
| X |
- DefinitionAggregate par or stated value of issued nonredeemable common stock (or common stock redeemable solely at the option of the issuer). This item includes treasury stock repurchased by the entity. Note: elements for number of nonredeemable common shares, par value and other disclosure concepts are in another section within stockholders' equity. Reference 1: http://fasb.org/us-gaap/role/ref/legacyRef
-Topic 210
-SubTopic 10
-Name Accounting Standards Codification
-Section S99
-Paragraph 1
-Subparagraph (SX 210.5-02(29))
-Publisher FASB
-URI https://asc.fasb.org/1943274/2147480566/210-10-S99-1
Reference 2: http://www.xbrl.org/2003/role/exampleRef
-Topic 852
-SubTopic 10
-Name Accounting Standards Codification
-Section 55
-Paragraph 10
-Publisher FASB
-URI https://asc.fasb.org/1943274/2147481372/852-10-55-10
Reference 3: http://www.xbrl.org/2003/role/disclosureRef
-Topic 944
-SubTopic 210
-Name Accounting Standards Codification
-Section S99
-Paragraph 1
-Subparagraph (SX 210.7-03(a)(22))
-Publisher FASB
-URI https://asc.fasb.org/1943274/2147478777/944-210-S99-1
| Name: |
us-gaap_CommonStockValue |
| Namespace Prefix: |
us-gaap_ |
| Data Type: |
xbrli:monetaryItemType |
| Balance Type: |
credit |
| Period Type: |
instant |
|
| X |
- DefinitionAmount of deferred income and obligation to transfer product and service to customer for which consideration has been received or is receivable, classified as current. Reference 1: http://www.xbrl.org/2009/role/commonPracticeRef
-Topic 210
-SubTopic 10
-Name Accounting Standards Codification
-Section S99
-Paragraph 1
-Subparagraph (SX 210.5-02(20))
-Publisher FASB
-URI https://asc.fasb.org/1943274/2147480566/210-10-S99-1
| Name: |
us-gaap_DeferredRevenueCurrent |
| Namespace Prefix: |
us-gaap_ |
| Data Type: |
xbrli:monetaryItemType |
| Balance Type: |
credit |
| Period Type: |
instant |
|
| X |
- DefinitionAmount, after accumulated impairment loss, of asset representing future economic benefit arising from other asset acquired in business combination or from joint venture formation or both, that is not individually identified and separately recognized. Reference 1: http://www.xbrl.org/2003/role/exampleRef
-Topic 280
-SubTopic 10
-Name Accounting Standards Codification
-Section 55
-Paragraph 49
-Publisher FASB
-URI https://asc.fasb.org/1943274/2147482785/280-10-55-49
Reference 2: http://www.xbrl.org/2003/role/exampleRef
-Topic 350
-SubTopic 20
-Name Accounting Standards Codification
-Section 55
-Paragraph 24
-Publisher FASB
-URI https://asc.fasb.org/1943274/2147482548/350-20-55-24
Reference 3: http://www.xbrl.org/2003/role/exampleRef
-Topic 820
-SubTopic 10
-Name Accounting Standards Codification
-Section 55
-Paragraph 100
-Subparagraph (d)
-Publisher FASB
-URI https://asc.fasb.org/1943274/2147482078/820-10-55-100
Reference 4: http://www.xbrl.org/2003/role/exampleRef
-Topic 852
-SubTopic 10
-Name Accounting Standards Codification
-Section 55
-Paragraph 10
-Publisher FASB
-URI https://asc.fasb.org/1943274/2147481372/852-10-55-10
Reference 5: http://www.xbrl.org/2003/role/disclosureRef
-Topic 210
-SubTopic 10
-Name Accounting Standards Codification
-Section S99
-Paragraph 1
-Subparagraph (SX 210.5-02(15))
-Publisher FASB
-URI https://asc.fasb.org/1943274/2147480566/210-10-S99-1
Reference 6: http://www.xbrl.org/2003/role/disclosureRef
-Topic 350
-SubTopic 20
-Name Accounting Standards Codification
-Section 45
-Paragraph 1
-Publisher FASB
-URI https://asc.fasb.org/1943274/2147482598/350-20-45-1
Reference 7: http://www.xbrl.org/2009/role/commonPracticeRef
-Topic 350
-SubTopic 20
-Name Accounting Standards Codification
-Section 50
-Paragraph 1
-Subparagraph (a)
-Publisher FASB
-URI https://asc.fasb.org/1943274/2147482573/350-20-50-1
Reference 8: http://www.xbrl.org/2009/role/commonPracticeRef
-Topic 350
-SubTopic 20
-Name Accounting Standards Codification
-Section 50
-Paragraph 1
-Subparagraph (h)
-Publisher FASB
-URI https://asc.fasb.org/1943274/2147482573/350-20-50-1
Reference 9: http://www.xbrl.org/2003/role/disclosureRef
-Topic 942
-SubTopic 210
-Name Accounting Standards Codification
-Section S99
-Paragraph 1
-Subparagraph (SX 210.9-03(10)(1))
-Publisher FASB
-URI https://asc.fasb.org/1943274/2147478546/942-210-S99-1
| Name: |
us-gaap_Goodwill |
| Namespace Prefix: |
us-gaap_ |
| Data Type: |
xbrli:monetaryItemType |
| Balance Type: |
debit |
| Period Type: |
instant |
|
| X |
- DefinitionSum of the carrying amounts of all intangible assets, excluding goodwill, as of the balance sheet date, net of accumulated amortization and impairment charges. Reference 1: http://www.xbrl.org/2009/role/commonPracticeRef
-Topic 350
-SubTopic 30
-Name Accounting Standards Codification
-Section 50
-Paragraph 2
-Subparagraph (a)(1)
-Publisher FASB
-URI https://asc.fasb.org/1943274/2147482665/350-30-50-2
Reference 2: http://www.xbrl.org/2009/role/commonPracticeRef
-Topic 350
-SubTopic 30
-Name Accounting Standards Codification
-Section 50
-Paragraph 2
-Subparagraph (b)
-Publisher FASB
-URI https://asc.fasb.org/1943274/2147482665/350-30-50-2
Reference 3: http://www.xbrl.org/2003/role/disclosureRef
-Topic 350
-SubTopic 30
-Name Accounting Standards Codification
-Section 45
-Paragraph 1
-Publisher FASB
-URI https://asc.fasb.org/1943274/2147482686/350-30-45-1
| Name: |
us-gaap_IntangibleAssetsNetExcludingGoodwill |
| Namespace Prefix: |
us-gaap_ |
| Data Type: |
xbrli:monetaryItemType |
| Balance Type: |
debit |
| Period Type: |
instant |
|
| X |
- DefinitionAmount of liability recognized for present obligation requiring transfer or otherwise providing economic benefit to others. Reference 1: http://fasb.org/us-gaap/role/ref/legacyRef
-Name Accounting Standards Codification
-Section S99
-Paragraph 1
-Subparagraph (SX 210.5-02(22))
-SubTopic 10
-Topic 210
-Publisher FASB
-URI https://asc.fasb.org/1943274/2147480566/210-10-S99-1
Reference 2: http://fasb.org/us-gaap/role/ref/legacyRef
-Topic 210
-SubTopic 10
-Name Accounting Standards Codification
-Section S99
-Paragraph 1
-Subparagraph (SX 210.5-02(20))
-Publisher FASB
-URI https://asc.fasb.org/1943274/2147480566/210-10-S99-1
Reference 3: http://fasb.org/us-gaap/role/ref/legacyRef
-Topic 210
-SubTopic 10
-Name Accounting Standards Codification
-Section S99
-Paragraph 1
-Subparagraph (SX 210.5-02(24))
-Publisher FASB
-URI https://asc.fasb.org/1943274/2147480566/210-10-S99-1
Reference 4: http://fasb.org/us-gaap/role/ref/legacyRef
-Topic 210
-SubTopic 10
-Name Accounting Standards Codification
-Section S99
-Paragraph 1
-Subparagraph (SX 210.5-02(19))
-Publisher FASB
-URI https://asc.fasb.org/1943274/2147480566/210-10-S99-1
Reference 5: http://fasb.org/us-gaap/role/ref/legacyRef
-Topic 210
-SubTopic 10
-Name Accounting Standards Codification
-Section S99
-Paragraph 1
-Subparagraph (SX 210.5-02(25))
-Publisher FASB
-URI https://asc.fasb.org/1943274/2147480566/210-10-S99-1
Reference 6: http://fasb.org/us-gaap/role/ref/legacyRef
-Topic 210
-SubTopic 10
-Name Accounting Standards Codification
-Section S99
-Paragraph 1
-Subparagraph (SX 210.5-02(26))
-Publisher FASB
-URI https://asc.fasb.org/1943274/2147480566/210-10-S99-1
Reference 7: http://fasb.org/us-gaap/role/ref/legacyRef
-Topic 210
-SubTopic 10
-Name Accounting Standards Codification
-Section S99
-Paragraph 1
-Subparagraph (SX 210.5-02(23))
-Publisher FASB
-URI https://asc.fasb.org/1943274/2147480566/210-10-S99-1
Reference 8: http://fasb.org/us-gaap/role/ref/legacyRef
-Topic 210
-SubTopic 10
-Name Accounting Standards Codification
-Section S99
-Paragraph 1
-Subparagraph (SX 210.5-02(21))
-Publisher FASB
-URI https://asc.fasb.org/1943274/2147480566/210-10-S99-1
Reference 9: http://www.xbrl.org/2003/role/disclosureRef
-Topic 810
-SubTopic 10
-Name Accounting Standards Codification
-Section 50
-Paragraph 3
-Subparagraph (c)
-Publisher FASB
-URI https://asc.fasb.org/1943274/2147481203/810-10-50-3
Reference 10: http://www.xbrl.org/2003/role/disclosureRef
-Topic 810
-SubTopic 10
-Name Accounting Standards Codification
-Section 45
-Paragraph 25
-Subparagraph (b)
-Publisher FASB
-URI https://asc.fasb.org/1943274/2147481231/810-10-45-25
Reference 11: http://www.xbrl.org/2003/role/disclosureRef
-Topic 810
-SubTopic 10
-Name Accounting Standards Codification
-Section 50
-Paragraph 3
-Subparagraph (bb)
-Publisher FASB
-URI https://asc.fasb.org/1943274/2147481203/810-10-50-3
Reference 12: http://www.xbrl.org/2003/role/disclosureRef
-Topic 235
-SubTopic 10
-Name Accounting Standards Codification
-Section S99
-Paragraph 1
-Subparagraph (SX 210.4-08(g)(1)(ii))
-Publisher FASB
-URI https://asc.fasb.org/1943274/2147480678/235-10-S99-1
Reference 13: http://www.xbrl.org/2003/role/disclosureRef
-Topic 323
-SubTopic 10
-Name Accounting Standards Codification
-Section 50
-Paragraph 3
-Subparagraph (c)
-Publisher FASB
-URI https://asc.fasb.org/1943274/2147481687/323-10-50-3
Reference 14: http://www.xbrl.org/2003/role/disclosureRef
-Topic 825
-SubTopic 10
-Name Accounting Standards Codification
-Section 50
-Paragraph 28
-Subparagraph (f)
-Publisher FASB
-URI https://asc.fasb.org/1943274/2147482907/825-10-50-28
Reference 15: http://www.xbrl.org/2003/role/exampleRef
-Topic 946
-SubTopic 830
-Name Accounting Standards Codification
-Section 55
-Paragraph 12
-Publisher FASB
-URI https://asc.fasb.org/1943274/2147479168/946-830-55-12
Reference 16: http://www.xbrl.org/2003/role/disclosureRef
-Topic 946
-SubTopic 210
-Name Accounting Standards Codification
-Section S99
-Paragraph 1
-Subparagraph (SX 210.6-04(14))
-Publisher FASB
-URI https://asc.fasb.org/1943274/2147479170/946-210-S99-1
Reference 17: http://www.xbrl.org/2003/role/disclosureRef
-Topic 470
-SubTopic 10
-Name Accounting Standards Codification
-Section S99
-Paragraph 1A
-Subparagraph (SX 210.13-01(a)(4)(i))
-Publisher FASB
-URI https://asc.fasb.org/1943274/2147480097/470-10-S99-1A
Reference 18: http://www.xbrl.org/2009/role/commonPracticeRef
-Topic 470
-SubTopic 10
-Name Accounting Standards Codification
-Section S99
-Paragraph 1A
-Subparagraph (SX 210.13-01(a)(4)(ii))
-Publisher FASB
-URI https://asc.fasb.org/1943274/2147480097/470-10-S99-1A
Reference 19: http://www.xbrl.org/2003/role/disclosureRef
-Topic 470
-SubTopic 10
-Name Accounting Standards Codification
-Section S99
-Paragraph 1A
-Subparagraph (SX 210.13-01(a)(4)(iii)(A))
-Publisher FASB
-URI https://asc.fasb.org/1943274/2147480097/470-10-S99-1A
Reference 20: http://www.xbrl.org/2003/role/disclosureRef
-Topic 470
-SubTopic 10
-Name Accounting Standards Codification
-Section S99
-Paragraph 1A
-Subparagraph (SX 210.13-01(a)(4)(iv))
-Publisher FASB
-URI https://asc.fasb.org/1943274/2147480097/470-10-S99-1A
Reference 21: http://www.xbrl.org/2003/role/disclosureRef
-Topic 470
-SubTopic 10
-Name Accounting Standards Codification
-Section S99
-Paragraph 1A
-Subparagraph (SX 210.13-01(a)(5))
-Publisher FASB
-URI https://asc.fasb.org/1943274/2147480097/470-10-S99-1A
Reference 22: http://www.xbrl.org/2003/role/disclosureRef
-Topic 470
-SubTopic 10
-Name Accounting Standards Codification
-Section S99
-Paragraph 1B
-Subparagraph (SX 210.13-02(a)(4)(i))
-Publisher FASB
-URI https://asc.fasb.org/1943274/2147480097/470-10-S99-1B
Reference 23: http://www.xbrl.org/2003/role/disclosureRef
-Topic 470
-SubTopic 10
-Name Accounting Standards Codification
-Section S99
-Paragraph 1B
-Subparagraph (SX 210.13-02(a)(4)(iii)(A))
-Publisher FASB
-URI https://asc.fasb.org/1943274/2147480097/470-10-S99-1B
Reference 24: http://www.xbrl.org/2003/role/disclosureRef
-Topic 470
-SubTopic 10
-Name Accounting Standards Codification
-Section S99
-Paragraph 1B
-Subparagraph (SX 210.13-02(a)(4)(iii)(B))
-Publisher FASB
-URI https://asc.fasb.org/1943274/2147480097/470-10-S99-1B
Reference 25: http://www.xbrl.org/2003/role/disclosureRef
-Topic 470
-SubTopic 10
-Name Accounting Standards Codification
-Section S99
-Paragraph 1B
-Subparagraph (SX 210.13-02(a)(4)(iv))
-Publisher FASB
-URI https://asc.fasb.org/1943274/2147480097/470-10-S99-1B
Reference 26: http://www.xbrl.org/2003/role/disclosureRef
-Topic 470
-SubTopic 10
-Name Accounting Standards Codification
-Section S99
-Paragraph 1B
-Subparagraph (SX 210.13-02(a)(5))
-Publisher FASB
-URI https://asc.fasb.org/1943274/2147480097/470-10-S99-1B
Reference 27: http://www.xbrl.org/2009/role/commonPracticeRef
-Topic 852
-SubTopic 10
-Name Accounting Standards Codification
-Section 50
-Paragraph 7
-Subparagraph (a)
-Publisher FASB
-URI https://asc.fasb.org/1943274/2147481404/852-10-50-7
Reference 28: http://www.xbrl.org/2009/role/commonPracticeRef
-Topic 852
-SubTopic 10
-Name Accounting Standards Codification
-Section 50
-Paragraph 7
-Subparagraph (b)
-Publisher FASB
-URI https://asc.fasb.org/1943274/2147481404/852-10-50-7
Reference 29: http://www.xbrl.org/2003/role/exampleRef
-Topic 280
-SubTopic 10
-Name Accounting Standards Codification
-Section 50
-Paragraph 30
-Subparagraph (d)
-Publisher FASB
-URI https://asc.fasb.org/1943274/2147482810/280-10-50-30
| Name: |
us-gaap_Liabilities |
| Namespace Prefix: |
us-gaap_ |
| Data Type: |
xbrli:monetaryItemType |
| Balance Type: |
credit |
| Period Type: |
instant |
|
| X |
- DefinitionAmount of liabilities and equity items, including the portion of equity attributable to noncontrolling interests, if any. Reference 1: http://www.xbrl.org/2003/role/exampleRef
-Topic 852
-SubTopic 10
-Name Accounting Standards Codification
-Section 55
-Paragraph 10
-Publisher FASB
-URI https://asc.fasb.org/1943274/2147481372/852-10-55-10
Reference 2: http://www.xbrl.org/2003/role/disclosureRef
-Topic 944
-SubTopic 210
-Name Accounting Standards Codification
-Section S99
-Paragraph 1
-Subparagraph (SX 210.7-03(a)(25))
-Publisher FASB
-URI https://asc.fasb.org/1943274/2147478777/944-210-S99-1
Reference 3: http://www.xbrl.org/2009/role/commonPracticeRef
-Topic 235
-SubTopic 10
-Name Accounting Standards Codification
-Section S99
-Paragraph 1
-Subparagraph (SX 210.4-08(g)(1)(ii))
-Publisher FASB
-URI https://asc.fasb.org/1943274/2147480678/235-10-S99-1
Reference 4: http://www.xbrl.org/2009/role/commonPracticeRef
-Topic 323
-SubTopic 10
-Name Accounting Standards Codification
-Section 50
-Paragraph 3
-Subparagraph (c)
-Publisher FASB
-URI https://asc.fasb.org/1943274/2147481687/323-10-50-3
Reference 5: http://www.xbrl.org/2009/role/commonPracticeRef
-Topic 825
-SubTopic 10
-Name Accounting Standards Codification
-Section 50
-Paragraph 28
-Subparagraph (f)
-Publisher FASB
-URI https://asc.fasb.org/1943274/2147482907/825-10-50-28
Reference 6: http://fasb.org/us-gaap/role/ref/legacyRef
-Topic 942
-SubTopic 210
-Name Accounting Standards Codification
-Section S99
-Paragraph 1
-Subparagraph (SX 210.9-03(23))
-Publisher FASB
-URI https://asc.fasb.org/1943274/2147478546/942-210-S99-1
Reference 7: http://fasb.org/us-gaap/role/ref/legacyRef
-Topic 210
-SubTopic 10
-Name Accounting Standards Codification
-Section S99
-Paragraph 1
-Subparagraph (SX 210.5-02(32))
-Publisher FASB
-URI https://asc.fasb.org/1943274/2147480566/210-10-S99-1
| Name: |
us-gaap_LiabilitiesAndStockholdersEquity |
| Namespace Prefix: |
us-gaap_ |
| Data Type: |
xbrli:monetaryItemType |
| Balance Type: |
credit |
| Period Type: |
instant |
|
| X |
- DefinitionTotal obligations incurred as part of normal operations that are expected to be paid during the following twelve months or within one business cycle, if longer. Reference 1: http://fasb.org/us-gaap/role/ref/legacyRef
-Topic 210
-SubTopic 10
-Name Accounting Standards Codification
-Section S99
-Paragraph 1
-Subparagraph (SX 210.5-02(21))
-Publisher FASB
-URI https://asc.fasb.org/1943274/2147480566/210-10-S99-1
Reference 2: http://www.xbrl.org/2003/role/disclosureRef
-Topic 810
-SubTopic 10
-Name Accounting Standards Codification
-Section 50
-Paragraph 3
-Subparagraph (c)
-Publisher FASB
-URI https://asc.fasb.org/1943274/2147481203/810-10-50-3
Reference 3: http://www.xbrl.org/2003/role/disclosureRef
-Topic 810
-SubTopic 10
-Name Accounting Standards Codification
-Section 45
-Paragraph 25
-Subparagraph (b)
-Publisher FASB
-URI https://asc.fasb.org/1943274/2147481231/810-10-45-25
Reference 4: http://www.xbrl.org/2003/role/disclosureRef
-Topic 810
-SubTopic 10
-Name Accounting Standards Codification
-Section 50
-Paragraph 3
-Subparagraph (bb)
-Publisher FASB
-URI https://asc.fasb.org/1943274/2147481203/810-10-50-3
Reference 5: http://www.xbrl.org/2003/role/disclosureRef
-Topic 235
-SubTopic 10
-Name Accounting Standards Codification
-Section S99
-Paragraph 1
-Subparagraph (SX 210.4-08(g)(1)(ii))
-Publisher FASB
-URI https://asc.fasb.org/1943274/2147480678/235-10-S99-1
Reference 6: http://www.xbrl.org/2003/role/disclosureRef
-Topic 323
-SubTopic 10
-Name Accounting Standards Codification
-Section 50
-Paragraph 3
-Subparagraph (c)
-Publisher FASB
-URI https://asc.fasb.org/1943274/2147481687/323-10-50-3
Reference 7: http://www.xbrl.org/2003/role/disclosureRef
-Topic 825
-SubTopic 10
-Name Accounting Standards Codification
-Section 50
-Paragraph 28
-Subparagraph (f)
-Publisher FASB
-URI https://asc.fasb.org/1943274/2147482907/825-10-50-28
Reference 8: http://www.xbrl.org/2003/role/exampleRef
-Topic 852
-SubTopic 10
-Name Accounting Standards Codification
-Section 55
-Paragraph 10
-Publisher FASB
-URI https://asc.fasb.org/1943274/2147481372/852-10-55-10
Reference 9: http://www.xbrl.org/2003/role/disclosureRef
-Topic 210
-SubTopic 10
-Name Accounting Standards Codification
-Section 45
-Paragraph 5
-Publisher FASB
-URI https://asc.fasb.org/1943274/2147483467/210-10-45-5
Reference 10: http://www.xbrl.org/2003/role/disclosureRef
-Topic 470
-SubTopic 10
-Name Accounting Standards Codification
-Section S99
-Paragraph 1A
-Subparagraph (SX 210.13-01(a)(4)(i))
-Publisher FASB
-URI https://asc.fasb.org/1943274/2147480097/470-10-S99-1A
Reference 11: http://www.xbrl.org/2009/role/commonPracticeRef
-Topic 470
-SubTopic 10
-Name Accounting Standards Codification
-Section S99
-Paragraph 1A
-Subparagraph (SX 210.13-01(a)(4)(ii))
-Publisher FASB
-URI https://asc.fasb.org/1943274/2147480097/470-10-S99-1A
Reference 12: http://www.xbrl.org/2003/role/disclosureRef
-Topic 470
-SubTopic 10
-Name Accounting Standards Codification
-Section S99
-Paragraph 1A
-Subparagraph (SX 210.13-01(a)(4)(iii)(A))
-Publisher FASB
-URI https://asc.fasb.org/1943274/2147480097/470-10-S99-1A
Reference 13: http://www.xbrl.org/2003/role/disclosureRef
-Topic 470
-SubTopic 10
-Name Accounting Standards Codification
-Section S99
-Paragraph 1A
-Subparagraph (SX 210.13-01(a)(4)(iv))
-Publisher FASB
-URI https://asc.fasb.org/1943274/2147480097/470-10-S99-1A
Reference 14: http://www.xbrl.org/2003/role/disclosureRef
-Topic 470
-SubTopic 10
-Name Accounting Standards Codification
-Section S99
-Paragraph 1A
-Subparagraph (SX 210.13-01(a)(5))
-Publisher FASB
-URI https://asc.fasb.org/1943274/2147480097/470-10-S99-1A
Reference 15: http://www.xbrl.org/2003/role/disclosureRef
-Topic 470
-SubTopic 10
-Name Accounting Standards Codification
-Section S99
-Paragraph 1B
-Subparagraph (SX 210.13-02(a)(4)(i))
-Publisher FASB
-URI https://asc.fasb.org/1943274/2147480097/470-10-S99-1B
Reference 16: http://www.xbrl.org/2003/role/disclosureRef
-Topic 470
-SubTopic 10
-Name Accounting Standards Codification
-Section S99
-Paragraph 1B
-Subparagraph (SX 210.13-02(a)(4)(iii)(A))
-Publisher FASB
-URI https://asc.fasb.org/1943274/2147480097/470-10-S99-1B
Reference 17: http://www.xbrl.org/2003/role/disclosureRef
-Topic 470
-SubTopic 10
-Name Accounting Standards Codification
-Section S99
-Paragraph 1B
-Subparagraph (SX 210.13-02(a)(4)(iii)(B))
-Publisher FASB
-URI https://asc.fasb.org/1943274/2147480097/470-10-S99-1B
Reference 18: http://www.xbrl.org/2003/role/disclosureRef
-Topic 470
-SubTopic 10
-Name Accounting Standards Codification
-Section S99
-Paragraph 1B
-Subparagraph (SX 210.13-02(a)(4)(iv))
-Publisher FASB
-URI https://asc.fasb.org/1943274/2147480097/470-10-S99-1B
Reference 19: http://www.xbrl.org/2003/role/disclosureRef
-Topic 470
-SubTopic 10
-Name Accounting Standards Codification
-Section S99
-Paragraph 1B
-Subparagraph (SX 210.13-02(a)(5))
-Publisher FASB
-URI https://asc.fasb.org/1943274/2147480097/470-10-S99-1B
Reference 20: http://www.xbrl.org/2009/role/commonPracticeRef
-Topic 852
-SubTopic 10
-Name Accounting Standards Codification
-Section 50
-Paragraph 7
-Subparagraph (a)
-Publisher FASB
-URI https://asc.fasb.org/1943274/2147481404/852-10-50-7
Reference 21: http://www.xbrl.org/2009/role/commonPracticeRef
-Topic 852
-SubTopic 10
-Name Accounting Standards Codification
-Section 50
-Paragraph 7
-Subparagraph (b)
-Publisher FASB
-URI https://asc.fasb.org/1943274/2147481404/852-10-50-7
| Name: |
us-gaap_LiabilitiesCurrent |
| Namespace Prefix: |
us-gaap_ |
| Data Type: |
xbrli:monetaryItemType |
| Balance Type: |
credit |
| Period Type: |
instant |
|
| X |
- References
+ Details
| Name: |
us-gaap_LiabilitiesCurrentAbstract |
| Namespace Prefix: |
us-gaap_ |
| Data Type: |
xbrli:stringItemType |
| Balance Type: |
na |
| Period Type: |
duration |
|
| X |
- DefinitionAmount, after deduction of unamortized premium (discount) and debt issuance cost, of long-term debt classified as current. Excludes lease obligation. Reference 1: http://www.xbrl.org/2003/role/disclosureRef
-Topic 210
-SubTopic 10
-Name Accounting Standards Codification
-Section S99
-Paragraph 1
-Subparagraph (SX 210.5-02(20))
-Publisher FASB
-URI https://asc.fasb.org/1943274/2147480566/210-10-S99-1
| Name: |
us-gaap_LongTermDebtCurrent |
| Namespace Prefix: |
us-gaap_ |
| Data Type: |
xbrli:monetaryItemType |
| Balance Type: |
credit |
| Period Type: |
instant |
|
| X |
- DefinitionAmount, after deduction of unamortized premium (discount) and debt issuance cost, of long-term debt classified as noncurrent. Excludes lease obligation. Reference 1: http://www.xbrl.org/2003/role/disclosureRef
-Topic 210
-SubTopic 10
-Name Accounting Standards Codification
-Section S99
-Paragraph 1
-Subparagraph (SX 210.5-02(22))
-Publisher FASB
-URI https://asc.fasb.org/1943274/2147480566/210-10-S99-1
| Name: |
us-gaap_LongTermDebtNoncurrent |
| Namespace Prefix: |
us-gaap_ |
| Data Type: |
xbrli:monetaryItemType |
| Balance Type: |
credit |
| Period Type: |
instant |
|
| X |
- DefinitionPresent value of lessee's discounted obligation for lease payments from operating lease, classified as noncurrent. Reference 1: http://www.xbrl.org/2003/role/disclosureRef
-Topic 842
-SubTopic 20
-Name Accounting Standards Codification
-Section 45
-Paragraph 1
-Subparagraph (b)
-Publisher FASB
-URI https://asc.fasb.org/1943274/2147479041/842-20-45-1
| Name: |
us-gaap_OperatingLeaseLiabilityNoncurrent |
| Namespace Prefix: |
us-gaap_ |
| Data Type: |
xbrli:monetaryItemType |
| Balance Type: |
credit |
| Period Type: |
instant |
|
| X |
- DefinitionAmount of lessee's right to use underlying asset under operating lease. Reference 1: http://www.xbrl.org/2003/role/disclosureRef
-Topic 842
-SubTopic 20
-Name Accounting Standards Codification
-Section 45
-Paragraph 1
-Subparagraph (a)
-Publisher FASB
-URI https://asc.fasb.org/1943274/2147479041/842-20-45-1
| Name: |
us-gaap_OperatingLeaseRightOfUseAsset |
| Namespace Prefix: |
us-gaap_ |
| Data Type: |
xbrli:monetaryItemType |
| Balance Type: |
debit |
| Period Type: |
instant |
|
| X |
- DefinitionAmount of current assets classified as other. Reference 1: http://www.xbrl.org/2003/role/exampleRef
-Topic 852
-SubTopic 10
-Name Accounting Standards Codification
-Section 55
-Paragraph 10
-Publisher FASB
-URI https://asc.fasb.org/1943274/2147481372/852-10-55-10
Reference 2: http://www.xbrl.org/2003/role/disclosureRef
-Topic 210
-SubTopic 10
-Name Accounting Standards Codification
-Section S99
-Paragraph 1
-Subparagraph (SX 210.5-02(8))
-Publisher FASB
-URI https://asc.fasb.org/1943274/2147480566/210-10-S99-1
| Name: |
us-gaap_OtherAssetsCurrent |
| Namespace Prefix: |
us-gaap_ |
| Data Type: |
xbrli:monetaryItemType |
| Balance Type: |
debit |
| Period Type: |
instant |
|
| X |
- DefinitionAmount of noncurrent assets classified as other. Reference 1: http://www.xbrl.org/2003/role/disclosureRef
-Topic 210
-SubTopic 10
-Name Accounting Standards Codification
-Section S99
-Paragraph 1
-Subparagraph (SX 210.5-02(17))
-Publisher FASB
-URI https://asc.fasb.org/1943274/2147480566/210-10-S99-1
| Name: |
us-gaap_OtherAssetsNoncurrent |
| Namespace Prefix: |
us-gaap_ |
| Data Type: |
xbrli:monetaryItemType |
| Balance Type: |
debit |
| Period Type: |
instant |
|
| X |
- DefinitionAmount of liabilities classified as other, due after one year or the normal operating cycle, if longer. Reference 1: http://fasb.org/us-gaap/role/ref/legacyRef
-Topic 210
-SubTopic 10
-Name Accounting Standards Codification
-Section S99
-Paragraph 1
-Subparagraph (SX 210.5-02(24))
-Publisher FASB
-URI https://asc.fasb.org/1943274/2147480566/210-10-S99-1
| Name: |
us-gaap_OtherLiabilitiesNoncurrent |
| Namespace Prefix: |
us-gaap_ |
| Data Type: |
xbrli:monetaryItemType |
| Balance Type: |
credit |
| Period Type: |
instant |
|
| X |
- DefinitionAggregate par or stated value of issued nonredeemable preferred stock (or preferred stock redeemable solely at the option of the issuer). This item includes treasury stock repurchased by the entity. Note: elements for number of nonredeemable preferred shares, par value and other disclosure concepts are in another section within stockholders' equity. Reference 1: http://fasb.org/us-gaap/role/ref/legacyRef
-Topic 210
-SubTopic 10
-Name Accounting Standards Codification
-Section S99
-Paragraph 1
-Subparagraph (SX 210.5-02(28))
-Publisher FASB
-URI https://asc.fasb.org/1943274/2147480566/210-10-S99-1
Reference 2: http://www.xbrl.org/2003/role/exampleRef
-Topic 852
-SubTopic 10
-Name Accounting Standards Codification
-Section 55
-Paragraph 10
-Publisher FASB
-URI https://asc.fasb.org/1943274/2147481372/852-10-55-10
Reference 3: http://www.xbrl.org/2003/role/disclosureRef
-Topic 944
-SubTopic 210
-Name Accounting Standards Codification
-Section S99
-Paragraph 1
-Subparagraph (SX 210.7-03(a)(21))
-Publisher FASB
-URI https://asc.fasb.org/1943274/2147478777/944-210-S99-1
| Name: |
us-gaap_PreferredStockValue |
| Namespace Prefix: |
us-gaap_ |
| Data Type: |
xbrli:monetaryItemType |
| Balance Type: |
credit |
| Period Type: |
instant |
|
| X |
- DefinitionAmount after accumulated depreciation, depletion and amortization of physical assets used in the normal conduct of business to produce goods and services and not intended for resale. Examples include, but are not limited to, land, buildings, machinery and equipment, office equipment, and furniture and fixtures. Reference 1: http://fasb.org/us-gaap/role/ref/legacyRef
-Name Accounting Standards Codification
-Section 50
-Paragraph 1
-SubTopic 10
-Topic 360
-Publisher FASB
-URI https://asc.fasb.org/1943274/2147482099/360-10-50-1
Reference 2: http://www.xbrl.org/2003/role/disclosureRef
-Topic 842
-SubTopic 20
-Name Accounting Standards Codification
-Section 50
-Paragraph 7A
-Subparagraph (a)
-Publisher FASB
-URI https://asc.fasb.org/1943274/2147478964/842-20-50-7A
Reference 3: http://www.xbrl.org/2003/role/exampleRef
-Topic 852
-SubTopic 10
-Name Accounting Standards Codification
-Section 55
-Paragraph 10
-Publisher FASB
-URI https://asc.fasb.org/1943274/2147481372/852-10-55-10
Reference 4: http://www.xbrl.org/2003/role/disclosureRef
-Topic 944
-SubTopic 210
-Name Accounting Standards Codification
-Section S99
-Paragraph 1
-Subparagraph (SX 210.7-03(a)(8))
-Publisher FASB
-URI https://asc.fasb.org/1943274/2147478777/944-210-S99-1
Reference 5: http://www.xbrl.org/2003/role/disclosureRef
-Topic 942
-SubTopic 360
-Name Accounting Standards Codification
-Section 50
-Paragraph 1
-Publisher FASB
-URI https://asc.fasb.org/1943274/2147478451/942-360-50-1
| Name: |
us-gaap_PropertyPlantAndEquipmentNet |
| Namespace Prefix: |
us-gaap_ |
| Data Type: |
xbrli:monetaryItemType |
| Balance Type: |
debit |
| Period Type: |
instant |
|
| X |
- DefinitionAmount of accumulated undistributed earnings (deficit). Reference 1: http://fasb.org/us-gaap/role/ref/legacyRef
-Topic 210
-SubTopic 10
-Name Accounting Standards Codification
-Section S99
-Paragraph 1
-Subparagraph (SX 210.5-02(30)(a)(3))
-Publisher FASB
-URI https://asc.fasb.org/1943274/2147480566/210-10-S99-1
Reference 2: http://www.xbrl.org/2003/role/exampleRef
-Topic 852
-SubTopic 10
-Name Accounting Standards Codification
-Section 55
-Paragraph 10
-Publisher FASB
-URI https://asc.fasb.org/1943274/2147481372/852-10-55-10
Reference 3: http://www.xbrl.org/2003/role/disclosureRef
-Topic 944
-SubTopic 40
-Name Accounting Standards Codification
-Section 65
-Paragraph 2
-Subparagraph (g)(2)(i)
-Publisher FASB
-URI https://asc.fasb.org/1943274/2147480016/944-40-65-2
Reference 4: http://www.xbrl.org/2003/role/disclosureRef
-Topic 944
-SubTopic 40
-Name Accounting Standards Codification
-Section 65
-Paragraph 2
-Subparagraph (h)(2)
-Publisher FASB
-URI https://asc.fasb.org/1943274/2147480016/944-40-65-2
Reference 5: http://www.xbrl.org/2003/role/disclosureRef
-Topic 946
-SubTopic 20
-Name Accounting Standards Codification
-Section 50
-Paragraph 11
-Publisher FASB
-URI https://asc.fasb.org/1943274/2147480990/946-20-50-11
Reference 6: http://www.xbrl.org/2003/role/disclosureRef
-Topic 944
-SubTopic 210
-Name Accounting Standards Codification
-Section S99
-Paragraph 1
-Subparagraph (SX 210.7-03(a)(23)(a)(4))
-Publisher FASB
-URI https://asc.fasb.org/1943274/2147478777/944-210-S99-1
Reference 7: http://www.xbrl.org/2003/role/disclosureRef
-Topic 946
-SubTopic 210
-Name Accounting Standards Codification
-Section S99
-Paragraph 1
-Subparagraph (SX 210.6-04(17))
-Publisher FASB
-URI https://asc.fasb.org/1943274/2147479170/946-210-S99-1
Reference 8: http://fasb.org/us-gaap/role/ref/legacyRef
-Topic 505
-SubTopic 10
-Name Accounting Standards Codification
-Section S99
-Paragraph 1
-Subparagraph (SX 210.3-04)
-Publisher FASB
-URI https://asc.fasb.org/1943274/2147480008/505-10-S99-1
| Name: |
us-gaap_RetainedEarningsAccumulatedDeficit |
| Namespace Prefix: |
us-gaap_ |
| Data Type: |
xbrli:monetaryItemType |
| Balance Type: |
credit |
| Period Type: |
instant |
|
| X |
- DefinitionAmount of equity (deficit) attributable to parent. Excludes temporary equity and equity attributable to noncontrolling interest. Reference 1: http://fasb.org/us-gaap/role/ref/legacyRef
-Topic 210
-SubTopic 10
-Name Accounting Standards Codification
-Section S99
-Paragraph 1
-Subparagraph (SX 210.5-02(29))
-Publisher FASB
-URI https://asc.fasb.org/1943274/2147480566/210-10-S99-1
Reference 2: http://fasb.org/us-gaap/role/ref/legacyRef
-Topic 210
-SubTopic 10
-Name Accounting Standards Codification
-Section S99
-Paragraph 1
-Subparagraph (SX 210.5-02(30))
-Publisher FASB
-URI https://asc.fasb.org/1943274/2147480566/210-10-S99-1
Reference 3: http://fasb.org/us-gaap/role/ref/legacyRef
-Topic 210
-SubTopic 10
-Name Accounting Standards Codification
-Section S99
-Paragraph 1
-Subparagraph (SX 210.5-02(31))
-Publisher FASB
-URI https://asc.fasb.org/1943274/2147480566/210-10-S99-1
Reference 4: http://www.xbrl.org/2003/role/exampleRef
-Topic 852
-SubTopic 10
-Name Accounting Standards Codification
-Section 55
-Paragraph 10
-Publisher FASB
-URI https://asc.fasb.org/1943274/2147481372/852-10-55-10
Reference 5: http://www.xbrl.org/2003/role/exampleRef
-Topic 946
-SubTopic 830
-Name Accounting Standards Codification
-Section 55
-Paragraph 12
-Publisher FASB
-URI https://asc.fasb.org/1943274/2147479168/946-830-55-12
Reference 6: http://www.xbrl.org/2003/role/disclosureRef
-Topic 946
-SubTopic 210
-Name Accounting Standards Codification
-Section S99
-Paragraph 1
-Subparagraph (SX 210.6-04(19))
-Publisher FASB
-URI https://asc.fasb.org/1943274/2147479170/946-210-S99-1
Reference 7: http://www.xbrl.org/2003/role/disclosureRef
-Topic 946
-SubTopic 210
-Name Accounting Standards Codification
-Section S99
-Paragraph 2
-Subparagraph (SX 210.6-05(4))
-Publisher FASB
-URI https://asc.fasb.org/1943274/2147479170/946-210-S99-2
Reference 8: http://www.xbrl.org/2009/role/commonPracticeRef
-Topic 946
-SubTopic 220
-Name Accounting Standards Codification
-Section S99
-Paragraph 3
-Subparagraph (SX 210.6-09(4)(b))
-Publisher FASB
-URI https://asc.fasb.org/1943274/2147479134/946-220-S99-3
Reference 9: http://www.xbrl.org/2003/role/disclosureRef
-Topic 946
-SubTopic 220
-Name Accounting Standards Codification
-Section S99
-Paragraph 3
-Subparagraph (SX 210.6-09(6))
-Publisher FASB
-URI https://asc.fasb.org/1943274/2147479134/946-220-S99-3
Reference 10: http://www.xbrl.org/2003/role/disclosureRef
-Topic 946
-SubTopic 220
-Name Accounting Standards Codification
-Section S99
-Paragraph 3
-Subparagraph (SX 210.6-09(7))
-Publisher FASB
-URI https://asc.fasb.org/1943274/2147479134/946-220-S99-3
Reference 11: http://www.xbrl.org/2009/role/commonPracticeRef
-Topic 235
-SubTopic 10
-Name Accounting Standards Codification
-Section S99
-Paragraph 1
-Subparagraph (SX 210.4-08(g)(1)(ii))
-Publisher FASB
-URI https://asc.fasb.org/1943274/2147480678/235-10-S99-1
Reference 12: http://www.xbrl.org/2009/role/commonPracticeRef
-Topic 323
-SubTopic 10
-Name Accounting Standards Codification
-Section 50
-Paragraph 3
-Subparagraph (c)
-Publisher FASB
-URI https://asc.fasb.org/1943274/2147481687/323-10-50-3
Reference 13: http://www.xbrl.org/2009/role/commonPracticeRef
-Topic 825
-SubTopic 10
-Name Accounting Standards Codification
-Section 50
-Paragraph 28
-Subparagraph (f)
-Publisher FASB
-URI https://asc.fasb.org/1943274/2147482907/825-10-50-28
Reference 14: http://fasb.org/us-gaap/role/ref/legacyRef
-Topic 310
-SubTopic 10
-Name Accounting Standards Codification
-Section S99
-Paragraph 2
-Subparagraph (SAB Topic 4.E)
-Publisher FASB
-URI https://asc.fasb.org/1943274/2147480418/310-10-S99-2
| Name: |
us-gaap_StockholdersEquity |
| Namespace Prefix: |
us-gaap_ |
| Data Type: |
xbrli:monetaryItemType |
| Balance Type: |
credit |
| Period Type: |
instant |
|
| X |
- References
+ Details
| Name: |
us-gaap_StockholdersEquityAbstract |
| Namespace Prefix: |
us-gaap_ |
| Data Type: |
xbrli:stringItemType |
| Balance Type: |
na |
| Period Type: |
duration |
|
| X |
- DefinitionCarrying value as of the balance sheet date of obligations incurred and payable for statutory income, sales, use, payroll, excise, real, property and other taxes. Used to reflect the current portion of the liabilities (due within one year or within the normal operating cycle if longer). Reference 1: http://fasb.org/us-gaap/role/ref/legacyRef
-Topic 210
-SubTopic 10
-Name Accounting Standards Codification
-Section S99
-Paragraph 1
-Subparagraph (SX 210.5-02(20))
-Publisher FASB
-URI https://asc.fasb.org/1943274/2147480566/210-10-S99-1
Reference 2: http://fasb.org/us-gaap/role/ref/legacyRef
-Topic 210
-SubTopic 10
-Name Accounting Standards Codification
-Section S99
-Paragraph 1
-Subparagraph (SX 210.5-02(19))
-Publisher FASB
-URI https://asc.fasb.org/1943274/2147480566/210-10-S99-1
| Name: |
us-gaap_TaxesPayableCurrent |
| Namespace Prefix: |
us-gaap_ |
| Data Type: |
xbrli:monetaryItemType |
| Balance Type: |
credit |
| Period Type: |
instant |
|
v3.24.2.u1
CONSOLIDATED BALANCE SHEETS (Parenthetical) - USD ($)
$ in Thousands |
Jun. 30, 2024 |
Dec. 31, 2023 |
| CONSOLIDATED BALANCE SHEETS |
|
|
| Allowance For Accounts Receivables |
$ 1,156
|
$ 1,119
|
| Accumulated Amortization - Capitalized Software |
3,524
|
3,424
|
| Accumulated depreciation |
841
|
765
|
| Accumulated Amortization - Intangible Assets |
10,926
|
9,562
|
| Debt discount |
$ 78
|
$ 87
|
| Preferred Stock Shares, Par Value |
$ 0.001
|
$ 0.001
|
| Preferred Stock Shares, Authorized |
1,000,000
|
1,000,000
|
| Preferred Stock Shares, Issued |
0
|
0
|
| Preferred Stock Shares, Outstanding |
0
|
0
|
| Common Stock Shares, Par Value |
$ 0.001
|
$ 0.001
|
| Common Stock Shares, Authorized |
20,000,000
|
20,000,000
|
| Common Stock Shares, Issued |
3,831,711
|
3,815,212
|
| Common Stock Shares, Outstanding |
3,831,711
|
3,815,212
|
| X |
- References
+ Details
| Name: |
isdr_DiscountOnDebt |
| Namespace Prefix: |
isdr_ |
| Data Type: |
xbrli:monetaryItemType |
| Balance Type: |
debit |
| Period Type: |
instant |
|
| X |
- DefinitionAmount of accumulated depreciation, depletion and amortization for physical assets used in the normal conduct of business to produce goods and services. Reference 1: http://www.xbrl.org/2003/role/disclosureRef
-Topic 944
-SubTopic 210
-Name Accounting Standards Codification
-Section S99
-Paragraph 1
-Subparagraph (SX 210.7-03(a)(8)(b))
-Publisher FASB
-URI https://asc.fasb.org/1943274/2147478777/944-210-S99-1
Reference 2: http://www.xbrl.org/2003/role/disclosureRef
-Topic 210
-SubTopic 10
-Name Accounting Standards Codification
-Section S99
-Paragraph 1
-Subparagraph (SX 210.5-02(14))
-Publisher FASB
-URI https://asc.fasb.org/1943274/2147480566/210-10-S99-1
Reference 3: http://fasb.org/us-gaap/role/ref/legacyRef
-Name Accounting Standards Codification
-Topic 360
-SubTopic 10
-Section 50
-Paragraph 1
-Subparagraph (c)
-Publisher FASB
-URI https://asc.fasb.org/1943274/2147482099/360-10-50-1
| Name: |
us-gaap_AccumulatedDepreciationDepletionAndAmortizationPropertyPlantAndEquipment |
| Namespace Prefix: |
us-gaap_ |
| Data Type: |
xbrli:monetaryItemType |
| Balance Type: |
credit |
| Period Type: |
instant |
|
| X |
- DefinitionAmount of allowance for credit loss on accounts receivable, classified as current. Reference 1: http://www.xbrl.org/2003/role/disclosureRef
-Topic 210
-SubTopic 10
-Name Accounting Standards Codification
-Section S99
-Paragraph 1
-Subparagraph (SX 210.5-02(4))
-Publisher FASB
-URI https://asc.fasb.org/1943274/2147480566/210-10-S99-1
Reference 2: http://www.xbrl.org/2003/role/disclosureRef
-Topic 326
-SubTopic 20
-Name Accounting Standards Codification
-Section 45
-Paragraph 1
-Publisher FASB
-URI https://asc.fasb.org/1943274/2147479344/326-20-45-1
Reference 3: http://www.xbrl.org/2003/role/disclosureRef
-Topic 310
-SubTopic 10
-Name Accounting Standards Codification
-Section 50
-Paragraph 4
-Publisher FASB
-URI https://asc.fasb.org/1943274/2147481962/310-10-50-4
| Name: |
us-gaap_AllowanceForDoubtfulAccountsReceivableCurrent |
| Namespace Prefix: |
us-gaap_ |
| Data Type: |
xbrli:monetaryItemType |
| Balance Type: |
credit |
| Period Type: |
instant |
|
| X |
- DefinitionFor each balance sheet presented, the amount of accumulated amortization for capitalized computer software costs. Reference 1: http://www.xbrl.org/2003/role/disclosureRef
-Topic 350
-SubTopic 30
-Name Accounting Standards Codification
-Section 50
-Paragraph 2
-Subparagraph (a)(1)
-Publisher FASB
-URI https://asc.fasb.org/1943274/2147482665/350-30-50-2
Reference 2: http://www.xbrl.org/2003/role/disclosureRef
-Topic 985
-SubTopic 20
-Name Accounting Standards Codification
-Section 50
-Paragraph 2
-Publisher FASB
-URI https://asc.fasb.org/1943274/2147481283/985-20-50-2
| Name: |
us-gaap_CapitalizedComputerSoftwareAccumulatedAmortization |
| Namespace Prefix: |
us-gaap_ |
| Data Type: |
xbrli:monetaryItemType |
| Balance Type: |
credit |
| Period Type: |
instant |
|
| X |
- DefinitionFace amount or stated value per share of common stock. Reference 1: http://fasb.org/us-gaap/role/ref/legacyRef
-Topic 210
-SubTopic 10
-Name Accounting Standards Codification
-Section S99
-Paragraph 1
-Subparagraph (SX 210.5-02(29))
-Publisher FASB
-URI https://asc.fasb.org/1943274/2147480566/210-10-S99-1
| Name: |
us-gaap_CommonStockParOrStatedValuePerShare |
| Namespace Prefix: |
us-gaap_ |
| Data Type: |
dtr-types:perShareItemType |
| Balance Type: |
na |
| Period Type: |
instant |
|
| X |
- DefinitionThe maximum number of common shares permitted to be issued by an entity's charter and bylaws. Reference 1: http://fasb.org/us-gaap/role/ref/legacyRef
-Topic 210
-SubTopic 10
-Name Accounting Standards Codification
-Section S99
-Paragraph 1
-Subparagraph (SX 210.5-02(29))
-Publisher FASB
-URI https://asc.fasb.org/1943274/2147480566/210-10-S99-1
Reference 2: http://www.xbrl.org/2003/role/disclosureRef
-Topic 946
-SubTopic 210
-Name Accounting Standards Codification
-Section S99
-Paragraph 1
-Subparagraph (SX 210.6-04(16)(a))
-Publisher FASB
-URI https://asc.fasb.org/1943274/2147479170/946-210-S99-1
| Name: |
us-gaap_CommonStockSharesAuthorized |
| Namespace Prefix: |
us-gaap_ |
| Data Type: |
xbrli:sharesItemType |
| Balance Type: |
na |
| Period Type: |
instant |
|
| X |
- DefinitionTotal number of common shares of an entity that have been sold or granted to shareholders (includes common shares that were issued, repurchased and remain in the treasury). These shares represent capital invested by the firm's shareholders and owners, and may be all or only a portion of the number of shares authorized. Shares issued include shares outstanding and shares held in the treasury. Reference 1: http://fasb.org/us-gaap/role/ref/legacyRef
-Topic 210
-SubTopic 10
-Name Accounting Standards Codification
-Section S99
-Paragraph 1
-Subparagraph (SX 210.5-02(29))
-Publisher FASB
-URI https://asc.fasb.org/1943274/2147480566/210-10-S99-1
| Name: |
us-gaap_CommonStockSharesIssued |
| Namespace Prefix: |
us-gaap_ |
| Data Type: |
xbrli:sharesItemType |
| Balance Type: |
na |
| Period Type: |
instant |
|
| X |
- DefinitionNumber of shares of common stock outstanding. Common stock represent the ownership interest in a corporation. Reference 1: http://fasb.org/us-gaap/role/ref/legacyRef
-Name Accounting Standards Codification
-Section 50
-Paragraph 2
-SubTopic 10
-Topic 505
-Publisher FASB
-URI https://asc.fasb.org/1943274/2147481112/505-10-50-2
Reference 2: http://fasb.org/us-gaap/role/ref/legacyRef
-Topic 210
-SubTopic 10
-Name Accounting Standards Codification
-Section S99
-Paragraph 1
-Subparagraph (SX 210.5-02(29))
-Publisher FASB
-URI https://asc.fasb.org/1943274/2147480566/210-10-S99-1
Reference 3: http://www.xbrl.org/2003/role/disclosureRef
-Topic 946
-SubTopic 210
-Name Accounting Standards Codification
-Section S99
-Paragraph 2
-Subparagraph (SX 210.6-05(4))
-Publisher FASB
-URI https://asc.fasb.org/1943274/2147479170/946-210-S99-2
Reference 4: http://www.xbrl.org/2009/role/commonPracticeRef
-Topic 946
-SubTopic 220
-Name Accounting Standards Codification
-Section S99
-Paragraph 3
-Subparagraph (SX 210.6-09(4)(b))
-Publisher FASB
-URI https://asc.fasb.org/1943274/2147479134/946-220-S99-3
Reference 5: http://www.xbrl.org/2003/role/disclosureRef
-Topic 946
-SubTopic 210
-Name Accounting Standards Codification
-Section S99
-Paragraph 1
-Subparagraph (SX 210.6-04(16)(a))
-Publisher FASB
-URI https://asc.fasb.org/1943274/2147479170/946-210-S99-1
Reference 6: http://www.xbrl.org/2009/role/commonPracticeRef
-Topic 946
-SubTopic 220
-Name Accounting Standards Codification
-Section S99
-Paragraph 3
-Subparagraph (SX 210.6-09(7))
-Publisher FASB
-URI https://asc.fasb.org/1943274/2147479134/946-220-S99-3
| Name: |
us-gaap_CommonStockSharesOutstanding |
| Namespace Prefix: |
us-gaap_ |
| Data Type: |
xbrli:sharesItemType |
| Balance Type: |
na |
| Period Type: |
instant |
|
| X |
- DefinitionAccumulated amount of amortization of assets, excluding financial assets and goodwill, lacking physical substance with a finite life. Reference 1: http://www.xbrl.org/2003/role/exampleRef
-Topic 350
-SubTopic 30
-Name Accounting Standards Codification
-Section 55
-Paragraph 40
-Publisher FASB
-URI https://asc.fasb.org/1943274/2147482640/350-30-55-40
Reference 2: http://www.xbrl.org/2003/role/disclosureRef
-Topic 350
-SubTopic 10
-Name Accounting Standards Codification
-Section S45
-Paragraph 1
-Publisher FASB
-URI https://asc.fasb.org/1943274/2147480265/350-10-S45-1
Reference 3: http://www.xbrl.org/2003/role/disclosureRef
-Topic 350
-SubTopic 30
-Name Accounting Standards Codification
-Section 50
-Paragraph 2
-Subparagraph (a)(1)
-Publisher FASB
-URI https://asc.fasb.org/1943274/2147482665/350-30-50-2
Reference 4: http://www.xbrl.org/2003/role/disclosureRef
-Topic 210
-SubTopic 10
-Name Accounting Standards Codification
-Section S99
-Paragraph 1
-Subparagraph (SX 210.5-02(16))
-Publisher FASB
-URI https://asc.fasb.org/1943274/2147480566/210-10-S99-1
| Name: |
us-gaap_FiniteLivedIntangibleAssetsAccumulatedAmortization |
| Namespace Prefix: |
us-gaap_ |
| Data Type: |
xbrli:monetaryItemType |
| Balance Type: |
credit |
| Period Type: |
instant |
|
| X |
- DefinitionFace amount or stated value per share of preferred stock nonredeemable or redeemable solely at the option of the issuer. Reference 1: http://fasb.org/us-gaap/role/ref/legacyRef
-Topic 210
-SubTopic 10
-Name Accounting Standards Codification
-Section S99
-Paragraph 1
-Subparagraph (SX 210.5-02(28))
-Publisher FASB
-URI https://asc.fasb.org/1943274/2147480566/210-10-S99-1
Reference 2: http://www.xbrl.org/2003/role/disclosureRef
-Topic 505
-SubTopic 10
-Name Accounting Standards Codification
-Section 50
-Paragraph 13
-Subparagraph (a)
-Publisher FASB
-URI https://asc.fasb.org/1943274/2147481112/505-10-50-13
| Name: |
us-gaap_PreferredStockParOrStatedValuePerShare |
| Namespace Prefix: |
us-gaap_ |
| Data Type: |
dtr-types:perShareItemType |
| Balance Type: |
na |
| Period Type: |
instant |
|
| X |
- DefinitionThe maximum number of nonredeemable preferred shares (or preferred stock redeemable solely at the option of the issuer) permitted to be issued by an entity's charter and bylaws. Reference 1: http://fasb.org/us-gaap/role/ref/legacyRef
-Topic 210
-SubTopic 10
-Name Accounting Standards Codification
-Section S99
-Paragraph 1
-Subparagraph (SX 210.5-02(28))
-Publisher FASB
-URI https://asc.fasb.org/1943274/2147480566/210-10-S99-1
Reference 2: http://www.xbrl.org/2003/role/disclosureRef
-Topic 946
-SubTopic 210
-Name Accounting Standards Codification
-Section S99
-Paragraph 1
-Subparagraph (SX 210.6-04(16)(a))
-Publisher FASB
-URI https://asc.fasb.org/1943274/2147479170/946-210-S99-1
| Name: |
us-gaap_PreferredStockSharesAuthorized |
| Namespace Prefix: |
us-gaap_ |
| Data Type: |
xbrli:sharesItemType |
| Balance Type: |
na |
| Period Type: |
instant |
|
| X |
- DefinitionNumber of shares issued for nonredeemable preferred shares and preferred shares redeemable solely at option of issuer. Includes, but is not limited to, preferred shares issued, repurchased, and held as treasury shares. Excludes preferred shares classified as debt. Reference 1: http://fasb.org/us-gaap/role/ref/legacyRef
-Topic 210
-SubTopic 10
-Name Accounting Standards Codification
-Section S99
-Paragraph 1
-Subparagraph (SX 210.5-02(28))
-Publisher FASB
-URI https://asc.fasb.org/1943274/2147480566/210-10-S99-1
Reference 2: http://www.xbrl.org/2003/role/disclosureRef
-Topic 505
-SubTopic 10
-Name Accounting Standards Codification
-Section 50
-Paragraph 13
-Subparagraph (a)
-Publisher FASB
-URI https://asc.fasb.org/1943274/2147481112/505-10-50-13
| Name: |
us-gaap_PreferredStockSharesIssued |
| Namespace Prefix: |
us-gaap_ |
| Data Type: |
xbrli:sharesItemType |
| Balance Type: |
na |
| Period Type: |
instant |
|
| X |
- DefinitionAggregate share number for all nonredeemable preferred stock (or preferred stock redeemable solely at the option of the issuer) held by stockholders. Does not include preferred shares that have been repurchased. Reference 1: http://fasb.org/us-gaap/role/ref/legacyRef
-Topic 210
-SubTopic 10
-Name Accounting Standards Codification
-Section S99
-Paragraph 1
-Subparagraph (SX 210.5-02(28))
-Publisher FASB
-URI https://asc.fasb.org/1943274/2147480566/210-10-S99-1
Reference 2: http://www.xbrl.org/2003/role/disclosureRef
-Topic 946
-SubTopic 210
-Name Accounting Standards Codification
-Section S99
-Paragraph 2
-Subparagraph (SX 210.6-05(4))
-Publisher FASB
-URI https://asc.fasb.org/1943274/2147479170/946-210-S99-2
Reference 3: http://www.xbrl.org/2009/role/commonPracticeRef
-Topic 946
-SubTopic 220
-Name Accounting Standards Codification
-Section S99
-Paragraph 3
-Subparagraph (SX 210.6-09(4)(b))
-Publisher FASB
-URI https://asc.fasb.org/1943274/2147479134/946-220-S99-3
Reference 4: http://www.xbrl.org/2003/role/disclosureRef
-Topic 946
-SubTopic 210
-Name Accounting Standards Codification
-Section S99
-Paragraph 1
-Subparagraph (SX 210.6-04(16)(a))
-Publisher FASB
-URI https://asc.fasb.org/1943274/2147479170/946-210-S99-1
Reference 5: http://www.xbrl.org/2009/role/commonPracticeRef
-Topic 946
-SubTopic 220
-Name Accounting Standards Codification
-Section S99
-Paragraph 3
-Subparagraph (SX 210.6-09(7))
-Publisher FASB
-URI https://asc.fasb.org/1943274/2147479134/946-220-S99-3
| Name: |
us-gaap_PreferredStockSharesOutstanding |
| Namespace Prefix: |
us-gaap_ |
| Data Type: |
xbrli:sharesItemType |
| Balance Type: |
na |
| Period Type: |
instant |
|
| X |
- References
+ Details
| Name: |
us-gaap_StatementOfFinancialPositionAbstract |
| Namespace Prefix: |
us-gaap_ |
| Data Type: |
xbrli:stringItemType |
| Balance Type: |
na |
| Period Type: |
duration |
|
v3.24.2.u1
CONSOLIDATED STATEMENTS OF OPERATIONS (UNAUDITED) - USD ($)
shares in Thousands, $ in Thousands |
3 Months Ended |
6 Months Ended |
Jun. 30, 2024 |
Jun. 30, 2023 |
Jun. 30, 2024 |
Jun. 30, 2023 |
| CONSOLIDATED STATEMENTS OF OPERATIONS (UNAUDITED) |
|
|
|
|
| Revenues |
$ 7,687
|
$ 9,651
|
$ 14,649
|
$ 18,270
|
| Cost of revenues |
1,785
|
2,336
|
3,506
|
4,165
|
| Gross profit |
5,902
|
7,315
|
11,143
|
14,105
|
| Operating costs and expenses: |
|
|
|
|
| General and administrative |
2,164
|
2,274
|
3,983
|
4,606
|
| Sales and marketing expenses |
1,970
|
2,039
|
4,066
|
4,420
|
| Product development |
719
|
532
|
1,373
|
1,306
|
| Depreciation and amortization |
715
|
723
|
1,439
|
1,445
|
| Total operating costs and expenses |
5,568
|
5,568
|
10,861
|
11,777
|
| Operating income |
334
|
1,747
|
282
|
2,328
|
| Interest expense, net |
(294)
|
(281)
|
(570)
|
(519)
|
| Other income (expense), net |
14
|
379
|
219
|
(156)
|
| Income (loss) before taxes |
54
|
1,845
|
(69)
|
1,653
|
| Income tax expense |
47
|
482
|
63
|
434
|
| Net income (loss) |
$ 7
|
$ 1,363
|
$ (132)
|
$ 1,219
|
| Income (loss) per share - basic |
$ 0.00
|
$ 0.36
|
$ (0.03)
|
$ 0.32
|
| Income (loss) per share - fully diluted |
$ 0.00
|
$ 0.36
|
$ (0.03)
|
$ 0.32
|
| Weighted average number of common shares outstanding - basic |
3,821
|
3,795
|
3,818
|
3,793
|
| Weighted average number of common shares outstanding - fully diluted |
3,823
|
3,808
|
3,821
|
3,809
|
| X |
- DefinitionThe aggregate cost of goods produced and sold and services rendered during the reporting period. Reference 1: http://www.xbrl.org/2003/role/exampleRef
-Topic 280
-SubTopic 10
-Name Accounting Standards Codification
-Section 55
-Paragraph 48
-Publisher FASB
-URI https://asc.fasb.org/1943274/2147482785/280-10-55-48
Reference 2: http://fasb.org/us-gaap/role/ref/legacyRef
-Topic 220
-SubTopic 10
-Name Accounting Standards Codification
-Section S99
-Paragraph 2
-Subparagraph (SX 210.5-03(2))
-Publisher FASB
-URI https://asc.fasb.org/1943274/2147483621/220-10-S99-2
Reference 3: http://www.xbrl.org/2003/role/disclosureRef
-Topic 235
-SubTopic 10
-Name Accounting Standards Codification
-Section S99
-Paragraph 1
-Subparagraph (SX 210.4-08(g)(1)(ii))
-Publisher FASB
-URI https://asc.fasb.org/1943274/2147480678/235-10-S99-1
Reference 4: http://www.xbrl.org/2003/role/disclosureRef
-Topic 323
-SubTopic 10
-Name Accounting Standards Codification
-Section 50
-Paragraph 3
-Subparagraph (c)
-Publisher FASB
-URI https://asc.fasb.org/1943274/2147481687/323-10-50-3
Reference 5: http://www.xbrl.org/2003/role/disclosureRef
-Topic 825
-SubTopic 10
-Name Accounting Standards Codification
-Section 50
-Paragraph 28
-Subparagraph (f)
-Publisher FASB
-URI https://asc.fasb.org/1943274/2147482907/825-10-50-28
Reference 6: http://www.xbrl.org/2003/role/disclosureRef
-Topic 470
-SubTopic 10
-Name Accounting Standards Codification
-Section S99
-Paragraph 1A
-Subparagraph (SX 210.13-01(a)(4)(i))
-Publisher FASB
-URI https://asc.fasb.org/1943274/2147480097/470-10-S99-1A
Reference 7: http://www.xbrl.org/2009/role/commonPracticeRef
-Topic 470
-SubTopic 10
-Name Accounting Standards Codification
-Section S99
-Paragraph 1A
-Subparagraph (SX 210.13-01(a)(4)(ii))
-Publisher FASB
-URI https://asc.fasb.org/1943274/2147480097/470-10-S99-1A
Reference 8: http://www.xbrl.org/2003/role/disclosureRef
-Topic 470
-SubTopic 10
-Name Accounting Standards Codification
-Section S99
-Paragraph 1A
-Subparagraph (SX 210.13-01(a)(4)(iii)(A))
-Publisher FASB
-URI https://asc.fasb.org/1943274/2147480097/470-10-S99-1A
Reference 9: http://www.xbrl.org/2003/role/disclosureRef
-Topic 470
-SubTopic 10
-Name Accounting Standards Codification
-Section S99
-Paragraph 1A
-Subparagraph (SX 210.13-01(a)(4)(iv))
-Publisher FASB
-URI https://asc.fasb.org/1943274/2147480097/470-10-S99-1A
Reference 10: http://www.xbrl.org/2003/role/disclosureRef
-Topic 470
-SubTopic 10
-Name Accounting Standards Codification
-Section S99
-Paragraph 1A
-Subparagraph (SX 210.13-01(a)(5))
-Publisher FASB
-URI https://asc.fasb.org/1943274/2147480097/470-10-S99-1A
Reference 11: http://www.xbrl.org/2003/role/disclosureRef
-Topic 470
-SubTopic 10
-Name Accounting Standards Codification
-Section S99
-Paragraph 1B
-Subparagraph (SX 210.13-02(a)(4)(i))
-Publisher FASB
-URI https://asc.fasb.org/1943274/2147480097/470-10-S99-1B
Reference 12: http://www.xbrl.org/2003/role/disclosureRef
-Topic 470
-SubTopic 10
-Name Accounting Standards Codification
-Section S99
-Paragraph 1B
-Subparagraph (SX 210.13-02(a)(4)(iii)(A))
-Publisher FASB
-URI https://asc.fasb.org/1943274/2147480097/470-10-S99-1B
Reference 13: http://www.xbrl.org/2003/role/disclosureRef
-Topic 470
-SubTopic 10
-Name Accounting Standards Codification
-Section S99
-Paragraph 1B
-Subparagraph (SX 210.13-02(a)(4)(iii)(B))
-Publisher FASB
-URI https://asc.fasb.org/1943274/2147480097/470-10-S99-1B
Reference 14: http://www.xbrl.org/2003/role/disclosureRef
-Topic 470
-SubTopic 10
-Name Accounting Standards Codification
-Section S99
-Paragraph 1B
-Subparagraph (SX 210.13-02(a)(4)(iv))
-Publisher FASB
-URI https://asc.fasb.org/1943274/2147480097/470-10-S99-1B
Reference 15: http://www.xbrl.org/2003/role/disclosureRef
-Topic 470
-SubTopic 10
-Name Accounting Standards Codification
-Section S99
-Paragraph 1B
-Subparagraph (SX 210.13-02(a)(5))
-Publisher FASB
-URI https://asc.fasb.org/1943274/2147480097/470-10-S99-1B
| Name: |
us-gaap_CostOfRevenue |
| Namespace Prefix: |
us-gaap_ |
| Data Type: |
xbrli:monetaryItemType |
| Balance Type: |
debit |
| Period Type: |
duration |
|
| X |
- DefinitionThe current period expense charged against earnings on long-lived, physical assets not used in production, and which are not intended for resale, to allocate or recognize the cost of such assets over their useful lives; or to record the reduction in book value of an intangible asset over the benefit period of such asset; or to reflect consumption during the period of an asset that is not used in production. Reference 1: http://fasb.org/us-gaap/role/ref/legacyRef
-Name Accounting Standards Codification
-Section 45
-Paragraph 28
-Subparagraph (b)
-SubTopic 10
-Topic 230
-Publisher FASB
-URI https://asc.fasb.org/1943274/2147482740/230-10-45-28
Reference 2: http://fasb.org/us-gaap/role/ref/legacyRef
-Name Accounting Standards Codification
-Topic 360
-SubTopic 10
-Section 50
-Paragraph 1
-Subparagraph (a)
-Publisher FASB
-URI https://asc.fasb.org/1943274/2147482099/360-10-50-1
| Name: |
us-gaap_DepreciationAndAmortization |
| Namespace Prefix: |
us-gaap_ |
| Data Type: |
xbrli:monetaryItemType |
| Balance Type: |
debit |
| Period Type: |
duration |
|
| X |
- DefinitionThe amount of net income (loss) for the period per each share of common stock or unit outstanding during the reporting period. Reference 1: http://www.xbrl.org/2003/role/disclosureRef
-Topic 250
-SubTopic 10
-Name Accounting Standards Codification
-Section 50
-Paragraph 6
-Publisher FASB
-URI https://asc.fasb.org/1943274/2147483443/250-10-50-6
Reference 2: http://www.xbrl.org/2003/role/exampleRef
-Topic 260
-SubTopic 10
-Name Accounting Standards Codification
-Section 55
-Paragraph 52
-Publisher FASB
-URI https://asc.fasb.org/1943274/2147482635/260-10-55-52
Reference 3: http://www.xbrl.org/2003/role/disclosureRef
-Topic 805
-SubTopic 60
-Name Accounting Standards Codification
-Section 65
-Paragraph 1
-Subparagraph (g)
-Publisher FASB
-URI https://asc.fasb.org/1943274/2147476176/805-60-65-1
Reference 4: http://www.xbrl.org/2003/role/disclosureRef
-Topic 740
-SubTopic 323
-Name Accounting Standards Codification
-Section 65
-Paragraph 2
-Subparagraph (g)(3)
-Publisher FASB
-URI https://asc.fasb.org/1943274/2147478666/740-323-65-2
Reference 5: http://www.xbrl.org/2003/role/disclosureRef
-Topic 250
-SubTopic 10
-Name Accounting Standards Codification
-Section 50
-Paragraph 3
-Publisher FASB
-URI https://asc.fasb.org/1943274/2147483443/250-10-50-3
Reference 6: http://www.xbrl.org/2003/role/disclosureRef
-Topic 260
-SubTopic 10
-Name Accounting Standards Codification
-Section 55
-Paragraph 15
-Publisher FASB
-URI https://asc.fasb.org/1943274/2147482635/260-10-55-15
Reference 7: http://www.xbrl.org/2003/role/disclosureRef
-Topic 815
-SubTopic 40
-Name Accounting Standards Codification
-Section 65
-Paragraph 1
-Subparagraph (e)(4)
-Publisher FASB
-URI https://asc.fasb.org/1943274/2147480175/815-40-65-1
Reference 8: http://www.xbrl.org/2003/role/disclosureRef
-Topic 815
-SubTopic 40
-Name Accounting Standards Codification
-Section 65
-Paragraph 1
-Subparagraph (f)
-Publisher FASB
-URI https://asc.fasb.org/1943274/2147480175/815-40-65-1
Reference 9: http://www.xbrl.org/2003/role/disclosureRef
-Topic 250
-SubTopic 10
-Name Accounting Standards Codification
-Section 50
-Paragraph 11
-Subparagraph (a)
-Publisher FASB
-URI https://asc.fasb.org/1943274/2147483443/250-10-50-11
Reference 10: http://www.xbrl.org/2003/role/disclosureRef
-Topic 250
-SubTopic 10
-Name Accounting Standards Codification
-Section 50
-Paragraph 11
-Subparagraph (b)
-Publisher FASB
-URI https://asc.fasb.org/1943274/2147483443/250-10-50-11
Reference 11: http://www.xbrl.org/2003/role/disclosureRef
-Topic 250
-SubTopic 10
-Name Accounting Standards Codification
-Section 50
-Paragraph 7
-Subparagraph (a)
-Publisher FASB
-URI https://asc.fasb.org/1943274/2147483443/250-10-50-7
Reference 12: http://www.xbrl.org/2003/role/disclosureRef
-Topic 260
-SubTopic 10
-Name Accounting Standards Codification
-Section 45
-Paragraph 2
-Publisher FASB
-URI https://asc.fasb.org/1943274/2147482689/260-10-45-2
Reference 13: http://www.xbrl.org/2003/role/disclosureRef
-Topic 260
-SubTopic 10
-Name Accounting Standards Codification
-Section 45
-Paragraph 60B
-Subparagraph (d)
-Publisher FASB
-URI https://asc.fasb.org/1943274/2147482689/260-10-45-60B
Reference 14: http://www.xbrl.org/2003/role/disclosureRef
-Topic 250
-SubTopic 10
-Name Accounting Standards Codification
-Section 50
-Paragraph 4
-Publisher FASB
-URI https://asc.fasb.org/1943274/2147483443/250-10-50-4
Reference 15: http://www.xbrl.org/2003/role/disclosureRef
-Topic 260
-SubTopic 10
-Name Accounting Standards Codification
-Section 50
-Paragraph 1
-Subparagraph (a)
-Publisher FASB
-URI https://asc.fasb.org/1943274/2147482662/260-10-50-1
Reference 16: http://www.xbrl.org/2003/role/disclosureRef
-Topic 260
-SubTopic 10
-Name Accounting Standards Codification
-Section 45
-Paragraph 10
-Publisher FASB
-URI https://asc.fasb.org/1943274/2147482689/260-10-45-10
Reference 17: http://www.xbrl.org/2003/role/disclosureRef
-Topic 220
-SubTopic 10
-Name Accounting Standards Codification
-Section S99
-Paragraph 2
-Subparagraph (SX 210.5-03(25))
-Publisher FASB
-URI https://asc.fasb.org/1943274/2147483621/220-10-S99-2
Reference 18: http://www.xbrl.org/2003/role/disclosureRef
-Topic 942
-SubTopic 220
-Name Accounting Standards Codification
-Section S99
-Paragraph 1
-Subparagraph (SX 210.9-04(27))
-Publisher FASB
-URI https://asc.fasb.org/1943274/2147478524/942-220-S99-1
Reference 19: http://www.xbrl.org/2003/role/disclosureRef
-Topic 944
-SubTopic 220
-Name Accounting Standards Codification
-Section S99
-Paragraph 1
-Subparagraph (SX 210.7-04(23))
-Publisher FASB
-URI https://asc.fasb.org/1943274/2147477250/944-220-S99-1
Reference 20: http://www.xbrl.org/2003/role/disclosureRef
-Topic 260
-SubTopic 10
-Name Accounting Standards Codification
-Section 45
-Paragraph 7
-Publisher FASB
-URI https://asc.fasb.org/1943274/2147482689/260-10-45-7
| Name: |
us-gaap_EarningsPerShareBasic |
| Namespace Prefix: |
us-gaap_ |
| Data Type: |
dtr-types:perShareItemType |
| Balance Type: |
na |
| Period Type: |
duration |
|
| X |
- DefinitionThe amount of net income (loss) for the period available to each share of common stock or common unit outstanding during the reporting period and to each share or unit that would have been outstanding assuming the issuance of common shares or units for all dilutive potential common shares or units outstanding during the reporting period. Reference 1: http://www.xbrl.org/2003/role/disclosureRef
-Topic 250
-SubTopic 10
-Name Accounting Standards Codification
-Section 50
-Paragraph 6
-Publisher FASB
-URI https://asc.fasb.org/1943274/2147483443/250-10-50-6
Reference 2: http://www.xbrl.org/2003/role/exampleRef
-Topic 260
-SubTopic 10
-Name Accounting Standards Codification
-Section 55
-Paragraph 52
-Publisher FASB
-URI https://asc.fasb.org/1943274/2147482635/260-10-55-52
Reference 3: http://www.xbrl.org/2003/role/disclosureRef
-Topic 805
-SubTopic 60
-Name Accounting Standards Codification
-Section 65
-Paragraph 1
-Subparagraph (g)
-Publisher FASB
-URI https://asc.fasb.org/1943274/2147476176/805-60-65-1
Reference 4: http://www.xbrl.org/2003/role/disclosureRef
-Topic 740
-SubTopic 323
-Name Accounting Standards Codification
-Section 65
-Paragraph 2
-Subparagraph (g)(3)
-Publisher FASB
-URI https://asc.fasb.org/1943274/2147478666/740-323-65-2
Reference 5: http://www.xbrl.org/2003/role/disclosureRef
-Topic 250
-SubTopic 10
-Name Accounting Standards Codification
-Section 50
-Paragraph 3
-Publisher FASB
-URI https://asc.fasb.org/1943274/2147483443/250-10-50-3
Reference 6: http://www.xbrl.org/2003/role/disclosureRef
-Topic 260
-SubTopic 10
-Name Accounting Standards Codification
-Section 55
-Paragraph 15
-Publisher FASB
-URI https://asc.fasb.org/1943274/2147482635/260-10-55-15
Reference 7: http://www.xbrl.org/2003/role/disclosureRef
-Topic 815
-SubTopic 40
-Name Accounting Standards Codification
-Section 65
-Paragraph 1
-Subparagraph (e)(4)
-Publisher FASB
-URI https://asc.fasb.org/1943274/2147480175/815-40-65-1
Reference 8: http://www.xbrl.org/2003/role/disclosureRef
-Topic 815
-SubTopic 40
-Name Accounting Standards Codification
-Section 65
-Paragraph 1
-Subparagraph (f)
-Publisher FASB
-URI https://asc.fasb.org/1943274/2147480175/815-40-65-1
Reference 9: http://www.xbrl.org/2003/role/disclosureRef
-Topic 250
-SubTopic 10
-Name Accounting Standards Codification
-Section 50
-Paragraph 11
-Subparagraph (a)
-Publisher FASB
-URI https://asc.fasb.org/1943274/2147483443/250-10-50-11
Reference 10: http://www.xbrl.org/2003/role/disclosureRef
-Topic 250
-SubTopic 10
-Name Accounting Standards Codification
-Section 50
-Paragraph 11
-Subparagraph (b)
-Publisher FASB
-URI https://asc.fasb.org/1943274/2147483443/250-10-50-11
Reference 11: http://www.xbrl.org/2003/role/disclosureRef
-Topic 250
-SubTopic 10
-Name Accounting Standards Codification
-Section 50
-Paragraph 7
-Subparagraph (a)
-Publisher FASB
-URI https://asc.fasb.org/1943274/2147483443/250-10-50-7
Reference 12: http://www.xbrl.org/2003/role/disclosureRef
-Topic 260
-SubTopic 10
-Name Accounting Standards Codification
-Section 45
-Paragraph 2
-Publisher FASB
-URI https://asc.fasb.org/1943274/2147482689/260-10-45-2
Reference 13: http://www.xbrl.org/2003/role/disclosureRef
-Topic 260
-SubTopic 10
-Name Accounting Standards Codification
-Section 45
-Paragraph 60B
-Subparagraph (d)
-Publisher FASB
-URI https://asc.fasb.org/1943274/2147482689/260-10-45-60B
Reference 14: http://www.xbrl.org/2003/role/disclosureRef
-Topic 250
-SubTopic 10
-Name Accounting Standards Codification
-Section 50
-Paragraph 4
-Publisher FASB
-URI https://asc.fasb.org/1943274/2147483443/250-10-50-4
Reference 15: http://www.xbrl.org/2003/role/disclosureRef
-Topic 260
-SubTopic 10
-Name Accounting Standards Codification
-Section 50
-Paragraph 1
-Subparagraph (a)
-Publisher FASB
-URI https://asc.fasb.org/1943274/2147482662/260-10-50-1
Reference 16: http://www.xbrl.org/2003/role/disclosureRef
-Topic 220
-SubTopic 10
-Name Accounting Standards Codification
-Section S99
-Paragraph 2
-Subparagraph (SX 210.5-03(25))
-Publisher FASB
-URI https://asc.fasb.org/1943274/2147483621/220-10-S99-2
Reference 17: http://www.xbrl.org/2003/role/disclosureRef
-Topic 942
-SubTopic 220
-Name Accounting Standards Codification
-Section S99
-Paragraph 1
-Subparagraph (SX 210.9-04(27))
-Publisher FASB
-URI https://asc.fasb.org/1943274/2147478524/942-220-S99-1
Reference 18: http://www.xbrl.org/2003/role/disclosureRef
-Topic 944
-SubTopic 220
-Name Accounting Standards Codification
-Section S99
-Paragraph 1
-Subparagraph (SX 210.7-04(23))
-Publisher FASB
-URI https://asc.fasb.org/1943274/2147477250/944-220-S99-1
Reference 19: http://www.xbrl.org/2003/role/disclosureRef
-Topic 260
-SubTopic 10
-Name Accounting Standards Codification
-Section 45
-Paragraph 7
-Publisher FASB
-URI https://asc.fasb.org/1943274/2147482689/260-10-45-7
| Name: |
us-gaap_EarningsPerShareDiluted |
| Namespace Prefix: |
us-gaap_ |
| Data Type: |
dtr-types:perShareItemType |
| Balance Type: |
na |
| Period Type: |
duration |
|
| X |
- DefinitionThe aggregate total of expenses of managing and administering the affairs of an entity, including affiliates of the reporting entity, which are not directly or indirectly associated with the manufacture, sale or creation of a product or product line. Reference 1: http://fasb.org/us-gaap/role/ref/legacyRef
-Topic 220
-SubTopic 10
-Name Accounting Standards Codification
-Section S99
-Paragraph 2
-Subparagraph (SX 210.5-03(4))
-Publisher FASB
-URI https://asc.fasb.org/1943274/2147483621/220-10-S99-2
Reference 2: http://www.xbrl.org/2003/role/disclosureRef
-Topic 946
-SubTopic 220
-Name Accounting Standards Codification
-Section S99
-Paragraph 1
-Subparagraph (SX 210.6-07(2)(a))
-Publisher FASB
-URI https://asc.fasb.org/1943274/2147479134/946-220-S99-1
| Name: |
us-gaap_GeneralAndAdministrativeExpense |
| Namespace Prefix: |
us-gaap_ |
| Data Type: |
xbrli:monetaryItemType |
| Balance Type: |
debit |
| Period Type: |
duration |
|
| X |
- DefinitionAggregate revenue less cost of goods and services sold or operating expenses directly attributable to the revenue generation activity. Reference 1: http://www.xbrl.org/2009/role/commonPracticeRef
-Topic 280
-SubTopic 10
-Name Accounting Standards Codification
-Section 50
-Paragraph 22
-Publisher FASB
-URI https://asc.fasb.org/1943274/2147482810/280-10-50-22
Reference 2: http://www.xbrl.org/2003/role/exampleRef
-Topic 280
-SubTopic 10
-Name Accounting Standards Codification
-Section 55
-Paragraph 48
-Publisher FASB
-URI https://asc.fasb.org/1943274/2147482785/280-10-55-48
Reference 3: http://www.xbrl.org/2009/role/commonPracticeRef
-Topic 280
-SubTopic 10
-Name Accounting Standards Codification
-Section 50
-Paragraph 32
-Subparagraph (f)
-Publisher FASB
-URI https://asc.fasb.org/1943274/2147482810/280-10-50-32
Reference 4: http://www.xbrl.org/2009/role/commonPracticeRef
-Topic 280
-SubTopic 10
-Name Accounting Standards Codification
-Section 50
-Paragraph 30
-Subparagraph (b)
-Publisher FASB
-URI https://asc.fasb.org/1943274/2147482810/280-10-50-30
Reference 5: http://www.xbrl.org/2009/role/commonPracticeRef
-Topic 270
-SubTopic 10
-Name Accounting Standards Codification
-Section 50
-Paragraph 1
-Subparagraph (i)
-Publisher FASB
-URI https://asc.fasb.org/1943274/2147482964/270-10-50-1
Reference 6: http://www.xbrl.org/2009/role/commonPracticeRef
-Topic 280
-SubTopic 10
-Name Accounting Standards Codification
-Section 50
-Paragraph 32
-Subparagraph (ee)
-Publisher FASB
-URI https://asc.fasb.org/1943274/2147482810/280-10-50-32
Reference 7: http://fasb.org/us-gaap/role/ref/otherTransitionRef
-Topic 280
-SubTopic 10
-Name Accounting Standards Codification
-Section 50
-Paragraph 32
-Subparagraph (c)
-Publisher FASB
-URI https://asc.fasb.org/1943274/2147482810/280-10-50-32
Reference 8: http://fasb.org/us-gaap/role/ref/legacyRef
-Topic 220
-SubTopic 10
-Name Accounting Standards Codification
-Section S99
-Paragraph 2
-Subparagraph (SX 210.5-03(2))
-Publisher FASB
-URI https://asc.fasb.org/1943274/2147483621/220-10-S99-2
Reference 9: http://fasb.org/us-gaap/role/ref/legacyRef
-Topic 220
-SubTopic 10
-Name Accounting Standards Codification
-Section S99
-Paragraph 2
-Subparagraph (SX 210.5-03(1))
-Publisher FASB
-URI https://asc.fasb.org/1943274/2147483621/220-10-S99-2
Reference 10: http://www.xbrl.org/2003/role/disclosureRef
-Topic 235
-SubTopic 10
-Name Accounting Standards Codification
-Section S99
-Paragraph 1
-Subparagraph (SX 210.4-08(g)(1)(ii))
-Publisher FASB
-URI https://asc.fasb.org/1943274/2147480678/235-10-S99-1
Reference 11: http://www.xbrl.org/2003/role/disclosureRef
-Topic 323
-SubTopic 10
-Name Accounting Standards Codification
-Section 50
-Paragraph 3
-Subparagraph (c)
-Publisher FASB
-URI https://asc.fasb.org/1943274/2147481687/323-10-50-3
Reference 12: http://www.xbrl.org/2003/role/disclosureRef
-Topic 825
-SubTopic 10
-Name Accounting Standards Codification
-Section 50
-Paragraph 28
-Subparagraph (f)
-Publisher FASB
-URI https://asc.fasb.org/1943274/2147482907/825-10-50-28
Reference 13: http://www.xbrl.org/2003/role/disclosureRef
-Topic 470
-SubTopic 10
-Name Accounting Standards Codification
-Section S99
-Paragraph 1A
-Subparagraph (SX 210.13-01(a)(4)(i))
-Publisher FASB
-URI https://asc.fasb.org/1943274/2147480097/470-10-S99-1A
Reference 14: http://www.xbrl.org/2009/role/commonPracticeRef
-Topic 470
-SubTopic 10
-Name Accounting Standards Codification
-Section S99
-Paragraph 1A
-Subparagraph (SX 210.13-01(a)(4)(ii))
-Publisher FASB
-URI https://asc.fasb.org/1943274/2147480097/470-10-S99-1A
Reference 15: http://www.xbrl.org/2003/role/disclosureRef
-Topic 470
-SubTopic 10
-Name Accounting Standards Codification
-Section S99
-Paragraph 1A
-Subparagraph (SX 210.13-01(a)(4)(iii)(A))
-Publisher FASB
-URI https://asc.fasb.org/1943274/2147480097/470-10-S99-1A
Reference 16: http://www.xbrl.org/2003/role/disclosureRef
-Topic 470
-SubTopic 10
-Name Accounting Standards Codification
-Section S99
-Paragraph 1A
-Subparagraph (SX 210.13-01(a)(4)(iv))
-Publisher FASB
-URI https://asc.fasb.org/1943274/2147480097/470-10-S99-1A
Reference 17: http://www.xbrl.org/2003/role/disclosureRef
-Topic 470
-SubTopic 10
-Name Accounting Standards Codification
-Section S99
-Paragraph 1A
-Subparagraph (SX 210.13-01(a)(5))
-Publisher FASB
-URI https://asc.fasb.org/1943274/2147480097/470-10-S99-1A
Reference 18: http://www.xbrl.org/2003/role/disclosureRef
-Topic 470
-SubTopic 10
-Name Accounting Standards Codification
-Section S99
-Paragraph 1B
-Subparagraph (SX 210.13-02(a)(4)(i))
-Publisher FASB
-URI https://asc.fasb.org/1943274/2147480097/470-10-S99-1B
Reference 19: http://www.xbrl.org/2003/role/disclosureRef
-Topic 470
-SubTopic 10
-Name Accounting Standards Codification
-Section S99
-Paragraph 1B
-Subparagraph (SX 210.13-02(a)(4)(iii)(A))
-Publisher FASB
-URI https://asc.fasb.org/1943274/2147480097/470-10-S99-1B
Reference 20: http://www.xbrl.org/2003/role/disclosureRef
-Topic 470
-SubTopic 10
-Name Accounting Standards Codification
-Section S99
-Paragraph 1B
-Subparagraph (SX 210.13-02(a)(4)(iii)(B))
-Publisher FASB
-URI https://asc.fasb.org/1943274/2147480097/470-10-S99-1B
Reference 21: http://www.xbrl.org/2003/role/disclosureRef
-Topic 470
-SubTopic 10
-Name Accounting Standards Codification
-Section S99
-Paragraph 1B
-Subparagraph (SX 210.13-02(a)(4)(iv))
-Publisher FASB
-URI https://asc.fasb.org/1943274/2147480097/470-10-S99-1B
Reference 22: http://www.xbrl.org/2003/role/disclosureRef
-Topic 470
-SubTopic 10
-Name Accounting Standards Codification
-Section S99
-Paragraph 1B
-Subparagraph (SX 210.13-02(a)(5))
-Publisher FASB
-URI https://asc.fasb.org/1943274/2147480097/470-10-S99-1B
Reference 23: http://www.xbrl.org/2003/role/exampleRef
-Topic 280
-SubTopic 10
-Name Accounting Standards Codification
-Section 50
-Paragraph 31
-Publisher FASB
-URI https://asc.fasb.org/1943274/2147482810/280-10-50-31
| Name: |
us-gaap_GrossProfit |
| Namespace Prefix: |
us-gaap_ |
| Data Type: |
xbrli:monetaryItemType |
| Balance Type: |
credit |
| Period Type: |
duration |
|
| X |
- References
+ Details
| Name: |
us-gaap_IncomeStatementAbstract |
| Namespace Prefix: |
us-gaap_ |
| Data Type: |
xbrli:stringItemType |
| Balance Type: |
na |
| Period Type: |
duration |
|
| X |
- DefinitionAmount of interest income (expense) classified as operating. Reference 1: http://www.xbrl.org/2009/role/commonPracticeRef
-Topic 280
-SubTopic 10
-Name Accounting Standards Codification
-Section 50
-Paragraph 22
-Publisher FASB
-URI https://asc.fasb.org/1943274/2147482810/280-10-50-22
Reference 2: http://www.xbrl.org/2003/role/disclosureRef
-Topic 942
-SubTopic 220
-Name Accounting Standards Codification
-Section S99
-Paragraph 1
-Subparagraph (SX 210.9-04(10))
-Publisher FASB
-URI https://asc.fasb.org/1943274/2147478524/942-220-S99-1
| Name: |
us-gaap_InterestIncomeExpenseNet |
| Namespace Prefix: |
us-gaap_ |
| Data Type: |
xbrli:monetaryItemType |
| Balance Type: |
credit |
| Period Type: |
duration |
|
| X |
- DefinitionThe portion of profit or loss for the period, net of income taxes, which is attributable to the parent. Reference 1: http://www.xbrl.org/2003/role/disclosureRef
-Topic 250
-SubTopic 10
-Name Accounting Standards Codification
-Section 50
-Paragraph 6
-Publisher FASB
-URI https://asc.fasb.org/1943274/2147483443/250-10-50-6
Reference 2: http://www.xbrl.org/2003/role/disclosureRef
-Topic 250
-SubTopic 10
-Name Accounting Standards Codification
-Section 50
-Paragraph 9
-Publisher FASB
-URI https://asc.fasb.org/1943274/2147483443/250-10-50-9
Reference 3: http://www.xbrl.org/2003/role/disclosureRef
-Topic 805
-SubTopic 60
-Name Accounting Standards Codification
-Section 65
-Paragraph 1
-Subparagraph (g)
-Publisher FASB
-URI https://asc.fasb.org/1943274/2147476176/805-60-65-1
Reference 4: http://www.xbrl.org/2003/role/disclosureRef
-Topic 740
-SubTopic 323
-Name Accounting Standards Codification
-Section 65
-Paragraph 2
-Subparagraph (g)(3)
-Publisher FASB
-URI https://asc.fasb.org/1943274/2147478666/740-323-65-2
Reference 5: http://fasb.org/us-gaap/role/ref/legacyRef
-Topic 220
-SubTopic 10
-Name Accounting Standards Codification
-Section S99
-Paragraph 2
-Subparagraph (SX 210.5-03(20))
-Publisher FASB
-URI https://asc.fasb.org/1943274/2147483621/220-10-S99-2
Reference 6: http://www.xbrl.org/2003/role/disclosureRef
-Topic 235
-SubTopic 10
-Name Accounting Standards Codification
-Section S99
-Paragraph 1
-Subparagraph (SX 210.4-08(g)(1)(ii))
-Publisher FASB
-URI https://asc.fasb.org/1943274/2147480678/235-10-S99-1
Reference 7: http://www.xbrl.org/2003/role/disclosureRef
-Topic 323
-SubTopic 10
-Name Accounting Standards Codification
-Section 50
-Paragraph 3
-Subparagraph (c)
-Publisher FASB
-URI https://asc.fasb.org/1943274/2147481687/323-10-50-3
Reference 8: http://www.xbrl.org/2003/role/disclosureRef
-Topic 825
-SubTopic 10
-Name Accounting Standards Codification
-Section 50
-Paragraph 28
-Subparagraph (f)
-Publisher FASB
-URI https://asc.fasb.org/1943274/2147482907/825-10-50-28
Reference 9: http://www.xbrl.org/2003/role/disclosureRef
-Topic 220
-SubTopic 10
-Name Accounting Standards Codification
-Section 50
-Paragraph 6
-Publisher FASB
-URI https://asc.fasb.org/1943274/2147482765/220-10-50-6
Reference 10: http://www.xbrl.org/2003/role/disclosureRef
-Topic 250
-SubTopic 10
-Name Accounting Standards Codification
-Section 50
-Paragraph 3
-Publisher FASB
-URI https://asc.fasb.org/1943274/2147483443/250-10-50-3
Reference 11: http://www.xbrl.org/2003/role/disclosureRef
-Topic 250
-SubTopic 10
-Name Accounting Standards Codification
-Section 50
-Paragraph 1
-Subparagraph (b)(2)
-Publisher FASB
-URI https://asc.fasb.org/1943274/2147483443/250-10-50-1
Reference 12: http://www.xbrl.org/2003/role/disclosureRef
-Topic 815
-SubTopic 40
-Name Accounting Standards Codification
-Section 65
-Paragraph 1
-Subparagraph (f)
-Publisher FASB
-URI https://asc.fasb.org/1943274/2147480175/815-40-65-1
Reference 13: http://www.xbrl.org/2003/role/disclosureRef
-Topic 250
-SubTopic 10
-Name Accounting Standards Codification
-Section 50
-Paragraph 8
-Publisher FASB
-URI https://asc.fasb.org/1943274/2147483443/250-10-50-8
Reference 14: http://www.xbrl.org/2003/role/disclosureRef
-Topic 250
-SubTopic 10
-Name Accounting Standards Codification
-Section 50
-Paragraph 11
-Subparagraph (a)
-Publisher FASB
-URI https://asc.fasb.org/1943274/2147483443/250-10-50-11
Reference 15: http://www.xbrl.org/2003/role/disclosureRef
-Topic 250
-SubTopic 10
-Name Accounting Standards Codification
-Section 50
-Paragraph 11
-Subparagraph (b)
-Publisher FASB
-URI https://asc.fasb.org/1943274/2147483443/250-10-50-11
Reference 16: http://www.xbrl.org/2003/role/disclosureRef
-Topic 250
-SubTopic 10
-Name Accounting Standards Codification
-Section 50
-Paragraph 4
-Publisher FASB
-URI https://asc.fasb.org/1943274/2147483443/250-10-50-4
Reference 17: http://www.xbrl.org/2003/role/exampleRef
-Topic 946
-SubTopic 830
-Name Accounting Standards Codification
-Section 55
-Paragraph 10
-Publisher FASB
-URI https://asc.fasb.org/1943274/2147479168/946-830-55-10
Reference 18: http://www.xbrl.org/2003/role/disclosureRef
-Topic 946
-SubTopic 220
-Name Accounting Standards Codification
-Section 45
-Paragraph 7
-Publisher FASB
-URI https://asc.fasb.org/1943274/2147479105/946-220-45-7
Reference 19: http://www.xbrl.org/2003/role/disclosureRef
-Topic 944
-SubTopic 220
-Name Accounting Standards Codification
-Section S99
-Paragraph 1
-Subparagraph (SX 210.7-04(18))
-Publisher FASB
-URI https://asc.fasb.org/1943274/2147477250/944-220-S99-1
Reference 20: http://www.xbrl.org/2003/role/disclosureRef
-Topic 946
-SubTopic 220
-Name Accounting Standards Codification
-Section S99
-Paragraph 1
-Subparagraph (SX 210.6-07(9))
-Publisher FASB
-URI https://asc.fasb.org/1943274/2147479134/946-220-S99-1
Reference 21: http://www.xbrl.org/2003/role/disclosureRef
-Topic 946
-SubTopic 220
-Name Accounting Standards Codification
-Section S99
-Paragraph 3
-Subparagraph (SX 210.6-09(1)(d))
-Publisher FASB
-URI https://asc.fasb.org/1943274/2147479134/946-220-S99-3
Reference 22: http://www.xbrl.org/2003/role/disclosureRef
-Topic 470
-SubTopic 10
-Name Accounting Standards Codification
-Section S99
-Paragraph 1A
-Subparagraph (SX 210.13-01(a)(4)(i))
-Publisher FASB
-URI https://asc.fasb.org/1943274/2147480097/470-10-S99-1A
Reference 23: http://www.xbrl.org/2009/role/commonPracticeRef
-Topic 470
-SubTopic 10
-Name Accounting Standards Codification
-Section S99
-Paragraph 1A
-Subparagraph (SX 210.13-01(a)(4)(ii))
-Publisher FASB
-URI https://asc.fasb.org/1943274/2147480097/470-10-S99-1A
Reference 24: http://www.xbrl.org/2003/role/disclosureRef
-Topic 470
-SubTopic 10
-Name Accounting Standards Codification
-Section S99
-Paragraph 1A
-Subparagraph (SX 210.13-01(a)(4)(iii)(A))
-Publisher FASB
-URI https://asc.fasb.org/1943274/2147480097/470-10-S99-1A
Reference 25: http://www.xbrl.org/2003/role/disclosureRef
-Topic 470
-SubTopic 10
-Name Accounting Standards Codification
-Section S99
-Paragraph 1A
-Subparagraph (SX 210.13-01(a)(4)(iv))
-Publisher FASB
-URI https://asc.fasb.org/1943274/2147480097/470-10-S99-1A
Reference 26: http://www.xbrl.org/2003/role/disclosureRef
-Topic 470
-SubTopic 10
-Name Accounting Standards Codification
-Section S99
-Paragraph 1A
-Subparagraph (SX 210.13-01(a)(5))
-Publisher FASB
-URI https://asc.fasb.org/1943274/2147480097/470-10-S99-1A
Reference 27: http://www.xbrl.org/2003/role/disclosureRef
-Topic 470
-SubTopic 10
-Name Accounting Standards Codification
-Section S99
-Paragraph 1B
-Subparagraph (SX 210.13-02(a)(4)(i))
-Publisher FASB
-URI https://asc.fasb.org/1943274/2147480097/470-10-S99-1B
Reference 28: http://www.xbrl.org/2003/role/disclosureRef
-Topic 470
-SubTopic 10
-Name Accounting Standards Codification
-Section S99
-Paragraph 1B
-Subparagraph (SX 210.13-02(a)(4)(iii)(A))
-Publisher FASB
-URI https://asc.fasb.org/1943274/2147480097/470-10-S99-1B
Reference 29: http://www.xbrl.org/2003/role/disclosureRef
-Topic 470
-SubTopic 10
-Name Accounting Standards Codification
-Section S99
-Paragraph 1B
-Subparagraph (SX 210.13-02(a)(4)(iii)(B))
-Publisher FASB
-URI https://asc.fasb.org/1943274/2147480097/470-10-S99-1B
Reference 30: http://www.xbrl.org/2003/role/disclosureRef
-Topic 470
-SubTopic 10
-Name Accounting Standards Codification
-Section S99
-Paragraph 1B
-Subparagraph (SX 210.13-02(a)(4)(iv))
-Publisher FASB
-URI https://asc.fasb.org/1943274/2147480097/470-10-S99-1B
Reference 31: http://www.xbrl.org/2003/role/disclosureRef
-Topic 470
-SubTopic 10
-Name Accounting Standards Codification
-Section S99
-Paragraph 1B
-Subparagraph (SX 210.13-02(a)(5))
-Publisher FASB
-URI https://asc.fasb.org/1943274/2147480097/470-10-S99-1B
Reference 32: http://www.xbrl.org/2003/role/disclosureRef
-Topic 260
-SubTopic 10
-Name Accounting Standards Codification
-Section 45
-Paragraph 60B
-Subparagraph (a)
-Publisher FASB
-URI https://asc.fasb.org/1943274/2147482689/260-10-45-60B
Reference 33: http://www.xbrl.org/2003/role/disclosureRef
-Topic 205
-SubTopic 20
-Name Accounting Standards Codification
-Section 50
-Paragraph 7
-Publisher FASB
-URI https://asc.fasb.org/1943274/2147483499/205-20-50-7
Reference 34: http://fasb.org/us-gaap/role/ref/legacyRef
-Topic 230
-SubTopic 10
-Name Accounting Standards Codification
-Section 45
-Paragraph 28
-Publisher FASB
-URI https://asc.fasb.org/1943274/2147482740/230-10-45-28
Reference 35: http://www.xbrl.org/2003/role/disclosureRef
-Topic 220
-SubTopic 10
-Name Accounting Standards Codification
-Section 45
-Paragraph 1A
-Subparagraph (a)
-Publisher FASB
-URI https://asc.fasb.org/1943274/2147482790/220-10-45-1A
Reference 36: http://www.xbrl.org/2003/role/disclosureRef
-Topic 220
-SubTopic 10
-Name Accounting Standards Codification
-Section 45
-Paragraph 1B
-Subparagraph (a)
-Publisher FASB
-URI https://asc.fasb.org/1943274/2147482790/220-10-45-1B
Reference 37: http://fasb.org/us-gaap/role/ref/legacyRef
-Topic 942
-SubTopic 220
-Name Accounting Standards Codification
-Section S99
-Paragraph 1
-Subparagraph (SX 210.9-04(22))
-Publisher FASB
-URI https://asc.fasb.org/1943274/2147478524/942-220-S99-1
| Name: |
us-gaap_NetIncomeLoss |
| Namespace Prefix: |
us-gaap_ |
| Data Type: |
xbrli:monetaryItemType |
| Balance Type: |
credit |
| Period Type: |
duration |
|
| X |
- References
+ Details
| Name: |
us-gaap_OperatingCostsAndExpensesAbstract |
| Namespace Prefix: |
us-gaap_ |
| Data Type: |
xbrli:stringItemType |
| Balance Type: |
na |
| Period Type: |
duration |
|
| X |
- DefinitionGenerally recurring costs associated with normal operations except for the portion of these expenses which can be clearly related to production and included in cost of sales or services. Includes selling, general and administrative expense.
| Name: |
us-gaap_OperatingExpenses |
| Namespace Prefix: |
us-gaap_ |
| Data Type: |
xbrli:monetaryItemType |
| Balance Type: |
debit |
| Period Type: |
duration |
|
| X |
- DefinitionThe net result for the period of deducting operating expenses from operating revenues. Reference 1: http://www.xbrl.org/2009/role/commonPracticeRef
-Topic 280
-SubTopic 10
-Name Accounting Standards Codification
-Section 50
-Paragraph 22
-Publisher FASB
-URI https://asc.fasb.org/1943274/2147482810/280-10-50-22
Reference 2: http://www.xbrl.org/2009/role/commonPracticeRef
-Topic 280
-SubTopic 10
-Name Accounting Standards Codification
-Section 50
-Paragraph 32
-Subparagraph (f)
-Publisher FASB
-URI https://asc.fasb.org/1943274/2147482810/280-10-50-32
Reference 3: http://www.xbrl.org/2009/role/commonPracticeRef
-Topic 280
-SubTopic 10
-Name Accounting Standards Codification
-Section 50
-Paragraph 30
-Subparagraph (b)
-Publisher FASB
-URI https://asc.fasb.org/1943274/2147482810/280-10-50-30
Reference 4: http://www.xbrl.org/2009/role/commonPracticeRef
-Topic 270
-SubTopic 10
-Name Accounting Standards Codification
-Section 50
-Paragraph 1
-Subparagraph (i)
-Publisher FASB
-URI https://asc.fasb.org/1943274/2147482964/270-10-50-1
Reference 5: http://www.xbrl.org/2009/role/commonPracticeRef
-Topic 280
-SubTopic 10
-Name Accounting Standards Codification
-Section 50
-Paragraph 32
-Subparagraph (ee)
-Publisher FASB
-URI https://asc.fasb.org/1943274/2147482810/280-10-50-32
Reference 6: http://fasb.org/us-gaap/role/ref/otherTransitionRef
-Topic 280
-SubTopic 10
-Name Accounting Standards Codification
-Section 50
-Paragraph 32
-Subparagraph (c)
-Publisher FASB
-URI https://asc.fasb.org/1943274/2147482810/280-10-50-32
Reference 7: http://www.xbrl.org/2003/role/exampleRef
-Topic 280
-SubTopic 10
-Name Accounting Standards Codification
-Section 50
-Paragraph 31
-Publisher FASB
-URI https://asc.fasb.org/1943274/2147482810/280-10-50-31
| Name: |
us-gaap_OperatingIncomeLoss |
| Namespace Prefix: |
us-gaap_ |
| Data Type: |
xbrli:monetaryItemType |
| Balance Type: |
credit |
| Period Type: |
duration |
|
| X |
- DefinitionAmount of income (expense) related to nonoperating activities, classified as other. Reference 1: http://fasb.org/us-gaap/role/ref/legacyRef
-Topic 220
-SubTopic 10
-Name Accounting Standards Codification
-Section S99
-Paragraph 2
-Subparagraph (SX 210.5-03(9))
-Publisher FASB
-URI https://asc.fasb.org/1943274/2147483621/220-10-S99-2
| Name: |
us-gaap_OtherNonoperatingIncomeExpense |
| Namespace Prefix: |
us-gaap_ |
| Data Type: |
xbrli:monetaryItemType |
| Balance Type: |
credit |
| Period Type: |
duration |
|
| X |
- DefinitionAmount of expense for research and development. Includes, but is not limited to, cost for computer software product to be sold, leased, or otherwise marketed and writeoff of research and development assets acquired in transaction other than business combination or joint venture formation or both. Excludes write-down of intangible asset acquired in business combination or from joint venture formation or both, used in research and development activity. Reference 1: http://www.xbrl.org/2003/role/exampleRef
-Topic 280
-SubTopic 10
-Name Accounting Standards Codification
-Section 55
-Paragraph 48
-Publisher FASB
-URI https://asc.fasb.org/1943274/2147482785/280-10-55-48
Reference 2: http://www.xbrl.org/2003/role/disclosureRef
-Topic 985
-SubTopic 20
-Name Accounting Standards Codification
-Section 50
-Paragraph 2
-Publisher FASB
-URI https://asc.fasb.org/1943274/2147481283/985-20-50-2
Reference 3: http://www.xbrl.org/2003/role/disclosureRef
-Topic 730
-SubTopic 10
-Name Accounting Standards Codification
-Section 50
-Paragraph 1
-Publisher FASB
-URI https://asc.fasb.org/1943274/2147482916/730-10-50-1
Reference 4: http://www.xbrl.org/2009/role/commonPracticeRef
-Topic 912
-SubTopic 730
-Name Accounting Standards Codification
-Section 25
-Paragraph 1
-Publisher FASB
-URI https://asc.fasb.org/1943274/2147479532/912-730-25-1
| Name: |
us-gaap_ResearchAndDevelopmentExpense |
| Namespace Prefix: |
us-gaap_ |
| Data Type: |
xbrli:monetaryItemType |
| Balance Type: |
debit |
| Period Type: |
duration |
|
| X |
- DefinitionAmount of revenue recognized from goods sold, services rendered, insurance premiums, or other activities that constitute an earning process. Includes, but is not limited to, investment and interest income before deduction of interest expense when recognized as a component of revenue, and sales and trading gain (loss). Reference 1: http://www.xbrl.org/2003/role/exampleRef
-Topic 280
-SubTopic 10
-Name Accounting Standards Codification
-Section 55
-Paragraph 48
-Publisher FASB
-URI https://asc.fasb.org/1943274/2147482785/280-10-55-48
Reference 2: http://www.xbrl.org/2003/role/disclosureRef
-Topic 280
-SubTopic 10
-Name Accounting Standards Codification
-Section 50
-Paragraph 41
-Subparagraph (a)
-Publisher FASB
-URI https://asc.fasb.org/1943274/2147482810/280-10-50-41
Reference 3: http://www.xbrl.org/2003/role/disclosureRef
-Topic 270
-SubTopic 10
-Name Accounting Standards Codification
-Section 50
-Paragraph 1
-Subparagraph (i)
-Publisher FASB
-URI https://asc.fasb.org/1943274/2147482964/270-10-50-1
Reference 4: http://www.xbrl.org/2003/role/disclosureRef
-Topic 280
-SubTopic 10
-Name Accounting Standards Codification
-Section 50
-Paragraph 32
-Subparagraph (ee)
-Publisher FASB
-URI https://asc.fasb.org/1943274/2147482810/280-10-50-32
Reference 5: http://fasb.org/us-gaap/role/ref/otherTransitionRef
-Topic 280
-SubTopic 10
-Name Accounting Standards Codification
-Section 50
-Paragraph 32
-Subparagraph (b)
-Publisher FASB
-URI https://asc.fasb.org/1943274/2147482810/280-10-50-32
Reference 6: http://fasb.org/us-gaap/role/ref/otherTransitionRef
-Topic 280
-SubTopic 10
-Name Accounting Standards Codification
-Section 50
-Paragraph 32
-Subparagraph (a)
-Publisher FASB
-URI https://asc.fasb.org/1943274/2147482810/280-10-50-32
Reference 7: http://www.xbrl.org/2003/role/disclosureRef
-Topic 235
-SubTopic 10
-Name Accounting Standards Codification
-Section S99
-Paragraph 1
-Subparagraph (SX 210.4-08(g)(1)(ii))
-Publisher FASB
-URI https://asc.fasb.org/1943274/2147480678/235-10-S99-1
Reference 8: http://www.xbrl.org/2003/role/disclosureRef
-Topic 323
-SubTopic 10
-Name Accounting Standards Codification
-Section 50
-Paragraph 3
-Subparagraph (c)
-Publisher FASB
-URI https://asc.fasb.org/1943274/2147481687/323-10-50-3
Reference 9: http://www.xbrl.org/2003/role/disclosureRef
-Topic 825
-SubTopic 10
-Name Accounting Standards Codification
-Section 50
-Paragraph 28
-Subparagraph (f)
-Publisher FASB
-URI https://asc.fasb.org/1943274/2147482907/825-10-50-28
Reference 10: http://www.xbrl.org/2003/role/disclosureRef
-Topic 470
-SubTopic 10
-Name Accounting Standards Codification
-Section S99
-Paragraph 1A
-Subparagraph (SX 210.13-01(a)(4)(i))
-Publisher FASB
-URI https://asc.fasb.org/1943274/2147480097/470-10-S99-1A
Reference 11: http://www.xbrl.org/2009/role/commonPracticeRef
-Topic 470
-SubTopic 10
-Name Accounting Standards Codification
-Section S99
-Paragraph 1A
-Subparagraph (SX 210.13-01(a)(4)(ii))
-Publisher FASB
-URI https://asc.fasb.org/1943274/2147480097/470-10-S99-1A
Reference 12: http://www.xbrl.org/2003/role/disclosureRef
-Topic 470
-SubTopic 10
-Name Accounting Standards Codification
-Section S99
-Paragraph 1A
-Subparagraph (SX 210.13-01(a)(4)(iii)(A))
-Publisher FASB
-URI https://asc.fasb.org/1943274/2147480097/470-10-S99-1A
Reference 13: http://www.xbrl.org/2003/role/disclosureRef
-Topic 470
-SubTopic 10
-Name Accounting Standards Codification
-Section S99
-Paragraph 1A
-Subparagraph (SX 210.13-01(a)(4)(iv))
-Publisher FASB
-URI https://asc.fasb.org/1943274/2147480097/470-10-S99-1A
Reference 14: http://www.xbrl.org/2003/role/disclosureRef
-Topic 470
-SubTopic 10
-Name Accounting Standards Codification
-Section S99
-Paragraph 1A
-Subparagraph (SX 210.13-01(a)(5))
-Publisher FASB
-URI https://asc.fasb.org/1943274/2147480097/470-10-S99-1A
Reference 15: http://www.xbrl.org/2003/role/disclosureRef
-Topic 470
-SubTopic 10
-Name Accounting Standards Codification
-Section S99
-Paragraph 1B
-Subparagraph (SX 210.13-02(a)(4)(i))
-Publisher FASB
-URI https://asc.fasb.org/1943274/2147480097/470-10-S99-1B
Reference 16: http://www.xbrl.org/2003/role/disclosureRef
-Topic 470
-SubTopic 10
-Name Accounting Standards Codification
-Section S99
-Paragraph 1B
-Subparagraph (SX 210.13-02(a)(4)(iii)(A))
-Publisher FASB
-URI https://asc.fasb.org/1943274/2147480097/470-10-S99-1B
Reference 17: http://www.xbrl.org/2003/role/disclosureRef
-Topic 470
-SubTopic 10
-Name Accounting Standards Codification
-Section S99
-Paragraph 1B
-Subparagraph (SX 210.13-02(a)(4)(iii)(B))
-Publisher FASB
-URI https://asc.fasb.org/1943274/2147480097/470-10-S99-1B
Reference 18: http://www.xbrl.org/2003/role/disclosureRef
-Topic 470
-SubTopic 10
-Name Accounting Standards Codification
-Section S99
-Paragraph 1B
-Subparagraph (SX 210.13-02(a)(4)(iv))
-Publisher FASB
-URI https://asc.fasb.org/1943274/2147480097/470-10-S99-1B
Reference 19: http://www.xbrl.org/2003/role/disclosureRef
-Topic 470
-SubTopic 10
-Name Accounting Standards Codification
-Section S99
-Paragraph 1B
-Subparagraph (SX 210.13-02(a)(5))
-Publisher FASB
-URI https://asc.fasb.org/1943274/2147480097/470-10-S99-1B
Reference 20: http://www.xbrl.org/2003/role/disclosureRef
-Topic 280
-SubTopic 10
-Name Accounting Standards Codification
-Section 50
-Paragraph 30
-Subparagraph (a)
-Publisher FASB
-URI https://asc.fasb.org/1943274/2147482810/280-10-50-30
Reference 21: http://www.xbrl.org/2003/role/disclosureRef
-Topic 280
-SubTopic 10
-Name Accounting Standards Codification
-Section 50
-Paragraph 42
-Publisher FASB
-URI https://asc.fasb.org/1943274/2147482810/280-10-50-42
Reference 22: http://www.xbrl.org/2003/role/disclosureRef
-Topic 280
-SubTopic 10
-Name Accounting Standards Codification
-Section 50
-Paragraph 22
-Subparagraph (b)
-Publisher FASB
-URI https://asc.fasb.org/1943274/2147482810/280-10-50-22
Reference 23: http://www.xbrl.org/2003/role/disclosureRef
-Topic 280
-SubTopic 10
-Name Accounting Standards Codification
-Section 50
-Paragraph 40
-Publisher FASB
-URI https://asc.fasb.org/1943274/2147482810/280-10-50-40
Reference 24: http://www.xbrl.org/2003/role/disclosureRef
-Topic 280
-SubTopic 10
-Name Accounting Standards Codification
-Section 50
-Paragraph 22
-Subparagraph (a)
-Publisher FASB
-URI https://asc.fasb.org/1943274/2147482810/280-10-50-22
Reference 25: http://www.xbrl.org/2003/role/disclosureRef
-Topic 942
-SubTopic 235
-Name Accounting Standards Codification
-Section S99
-Paragraph 1
-Subparagraph (SX 210.9-05(b)(2))
-Publisher FASB
-URI https://asc.fasb.org/1943274/2147477314/942-235-S99-1
Reference 26: http://www.xbrl.org/2003/role/disclosureRef
-Topic 220
-SubTopic 10
-Name Accounting Standards Codification
-Section S99
-Paragraph 2
-Subparagraph (SX 210.5-03(1))
-Publisher FASB
-URI https://asc.fasb.org/1943274/2147483621/220-10-S99-2
| Name: |
us-gaap_Revenues |
| Namespace Prefix: |
us-gaap_ |
| Data Type: |
xbrli:monetaryItemType |
| Balance Type: |
credit |
| Period Type: |
duration |
|
| X |
- DefinitionThe aggregate total amount of expenses directly related to the marketing or selling of products or services.
| Name: |
us-gaap_SellingAndMarketingExpense |
| Namespace Prefix: |
us-gaap_ |
| Data Type: |
xbrli:monetaryItemType |
| Balance Type: |
debit |
| Period Type: |
duration |
|
| X |
- DefinitionThe average number of shares or units issued and outstanding that are used in calculating diluted EPS or earnings per unit (EPU), determined based on the timing of issuance of shares or units in the period. Reference 1: http://www.xbrl.org/2003/role/disclosureRef
-Topic 260
-SubTopic 10
-Name Accounting Standards Codification
-Section 50
-Paragraph 1
-Subparagraph (a)
-Publisher FASB
-URI https://asc.fasb.org/1943274/2147482662/260-10-50-1
Reference 2: http://www.xbrl.org/2003/role/disclosureRef
-Topic 260
-SubTopic 10
-Name Accounting Standards Codification
-Section 45
-Paragraph 16
-Publisher FASB
-URI https://asc.fasb.org/1943274/2147482689/260-10-45-16
| Name: |
us-gaap_WeightedAverageNumberOfDilutedSharesOutstanding |
| Namespace Prefix: |
us-gaap_ |
| Data Type: |
xbrli:sharesItemType |
| Balance Type: |
na |
| Period Type: |
duration |
|
| X |
- DefinitionNumber of [basic] shares or units, after adjustment for contingently issuable shares or units and other shares or units not deemed outstanding, determined by relating the portion of time within a reporting period that common shares or units have been outstanding to the total time in that period. Reference 1: http://www.xbrl.org/2003/role/disclosureRef
-Topic 260
-SubTopic 10
-Name Accounting Standards Codification
-Section 50
-Paragraph 1
-Subparagraph (a)
-Publisher FASB
-URI https://asc.fasb.org/1943274/2147482662/260-10-50-1
Reference 2: http://www.xbrl.org/2003/role/disclosureRef
-Topic 260
-SubTopic 10
-Name Accounting Standards Codification
-Section 45
-Paragraph 10
-Publisher FASB
-URI https://asc.fasb.org/1943274/2147482689/260-10-45-10
| Name: |
us-gaap_WeightedAverageNumberOfSharesOutstandingBasic |
| Namespace Prefix: |
us-gaap_ |
| Data Type: |
xbrli:sharesItemType |
| Balance Type: |
na |
| Period Type: |
duration |
|
v3.24.2.u1
| X |
- DefinitionAmount after tax of increase (decrease) in equity from transactions and other events and circumstances from net income and other comprehensive income, attributable to parent entity. Excludes changes in equity resulting from investments by owners and distributions to owners. Reference 1: http://www.xbrl.org/2003/role/disclosureRef
-Topic 220
-SubTopic 10
-Name Accounting Standards Codification
-Section S99
-Paragraph 2
-Subparagraph (SX 210.5-03(24))
-Publisher FASB
-URI https://asc.fasb.org/1943274/2147483621/220-10-S99-2
Reference 2: http://www.xbrl.org/2003/role/disclosureRef
-Topic 942
-SubTopic 220
-Name Accounting Standards Codification
-Section S99
-Paragraph 1
-Subparagraph (SX 210.9-04(26))
-Publisher FASB
-URI https://asc.fasb.org/1943274/2147478524/942-220-S99-1
Reference 3: http://www.xbrl.org/2003/role/disclosureRef
-Topic 944
-SubTopic 220
-Name Accounting Standards Codification
-Section S99
-Paragraph 1
-Subparagraph (SX 210.7-04(22))
-Publisher FASB
-URI https://asc.fasb.org/1943274/2147477250/944-220-S99-1
Reference 4: http://www.xbrl.org/2003/role/disclosureRef
-Topic 220
-SubTopic 10
-Name Accounting Standards Codification
-Section 45
-Paragraph 1A
-Subparagraph (c)
-Publisher FASB
-URI https://asc.fasb.org/1943274/2147482790/220-10-45-1A
Reference 5: http://www.xbrl.org/2003/role/disclosureRef
-Topic 220
-SubTopic 10
-Name Accounting Standards Codification
-Section 45
-Paragraph 1B
-Subparagraph (b)
-Publisher FASB
-URI https://asc.fasb.org/1943274/2147482790/220-10-45-1B
Reference 6: http://www.xbrl.org/2003/role/disclosureRef
-Topic 944
-SubTopic 220
-Name Accounting Standards Codification
-Section S99
-Paragraph 1
-Subparagraph (SX 210.7-04(20))
-Publisher FASB
-URI https://asc.fasb.org/1943274/2147477250/944-220-S99-1
Reference 7: http://fasb.org/us-gaap/role/ref/legacyRef
-Name Accounting Standards Codification
-Topic 220
-SubTopic 10
-Section 45
-Paragraph 5
-Publisher FASB
-URI https://asc.fasb.org/1943274/2147482790/220-10-45-5
| Name: |
us-gaap_ComprehensiveIncomeNetOfTax |
| Namespace Prefix: |
us-gaap_ |
| Data Type: |
xbrli:monetaryItemType |
| Balance Type: |
credit |
| Period Type: |
duration |
|
| X |
- DefinitionThe portion of profit or loss for the period, net of income taxes, which is attributable to the parent. Reference 1: http://www.xbrl.org/2003/role/disclosureRef
-Topic 250
-SubTopic 10
-Name Accounting Standards Codification
-Section 50
-Paragraph 6
-Publisher FASB
-URI https://asc.fasb.org/1943274/2147483443/250-10-50-6
Reference 2: http://www.xbrl.org/2003/role/disclosureRef
-Topic 250
-SubTopic 10
-Name Accounting Standards Codification
-Section 50
-Paragraph 9
-Publisher FASB
-URI https://asc.fasb.org/1943274/2147483443/250-10-50-9
Reference 3: http://www.xbrl.org/2003/role/disclosureRef
-Topic 805
-SubTopic 60
-Name Accounting Standards Codification
-Section 65
-Paragraph 1
-Subparagraph (g)
-Publisher FASB
-URI https://asc.fasb.org/1943274/2147476176/805-60-65-1
Reference 4: http://www.xbrl.org/2003/role/disclosureRef
-Topic 740
-SubTopic 323
-Name Accounting Standards Codification
-Section 65
-Paragraph 2
-Subparagraph (g)(3)
-Publisher FASB
-URI https://asc.fasb.org/1943274/2147478666/740-323-65-2
Reference 5: http://fasb.org/us-gaap/role/ref/legacyRef
-Topic 220
-SubTopic 10
-Name Accounting Standards Codification
-Section S99
-Paragraph 2
-Subparagraph (SX 210.5-03(20))
-Publisher FASB
-URI https://asc.fasb.org/1943274/2147483621/220-10-S99-2
Reference 6: http://www.xbrl.org/2003/role/disclosureRef
-Topic 235
-SubTopic 10
-Name Accounting Standards Codification
-Section S99
-Paragraph 1
-Subparagraph (SX 210.4-08(g)(1)(ii))
-Publisher FASB
-URI https://asc.fasb.org/1943274/2147480678/235-10-S99-1
Reference 7: http://www.xbrl.org/2003/role/disclosureRef
-Topic 323
-SubTopic 10
-Name Accounting Standards Codification
-Section 50
-Paragraph 3
-Subparagraph (c)
-Publisher FASB
-URI https://asc.fasb.org/1943274/2147481687/323-10-50-3
Reference 8: http://www.xbrl.org/2003/role/disclosureRef
-Topic 825
-SubTopic 10
-Name Accounting Standards Codification
-Section 50
-Paragraph 28
-Subparagraph (f)
-Publisher FASB
-URI https://asc.fasb.org/1943274/2147482907/825-10-50-28
Reference 9: http://www.xbrl.org/2003/role/disclosureRef
-Topic 220
-SubTopic 10
-Name Accounting Standards Codification
-Section 50
-Paragraph 6
-Publisher FASB
-URI https://asc.fasb.org/1943274/2147482765/220-10-50-6
Reference 10: http://www.xbrl.org/2003/role/disclosureRef
-Topic 250
-SubTopic 10
-Name Accounting Standards Codification
-Section 50
-Paragraph 3
-Publisher FASB
-URI https://asc.fasb.org/1943274/2147483443/250-10-50-3
Reference 11: http://www.xbrl.org/2003/role/disclosureRef
-Topic 250
-SubTopic 10
-Name Accounting Standards Codification
-Section 50
-Paragraph 1
-Subparagraph (b)(2)
-Publisher FASB
-URI https://asc.fasb.org/1943274/2147483443/250-10-50-1
Reference 12: http://www.xbrl.org/2003/role/disclosureRef
-Topic 815
-SubTopic 40
-Name Accounting Standards Codification
-Section 65
-Paragraph 1
-Subparagraph (f)
-Publisher FASB
-URI https://asc.fasb.org/1943274/2147480175/815-40-65-1
Reference 13: http://www.xbrl.org/2003/role/disclosureRef
-Topic 250
-SubTopic 10
-Name Accounting Standards Codification
-Section 50
-Paragraph 8
-Publisher FASB
-URI https://asc.fasb.org/1943274/2147483443/250-10-50-8
Reference 14: http://www.xbrl.org/2003/role/disclosureRef
-Topic 250
-SubTopic 10
-Name Accounting Standards Codification
-Section 50
-Paragraph 11
-Subparagraph (a)
-Publisher FASB
-URI https://asc.fasb.org/1943274/2147483443/250-10-50-11
Reference 15: http://www.xbrl.org/2003/role/disclosureRef
-Topic 250
-SubTopic 10
-Name Accounting Standards Codification
-Section 50
-Paragraph 11
-Subparagraph (b)
-Publisher FASB
-URI https://asc.fasb.org/1943274/2147483443/250-10-50-11
Reference 16: http://www.xbrl.org/2003/role/disclosureRef
-Topic 250
-SubTopic 10
-Name Accounting Standards Codification
-Section 50
-Paragraph 4
-Publisher FASB
-URI https://asc.fasb.org/1943274/2147483443/250-10-50-4
Reference 17: http://www.xbrl.org/2003/role/exampleRef
-Topic 946
-SubTopic 830
-Name Accounting Standards Codification
-Section 55
-Paragraph 10
-Publisher FASB
-URI https://asc.fasb.org/1943274/2147479168/946-830-55-10
Reference 18: http://www.xbrl.org/2003/role/disclosureRef
-Topic 946
-SubTopic 220
-Name Accounting Standards Codification
-Section 45
-Paragraph 7
-Publisher FASB
-URI https://asc.fasb.org/1943274/2147479105/946-220-45-7
Reference 19: http://www.xbrl.org/2003/role/disclosureRef
-Topic 944
-SubTopic 220
-Name Accounting Standards Codification
-Section S99
-Paragraph 1
-Subparagraph (SX 210.7-04(18))
-Publisher FASB
-URI https://asc.fasb.org/1943274/2147477250/944-220-S99-1
Reference 20: http://www.xbrl.org/2003/role/disclosureRef
-Topic 946
-SubTopic 220
-Name Accounting Standards Codification
-Section S99
-Paragraph 1
-Subparagraph (SX 210.6-07(9))
-Publisher FASB
-URI https://asc.fasb.org/1943274/2147479134/946-220-S99-1
Reference 21: http://www.xbrl.org/2003/role/disclosureRef
-Topic 946
-SubTopic 220
-Name Accounting Standards Codification
-Section S99
-Paragraph 3
-Subparagraph (SX 210.6-09(1)(d))
-Publisher FASB
-URI https://asc.fasb.org/1943274/2147479134/946-220-S99-3
Reference 22: http://www.xbrl.org/2003/role/disclosureRef
-Topic 470
-SubTopic 10
-Name Accounting Standards Codification
-Section S99
-Paragraph 1A
-Subparagraph (SX 210.13-01(a)(4)(i))
-Publisher FASB
-URI https://asc.fasb.org/1943274/2147480097/470-10-S99-1A
Reference 23: http://www.xbrl.org/2009/role/commonPracticeRef
-Topic 470
-SubTopic 10
-Name Accounting Standards Codification
-Section S99
-Paragraph 1A
-Subparagraph (SX 210.13-01(a)(4)(ii))
-Publisher FASB
-URI https://asc.fasb.org/1943274/2147480097/470-10-S99-1A
Reference 24: http://www.xbrl.org/2003/role/disclosureRef
-Topic 470
-SubTopic 10
-Name Accounting Standards Codification
-Section S99
-Paragraph 1A
-Subparagraph (SX 210.13-01(a)(4)(iii)(A))
-Publisher FASB
-URI https://asc.fasb.org/1943274/2147480097/470-10-S99-1A
Reference 25: http://www.xbrl.org/2003/role/disclosureRef
-Topic 470
-SubTopic 10
-Name Accounting Standards Codification
-Section S99
-Paragraph 1A
-Subparagraph (SX 210.13-01(a)(4)(iv))
-Publisher FASB
-URI https://asc.fasb.org/1943274/2147480097/470-10-S99-1A
Reference 26: http://www.xbrl.org/2003/role/disclosureRef
-Topic 470
-SubTopic 10
-Name Accounting Standards Codification
-Section S99
-Paragraph 1A
-Subparagraph (SX 210.13-01(a)(5))
-Publisher FASB
-URI https://asc.fasb.org/1943274/2147480097/470-10-S99-1A
Reference 27: http://www.xbrl.org/2003/role/disclosureRef
-Topic 470
-SubTopic 10
-Name Accounting Standards Codification
-Section S99
-Paragraph 1B
-Subparagraph (SX 210.13-02(a)(4)(i))
-Publisher FASB
-URI https://asc.fasb.org/1943274/2147480097/470-10-S99-1B
Reference 28: http://www.xbrl.org/2003/role/disclosureRef
-Topic 470
-SubTopic 10
-Name Accounting Standards Codification
-Section S99
-Paragraph 1B
-Subparagraph (SX 210.13-02(a)(4)(iii)(A))
-Publisher FASB
-URI https://asc.fasb.org/1943274/2147480097/470-10-S99-1B
Reference 29: http://www.xbrl.org/2003/role/disclosureRef
-Topic 470
-SubTopic 10
-Name Accounting Standards Codification
-Section S99
-Paragraph 1B
-Subparagraph (SX 210.13-02(a)(4)(iii)(B))
-Publisher FASB
-URI https://asc.fasb.org/1943274/2147480097/470-10-S99-1B
Reference 30: http://www.xbrl.org/2003/role/disclosureRef
-Topic 470
-SubTopic 10
-Name Accounting Standards Codification
-Section S99
-Paragraph 1B
-Subparagraph (SX 210.13-02(a)(4)(iv))
-Publisher FASB
-URI https://asc.fasb.org/1943274/2147480097/470-10-S99-1B
Reference 31: http://www.xbrl.org/2003/role/disclosureRef
-Topic 470
-SubTopic 10
-Name Accounting Standards Codification
-Section S99
-Paragraph 1B
-Subparagraph (SX 210.13-02(a)(5))
-Publisher FASB
-URI https://asc.fasb.org/1943274/2147480097/470-10-S99-1B
Reference 32: http://www.xbrl.org/2003/role/disclosureRef
-Topic 260
-SubTopic 10
-Name Accounting Standards Codification
-Section 45
-Paragraph 60B
-Subparagraph (a)
-Publisher FASB
-URI https://asc.fasb.org/1943274/2147482689/260-10-45-60B
Reference 33: http://www.xbrl.org/2003/role/disclosureRef
-Topic 205
-SubTopic 20
-Name Accounting Standards Codification
-Section 50
-Paragraph 7
-Publisher FASB
-URI https://asc.fasb.org/1943274/2147483499/205-20-50-7
Reference 34: http://fasb.org/us-gaap/role/ref/legacyRef
-Topic 230
-SubTopic 10
-Name Accounting Standards Codification
-Section 45
-Paragraph 28
-Publisher FASB
-URI https://asc.fasb.org/1943274/2147482740/230-10-45-28
Reference 35: http://www.xbrl.org/2003/role/disclosureRef
-Topic 220
-SubTopic 10
-Name Accounting Standards Codification
-Section 45
-Paragraph 1A
-Subparagraph (a)
-Publisher FASB
-URI https://asc.fasb.org/1943274/2147482790/220-10-45-1A
Reference 36: http://www.xbrl.org/2003/role/disclosureRef
-Topic 220
-SubTopic 10
-Name Accounting Standards Codification
-Section 45
-Paragraph 1B
-Subparagraph (a)
-Publisher FASB
-URI https://asc.fasb.org/1943274/2147482790/220-10-45-1B
Reference 37: http://fasb.org/us-gaap/role/ref/legacyRef
-Topic 942
-SubTopic 220
-Name Accounting Standards Codification
-Section S99
-Paragraph 1
-Subparagraph (SX 210.9-04(22))
-Publisher FASB
-URI https://asc.fasb.org/1943274/2147478524/942-220-S99-1
| Name: |
us-gaap_NetIncomeLoss |
| Namespace Prefix: |
us-gaap_ |
| Data Type: |
xbrli:monetaryItemType |
| Balance Type: |
credit |
| Period Type: |
duration |
|
| X |
- DefinitionAmount after tax and reclassification adjustments of gain (loss) on foreign currency translation adjustments, foreign currency transactions designated and effective as economic hedges of a net investment in a foreign entity and intra-entity foreign currency transactions that are of a long-term-investment nature. Reference 1: http://fasb.org/us-gaap/role/ref/legacyRef
-Name Accounting Standards Codification
-Section 45
-Paragraph 10A
-Subparagraph (a)
-SubTopic 10
-Topic 220
-Publisher FASB
-URI https://asc.fasb.org/1943274/2147482790/220-10-45-10A
Reference 2: http://www.xbrl.org/2003/role/disclosureRef
-Topic 944
-SubTopic 220
-Name Accounting Standards Codification
-Section S99
-Paragraph 1
-Subparagraph (SX 210.7-04(19))
-Publisher FASB
-URI https://asc.fasb.org/1943274/2147477250/944-220-S99-1
| Name: |
us-gaap_OtherComprehensiveIncomeLossForeignCurrencyTransactionAndTranslationAdjustmentNetOfTax |
| Namespace Prefix: |
us-gaap_ |
| Data Type: |
xbrli:monetaryItemType |
| Balance Type: |
credit |
| Period Type: |
duration |
|
| X |
- References
+ Details
| Name: |
us-gaap_StatementOfOtherComprehensiveIncomeAbstract |
| Namespace Prefix: |
us-gaap_ |
| Data Type: |
xbrli:stringItemType |
| Balance Type: |
na |
| Period Type: |
duration |
|
v3.24.2.u1
CONSOLIDATED STATEMENTS OF STOCKHOLDERS' EQUITY (UNAUDITED) - USD ($)
$ in Thousands |
Total |
Common Stock |
Additional Paid-In Capital |
Accumulated other comprehensive Loss |
Retained Earnings |
| Balance, shares at Dec. 31, 2022 |
|
3,791,020
|
|
|
|
| Balance, amount at Dec. 31, 2022 |
$ 33,223
|
$ 4
|
$ 22,147
|
$ (96)
|
$ 11,168
|
| Stock-based compensation expense |
337
|
0
|
337
|
0
|
0
|
| Foreign currency translation |
1
|
0
|
0
|
1
|
0
|
| Net loss |
(144)
|
$ 0
|
0
|
0
|
(144)
|
| Balance, shares at Mar. 31, 2023 |
|
3,791,020
|
|
|
|
| Balance, amount at Mar. 31, 2023 |
33,417
|
$ 4
|
22,484
|
(95)
|
11,024
|
| Balance, shares at Dec. 31, 2022 |
|
3,791,020
|
|
|
|
| Balance, amount at Dec. 31, 2022 |
33,223
|
$ 4
|
22,147
|
(96)
|
11,168
|
| Foreign currency translation |
45
|
|
|
|
|
| Net loss |
1,219
|
|
|
|
|
| Balance, shares at Jun. 30, 2023 |
|
3,809,149
|
|
|
|
| Balance, amount at Jun. 30, 2023 |
35,178
|
$ 4
|
22,838
|
(51)
|
12,387
|
| Balance, shares at Mar. 31, 2023 |
|
3,791,020
|
|
|
|
| Balance, amount at Mar. 31, 2023 |
33,417
|
$ 4
|
22,484
|
(95)
|
11,024
|
| Stock-based compensation expense |
354
|
0
|
354
|
0
|
0
|
| Foreign currency translation |
44
|
0
|
0
|
44
|
0
|
| Net loss |
1,363
|
$ 0
|
0
|
0
|
1,363
|
| Exercise of stock awards, net of tax, shares |
|
18,129
|
|
|
|
| Exercise of stock awards, net of tax, amount |
0
|
$ 0
|
0
|
0
|
0
|
| Balance, shares at Jun. 30, 2023 |
|
3,809,149
|
|
|
|
| Balance, amount at Jun. 30, 2023 |
35,178
|
$ 4
|
22,838
|
(51)
|
12,387
|
| Balance, shares at Dec. 31, 2023 |
|
3,815,212
|
|
|
|
| Balance, amount at Dec. 31, 2023 |
35,420
|
$ 4
|
23,531
|
(49)
|
11,934
|
| Stock-based compensation expense |
(67)
|
0
|
(67)
|
0
|
0
|
| Foreign currency translation |
(34)
|
0
|
0
|
(34)
|
0
|
| Net loss |
(139)
|
$ 0
|
0
|
0
|
(139)
|
| Exercise of stock awards, net of tax, shares |
|
2,167
|
|
|
|
| Exercise of stock awards, net of tax, amount |
0
|
$ 0
|
0
|
0
|
0
|
| Balance, shares at Mar. 31, 2024 |
|
3,817,379
|
|
|
|
| Balance, amount at Mar. 31, 2024 |
35,180
|
$ 4
|
23,464
|
(83)
|
11,795
|
| Balance, shares at Dec. 31, 2023 |
|
3,815,212
|
|
|
|
| Balance, amount at Dec. 31, 2023 |
35,420
|
$ 4
|
23,531
|
(49)
|
11,934
|
| Foreign currency translation |
(47)
|
|
|
|
|
| Net loss |
(132)
|
|
|
|
|
| Balance, shares at Jun. 30, 2024 |
|
3,831,711
|
|
|
|
| Balance, amount at Jun. 30, 2024 |
35,441
|
$ 4
|
23,731
|
(96)
|
11,802
|
| Balance, shares at Mar. 31, 2024 |
|
3,817,379
|
|
|
|
| Balance, amount at Mar. 31, 2024 |
35,180
|
$ 4
|
23,464
|
(83)
|
11,795
|
| Stock-based compensation expense |
267
|
0
|
267
|
0
|
0
|
| Foreign currency translation |
(13)
|
0
|
0
|
(13)
|
0
|
| Net loss |
7
|
$ 0
|
0
|
0
|
7
|
| Exercise of stock awards, net of tax, shares |
|
14,332
|
|
|
|
| Exercise of stock awards, net of tax, amount |
0
|
$ 0
|
0
|
0
|
0
|
| Balance, shares at Jun. 30, 2024 |
|
3,831,711
|
|
|
|
| Balance, amount at Jun. 30, 2024 |
$ 35,441
|
$ 4
|
$ 23,731
|
$ (96)
|
$ 11,802
|
| X |
- References
+ Details
| Name: |
isdr_ExerciseOfStockAwardsNetOfTaxAmount |
| Namespace Prefix: |
isdr_ |
| Data Type: |
xbrli:monetaryItemType |
| Balance Type: |
credit |
| Period Type: |
duration |
|
| X |
- References
+ Details
| Name: |
isdr_ExerciseOfStockAwardsNetOfTaxShares |
| Namespace Prefix: |
isdr_ |
| Data Type: |
xbrli:sharesItemType |
| Balance Type: |
na |
| Period Type: |
duration |
|
| X |
- DefinitionAmount of increase to additional paid-in capital (APIC) for recognition of cost for award under share-based payment arrangement. Reference 1: http://www.xbrl.org/2003/role/disclosureRef
-Topic 718
-SubTopic 10
-Name Accounting Standards Codification
-Section 35
-Paragraph 2
-Publisher FASB
-URI https://asc.fasb.org/1943274/2147480483/718-10-35-2
Reference 2: http://fasb.org/us-gaap/role/ref/legacyRef
-Name Accounting Standards Codification
-Topic 718
-SubTopic 20
-Section 55
-Paragraph 13
-Publisher FASB
-URI https://asc.fasb.org/1943274/2147481089/718-20-55-13
Reference 3: http://fasb.org/us-gaap/role/ref/legacyRef
-Name Accounting Standards Codification
-Topic 718
-SubTopic 20
-Section 55
-Paragraph 12
-Publisher FASB
-URI https://asc.fasb.org/1943274/2147481089/718-20-55-12
| Name: |
us-gaap_AdjustmentsToAdditionalPaidInCapitalSharebasedCompensationRequisiteServicePeriodRecognitionValue |
| Namespace Prefix: |
us-gaap_ |
| Data Type: |
xbrli:monetaryItemType |
| Balance Type: |
credit |
| Period Type: |
duration |
|
| X |
- DefinitionThe portion of profit or loss for the period, net of income taxes, which is attributable to the parent. Reference 1: http://www.xbrl.org/2003/role/disclosureRef
-Topic 250
-SubTopic 10
-Name Accounting Standards Codification
-Section 50
-Paragraph 6
-Publisher FASB
-URI https://asc.fasb.org/1943274/2147483443/250-10-50-6
Reference 2: http://www.xbrl.org/2003/role/disclosureRef
-Topic 250
-SubTopic 10
-Name Accounting Standards Codification
-Section 50
-Paragraph 9
-Publisher FASB
-URI https://asc.fasb.org/1943274/2147483443/250-10-50-9
Reference 3: http://www.xbrl.org/2003/role/disclosureRef
-Topic 805
-SubTopic 60
-Name Accounting Standards Codification
-Section 65
-Paragraph 1
-Subparagraph (g)
-Publisher FASB
-URI https://asc.fasb.org/1943274/2147476176/805-60-65-1
Reference 4: http://www.xbrl.org/2003/role/disclosureRef
-Topic 740
-SubTopic 323
-Name Accounting Standards Codification
-Section 65
-Paragraph 2
-Subparagraph (g)(3)
-Publisher FASB
-URI https://asc.fasb.org/1943274/2147478666/740-323-65-2
Reference 5: http://fasb.org/us-gaap/role/ref/legacyRef
-Topic 220
-SubTopic 10
-Name Accounting Standards Codification
-Section S99
-Paragraph 2
-Subparagraph (SX 210.5-03(20))
-Publisher FASB
-URI https://asc.fasb.org/1943274/2147483621/220-10-S99-2
Reference 6: http://www.xbrl.org/2003/role/disclosureRef
-Topic 235
-SubTopic 10
-Name Accounting Standards Codification
-Section S99
-Paragraph 1
-Subparagraph (SX 210.4-08(g)(1)(ii))
-Publisher FASB
-URI https://asc.fasb.org/1943274/2147480678/235-10-S99-1
Reference 7: http://www.xbrl.org/2003/role/disclosureRef
-Topic 323
-SubTopic 10
-Name Accounting Standards Codification
-Section 50
-Paragraph 3
-Subparagraph (c)
-Publisher FASB
-URI https://asc.fasb.org/1943274/2147481687/323-10-50-3
Reference 8: http://www.xbrl.org/2003/role/disclosureRef
-Topic 825
-SubTopic 10
-Name Accounting Standards Codification
-Section 50
-Paragraph 28
-Subparagraph (f)
-Publisher FASB
-URI https://asc.fasb.org/1943274/2147482907/825-10-50-28
Reference 9: http://www.xbrl.org/2003/role/disclosureRef
-Topic 220
-SubTopic 10
-Name Accounting Standards Codification
-Section 50
-Paragraph 6
-Publisher FASB
-URI https://asc.fasb.org/1943274/2147482765/220-10-50-6
Reference 10: http://www.xbrl.org/2003/role/disclosureRef
-Topic 250
-SubTopic 10
-Name Accounting Standards Codification
-Section 50
-Paragraph 3
-Publisher FASB
-URI https://asc.fasb.org/1943274/2147483443/250-10-50-3
Reference 11: http://www.xbrl.org/2003/role/disclosureRef
-Topic 250
-SubTopic 10
-Name Accounting Standards Codification
-Section 50
-Paragraph 1
-Subparagraph (b)(2)
-Publisher FASB
-URI https://asc.fasb.org/1943274/2147483443/250-10-50-1
Reference 12: http://www.xbrl.org/2003/role/disclosureRef
-Topic 815
-SubTopic 40
-Name Accounting Standards Codification
-Section 65
-Paragraph 1
-Subparagraph (f)
-Publisher FASB
-URI https://asc.fasb.org/1943274/2147480175/815-40-65-1
Reference 13: http://www.xbrl.org/2003/role/disclosureRef
-Topic 250
-SubTopic 10
-Name Accounting Standards Codification
-Section 50
-Paragraph 8
-Publisher FASB
-URI https://asc.fasb.org/1943274/2147483443/250-10-50-8
Reference 14: http://www.xbrl.org/2003/role/disclosureRef
-Topic 250
-SubTopic 10
-Name Accounting Standards Codification
-Section 50
-Paragraph 11
-Subparagraph (a)
-Publisher FASB
-URI https://asc.fasb.org/1943274/2147483443/250-10-50-11
Reference 15: http://www.xbrl.org/2003/role/disclosureRef
-Topic 250
-SubTopic 10
-Name Accounting Standards Codification
-Section 50
-Paragraph 11
-Subparagraph (b)
-Publisher FASB
-URI https://asc.fasb.org/1943274/2147483443/250-10-50-11
Reference 16: http://www.xbrl.org/2003/role/disclosureRef
-Topic 250
-SubTopic 10
-Name Accounting Standards Codification
-Section 50
-Paragraph 4
-Publisher FASB
-URI https://asc.fasb.org/1943274/2147483443/250-10-50-4
Reference 17: http://www.xbrl.org/2003/role/exampleRef
-Topic 946
-SubTopic 830
-Name Accounting Standards Codification
-Section 55
-Paragraph 10
-Publisher FASB
-URI https://asc.fasb.org/1943274/2147479168/946-830-55-10
Reference 18: http://www.xbrl.org/2003/role/disclosureRef
-Topic 946
-SubTopic 220
-Name Accounting Standards Codification
-Section 45
-Paragraph 7
-Publisher FASB
-URI https://asc.fasb.org/1943274/2147479105/946-220-45-7
Reference 19: http://www.xbrl.org/2003/role/disclosureRef
-Topic 944
-SubTopic 220
-Name Accounting Standards Codification
-Section S99
-Paragraph 1
-Subparagraph (SX 210.7-04(18))
-Publisher FASB
-URI https://asc.fasb.org/1943274/2147477250/944-220-S99-1
Reference 20: http://www.xbrl.org/2003/role/disclosureRef
-Topic 946
-SubTopic 220
-Name Accounting Standards Codification
-Section S99
-Paragraph 1
-Subparagraph (SX 210.6-07(9))
-Publisher FASB
-URI https://asc.fasb.org/1943274/2147479134/946-220-S99-1
Reference 21: http://www.xbrl.org/2003/role/disclosureRef
-Topic 946
-SubTopic 220
-Name Accounting Standards Codification
-Section S99
-Paragraph 3
-Subparagraph (SX 210.6-09(1)(d))
-Publisher FASB
-URI https://asc.fasb.org/1943274/2147479134/946-220-S99-3
Reference 22: http://www.xbrl.org/2003/role/disclosureRef
-Topic 470
-SubTopic 10
-Name Accounting Standards Codification
-Section S99
-Paragraph 1A
-Subparagraph (SX 210.13-01(a)(4)(i))
-Publisher FASB
-URI https://asc.fasb.org/1943274/2147480097/470-10-S99-1A
Reference 23: http://www.xbrl.org/2009/role/commonPracticeRef
-Topic 470
-SubTopic 10
-Name Accounting Standards Codification
-Section S99
-Paragraph 1A
-Subparagraph (SX 210.13-01(a)(4)(ii))
-Publisher FASB
-URI https://asc.fasb.org/1943274/2147480097/470-10-S99-1A
Reference 24: http://www.xbrl.org/2003/role/disclosureRef
-Topic 470
-SubTopic 10
-Name Accounting Standards Codification
-Section S99
-Paragraph 1A
-Subparagraph (SX 210.13-01(a)(4)(iii)(A))
-Publisher FASB
-URI https://asc.fasb.org/1943274/2147480097/470-10-S99-1A
Reference 25: http://www.xbrl.org/2003/role/disclosureRef
-Topic 470
-SubTopic 10
-Name Accounting Standards Codification
-Section S99
-Paragraph 1A
-Subparagraph (SX 210.13-01(a)(4)(iv))
-Publisher FASB
-URI https://asc.fasb.org/1943274/2147480097/470-10-S99-1A
Reference 26: http://www.xbrl.org/2003/role/disclosureRef
-Topic 470
-SubTopic 10
-Name Accounting Standards Codification
-Section S99
-Paragraph 1A
-Subparagraph (SX 210.13-01(a)(5))
-Publisher FASB
-URI https://asc.fasb.org/1943274/2147480097/470-10-S99-1A
Reference 27: http://www.xbrl.org/2003/role/disclosureRef
-Topic 470
-SubTopic 10
-Name Accounting Standards Codification
-Section S99
-Paragraph 1B
-Subparagraph (SX 210.13-02(a)(4)(i))
-Publisher FASB
-URI https://asc.fasb.org/1943274/2147480097/470-10-S99-1B
Reference 28: http://www.xbrl.org/2003/role/disclosureRef
-Topic 470
-SubTopic 10
-Name Accounting Standards Codification
-Section S99
-Paragraph 1B
-Subparagraph (SX 210.13-02(a)(4)(iii)(A))
-Publisher FASB
-URI https://asc.fasb.org/1943274/2147480097/470-10-S99-1B
Reference 29: http://www.xbrl.org/2003/role/disclosureRef
-Topic 470
-SubTopic 10
-Name Accounting Standards Codification
-Section S99
-Paragraph 1B
-Subparagraph (SX 210.13-02(a)(4)(iii)(B))
-Publisher FASB
-URI https://asc.fasb.org/1943274/2147480097/470-10-S99-1B
Reference 30: http://www.xbrl.org/2003/role/disclosureRef
-Topic 470
-SubTopic 10
-Name Accounting Standards Codification
-Section S99
-Paragraph 1B
-Subparagraph (SX 210.13-02(a)(4)(iv))
-Publisher FASB
-URI https://asc.fasb.org/1943274/2147480097/470-10-S99-1B
Reference 31: http://www.xbrl.org/2003/role/disclosureRef
-Topic 470
-SubTopic 10
-Name Accounting Standards Codification
-Section S99
-Paragraph 1B
-Subparagraph (SX 210.13-02(a)(5))
-Publisher FASB
-URI https://asc.fasb.org/1943274/2147480097/470-10-S99-1B
Reference 32: http://www.xbrl.org/2003/role/disclosureRef
-Topic 260
-SubTopic 10
-Name Accounting Standards Codification
-Section 45
-Paragraph 60B
-Subparagraph (a)
-Publisher FASB
-URI https://asc.fasb.org/1943274/2147482689/260-10-45-60B
Reference 33: http://www.xbrl.org/2003/role/disclosureRef
-Topic 205
-SubTopic 20
-Name Accounting Standards Codification
-Section 50
-Paragraph 7
-Publisher FASB
-URI https://asc.fasb.org/1943274/2147483499/205-20-50-7
Reference 34: http://fasb.org/us-gaap/role/ref/legacyRef
-Topic 230
-SubTopic 10
-Name Accounting Standards Codification
-Section 45
-Paragraph 28
-Publisher FASB
-URI https://asc.fasb.org/1943274/2147482740/230-10-45-28
Reference 35: http://www.xbrl.org/2003/role/disclosureRef
-Topic 220
-SubTopic 10
-Name Accounting Standards Codification
-Section 45
-Paragraph 1A
-Subparagraph (a)
-Publisher FASB
-URI https://asc.fasb.org/1943274/2147482790/220-10-45-1A
Reference 36: http://www.xbrl.org/2003/role/disclosureRef
-Topic 220
-SubTopic 10
-Name Accounting Standards Codification
-Section 45
-Paragraph 1B
-Subparagraph (a)
-Publisher FASB
-URI https://asc.fasb.org/1943274/2147482790/220-10-45-1B
Reference 37: http://fasb.org/us-gaap/role/ref/legacyRef
-Topic 942
-SubTopic 220
-Name Accounting Standards Codification
-Section S99
-Paragraph 1
-Subparagraph (SX 210.9-04(22))
-Publisher FASB
-URI https://asc.fasb.org/1943274/2147478524/942-220-S99-1
| Name: |
us-gaap_NetIncomeLoss |
| Namespace Prefix: |
us-gaap_ |
| Data Type: |
xbrli:monetaryItemType |
| Balance Type: |
credit |
| Period Type: |
duration |
|
| X |
- DefinitionAmount after tax and reclassification adjustments of gain (loss) on foreign currency translation adjustments, foreign currency transactions designated and effective as economic hedges of a net investment in a foreign entity and intra-entity foreign currency transactions that are of a long-term-investment nature. Reference 1: http://fasb.org/us-gaap/role/ref/legacyRef
-Name Accounting Standards Codification
-Section 45
-Paragraph 10A
-Subparagraph (a)
-SubTopic 10
-Topic 220
-Publisher FASB
-URI https://asc.fasb.org/1943274/2147482790/220-10-45-10A
Reference 2: http://www.xbrl.org/2003/role/disclosureRef
-Topic 944
-SubTopic 220
-Name Accounting Standards Codification
-Section S99
-Paragraph 1
-Subparagraph (SX 210.7-04(19))
-Publisher FASB
-URI https://asc.fasb.org/1943274/2147477250/944-220-S99-1
| Name: |
us-gaap_OtherComprehensiveIncomeLossForeignCurrencyTransactionAndTranslationAdjustmentNetOfTax |
| Namespace Prefix: |
us-gaap_ |
| Data Type: |
xbrli:monetaryItemType |
| Balance Type: |
credit |
| Period Type: |
duration |
|
| X |
- DefinitionNumber of shares of stock issued as of the balance sheet date, including shares that had been issued and were previously outstanding but which are now held in the treasury. Reference 1: http://fasb.org/us-gaap/role/ref/legacyRef
-Name Accounting Standards Codification
-Section 50
-Paragraph 2
-SubTopic 10
-Topic 505
-Publisher FASB
-URI https://asc.fasb.org/1943274/2147481112/505-10-50-2
| Name: |
us-gaap_SharesIssued |
| Namespace Prefix: |
us-gaap_ |
| Data Type: |
xbrli:sharesItemType |
| Balance Type: |
na |
| Period Type: |
instant |
|
| X |
- DefinitionAmount of equity (deficit) attributable to parent. Excludes temporary equity and equity attributable to noncontrolling interest. Reference 1: http://fasb.org/us-gaap/role/ref/legacyRef
-Topic 210
-SubTopic 10
-Name Accounting Standards Codification
-Section S99
-Paragraph 1
-Subparagraph (SX 210.5-02(29))
-Publisher FASB
-URI https://asc.fasb.org/1943274/2147480566/210-10-S99-1
Reference 2: http://fasb.org/us-gaap/role/ref/legacyRef
-Topic 210
-SubTopic 10
-Name Accounting Standards Codification
-Section S99
-Paragraph 1
-Subparagraph (SX 210.5-02(30))
-Publisher FASB
-URI https://asc.fasb.org/1943274/2147480566/210-10-S99-1
Reference 3: http://fasb.org/us-gaap/role/ref/legacyRef
-Topic 210
-SubTopic 10
-Name Accounting Standards Codification
-Section S99
-Paragraph 1
-Subparagraph (SX 210.5-02(31))
-Publisher FASB
-URI https://asc.fasb.org/1943274/2147480566/210-10-S99-1
Reference 4: http://www.xbrl.org/2003/role/exampleRef
-Topic 852
-SubTopic 10
-Name Accounting Standards Codification
-Section 55
-Paragraph 10
-Publisher FASB
-URI https://asc.fasb.org/1943274/2147481372/852-10-55-10
Reference 5: http://www.xbrl.org/2003/role/exampleRef
-Topic 946
-SubTopic 830
-Name Accounting Standards Codification
-Section 55
-Paragraph 12
-Publisher FASB
-URI https://asc.fasb.org/1943274/2147479168/946-830-55-12
Reference 6: http://www.xbrl.org/2003/role/disclosureRef
-Topic 946
-SubTopic 210
-Name Accounting Standards Codification
-Section S99
-Paragraph 1
-Subparagraph (SX 210.6-04(19))
-Publisher FASB
-URI https://asc.fasb.org/1943274/2147479170/946-210-S99-1
Reference 7: http://www.xbrl.org/2003/role/disclosureRef
-Topic 946
-SubTopic 210
-Name Accounting Standards Codification
-Section S99
-Paragraph 2
-Subparagraph (SX 210.6-05(4))
-Publisher FASB
-URI https://asc.fasb.org/1943274/2147479170/946-210-S99-2
Reference 8: http://www.xbrl.org/2009/role/commonPracticeRef
-Topic 946
-SubTopic 220
-Name Accounting Standards Codification
-Section S99
-Paragraph 3
-Subparagraph (SX 210.6-09(4)(b))
-Publisher FASB
-URI https://asc.fasb.org/1943274/2147479134/946-220-S99-3
Reference 9: http://www.xbrl.org/2003/role/disclosureRef
-Topic 946
-SubTopic 220
-Name Accounting Standards Codification
-Section S99
-Paragraph 3
-Subparagraph (SX 210.6-09(6))
-Publisher FASB
-URI https://asc.fasb.org/1943274/2147479134/946-220-S99-3
Reference 10: http://www.xbrl.org/2003/role/disclosureRef
-Topic 946
-SubTopic 220
-Name Accounting Standards Codification
-Section S99
-Paragraph 3
-Subparagraph (SX 210.6-09(7))
-Publisher FASB
-URI https://asc.fasb.org/1943274/2147479134/946-220-S99-3
Reference 11: http://www.xbrl.org/2009/role/commonPracticeRef
-Topic 235
-SubTopic 10
-Name Accounting Standards Codification
-Section S99
-Paragraph 1
-Subparagraph (SX 210.4-08(g)(1)(ii))
-Publisher FASB
-URI https://asc.fasb.org/1943274/2147480678/235-10-S99-1
Reference 12: http://www.xbrl.org/2009/role/commonPracticeRef
-Topic 323
-SubTopic 10
-Name Accounting Standards Codification
-Section 50
-Paragraph 3
-Subparagraph (c)
-Publisher FASB
-URI https://asc.fasb.org/1943274/2147481687/323-10-50-3
Reference 13: http://www.xbrl.org/2009/role/commonPracticeRef
-Topic 825
-SubTopic 10
-Name Accounting Standards Codification
-Section 50
-Paragraph 28
-Subparagraph (f)
-Publisher FASB
-URI https://asc.fasb.org/1943274/2147482907/825-10-50-28
Reference 14: http://fasb.org/us-gaap/role/ref/legacyRef
-Topic 310
-SubTopic 10
-Name Accounting Standards Codification
-Section S99
-Paragraph 2
-Subparagraph (SAB Topic 4.E)
-Publisher FASB
-URI https://asc.fasb.org/1943274/2147480418/310-10-S99-2
| Name: |
us-gaap_StockholdersEquity |
| Namespace Prefix: |
us-gaap_ |
| Data Type: |
xbrli:monetaryItemType |
| Balance Type: |
credit |
| Period Type: |
instant |
|
v3.24.2.u1
CONSOLIDATED STATEMENTS OF CASH FLOWS (UNAUDITED) - USD ($)
$ in Thousands |
6 Months Ended |
Jun. 30, 2024 |
Jun. 30, 2023 |
| Cash flows from operating activities: |
|
|
| Net (loss) income |
$ (132)
|
$ 1,219
|
| Adjustments to reconcile net income to net cash provided by operating activities: |
|
|
| Depreciation and amortization |
1,540
|
1,472
|
| Provision for credit losses |
595
|
260
|
| Deferred income taxes |
(72)
|
(299)
|
| Change in fair value of interest rate swaps |
(219)
|
(214)
|
| Stock-based compensation expense |
200
|
691
|
| Non-cash interest adjustment on note payable |
8
|
4
|
| Changes in operating assets and liabilities: |
|
|
| Decrease (increase) in accounts receivable |
(928)
|
(1,587)
|
| Decrease (increase) in other assets |
52
|
(256)
|
| Increase (decrease) in accounts payable |
(230)
|
(89)
|
| Increase (decrease) in accrued expenses |
(110)
|
488
|
| Increase (decrease) in deferred revenue |
92
|
314
|
| Net cash provided by operating activities |
796
|
2,003
|
| Cash flows from investing activities: |
|
|
| Capitalized software |
(400)
|
(167)
|
| Purchase of fixed assets |
(16)
|
(11)
|
| Purchase of acquired business, net of cash received |
0
|
350
|
| Net cash provided by (used in) investing activities |
(416)
|
172
|
| Cash flows from financing activities: |
|
|
| Payment of note payable |
(2,000)
|
(22,000)
|
| Issuance of secured promissory note |
0
|
19,988
|
| Payment for capitalized debt issuance costs |
0
|
(88)
|
| Net cash used in financing activities |
(2,000)
|
(2,100)
|
| Net change in cash and cash equivalents |
(1,620)
|
75
|
| Cash and cash equivalents - beginning |
5,714
|
4,832
|
| Currency translation adjustment |
(74)
|
54
|
| Cash and cash equivalents - ending |
4,020
|
4,961
|
| Supplemental disclosures: |
|
|
| Cash paid for income taxes |
101
|
158
|
| Cash paid for interest |
$ 754
|
$ 887
|
| X |
- References
+ Details
| Name: |
us-gaap_AdjustmentsToReconcileNetIncomeLossToCashProvidedByUsedInOperatingActivitiesAbstract |
| Namespace Prefix: |
us-gaap_ |
| Data Type: |
xbrli:stringItemType |
| Balance Type: |
na |
| Period Type: |
duration |
|
| X |
- DefinitionAmount of cash and cash equivalents, and cash and cash equivalents restricted to withdrawal or usage. Excludes amount for disposal group and discontinued operations. Cash includes, but is not limited to, currency on hand, demand deposits with banks or financial institutions, and other accounts with general characteristics of demand deposits. Cash equivalents include, but are not limited to, short-term, highly liquid investments that are both readily convertible to known amounts of cash and so near their maturity that they present insignificant risk of changes in value because of changes in interest rates. Reference 1: http://www.xbrl.org/2003/role/disclosureRef
-Topic 230
-SubTopic 10
-Name Accounting Standards Codification
-Section 50
-Paragraph 8
-Publisher FASB
-URI https://asc.fasb.org/1943274/2147482913/230-10-50-8
Reference 2: http://fasb.org/us-gaap/role/ref/legacyRef
-Topic 230
-SubTopic 10
-Name Accounting Standards Codification
-Section 45
-Paragraph 24
-Publisher FASB
-URI https://asc.fasb.org/1943274/2147482740/230-10-45-24
Reference 3: http://fasb.org/us-gaap/role/ref/legacyRef
-Name Accounting Standards Codification
-Topic 230
-SubTopic 10
-Section 45
-Paragraph 4
-Publisher FASB
-URI https://asc.fasb.org/1943274/2147482740/230-10-45-4
| Name: |
us-gaap_CashCashEquivalentsRestrictedCashAndRestrictedCashEquivalents |
| Namespace Prefix: |
us-gaap_ |
| Data Type: |
xbrli:monetaryItemType |
| Balance Type: |
debit |
| Period Type: |
instant |
|
| X |
- DefinitionAmount of increase (decrease) in cash and cash equivalents, and cash and cash equivalents restricted to withdrawal or usage; excluding effect from exchange rate change. Cash includes, but is not limited to, currency on hand, demand deposits with banks or financial institutions, and other accounts with general characteristics of demand deposits. Cash equivalents include, but are not limited to, short-term, highly liquid investments that are both readily convertible to known amounts of cash and so near their maturity that they present insignificant risk of changes in value because of changes in interest rates. Reference 1: http://fasb.org/us-gaap/role/ref/legacyRef
-Topic 230
-SubTopic 10
-Name Accounting Standards Codification
-Section 45
-Paragraph 24
-Publisher FASB
-URI https://asc.fasb.org/1943274/2147482740/230-10-45-24
Reference 2: http://fasb.org/us-gaap/role/ref/legacyRef
-Name Accounting Standards Codification
-Section 45
-Paragraph 1
-SubTopic 230
-Topic 830
-Publisher FASB
-URI https://asc.fasb.org/1943274/2147477401/830-230-45-1
| Name: |
us-gaap_CashCashEquivalentsRestrictedCashAndRestrictedCashEquivalentsPeriodIncreaseDecreaseExcludingExchangeRateEffect |
| Namespace Prefix: |
us-gaap_ |
| Data Type: |
xbrli:monetaryItemType |
| Balance Type: |
debit |
| Period Type: |
duration |
|
| X |
- DefinitionThe aggregate expense recognized in the current period that allocates the cost of tangible assets, intangible assets, or depleting assets to periods that benefit from use of the assets. Reference 1: http://fasb.org/us-gaap/role/ref/legacyRef
-Name Accounting Standards Codification
-Section 45
-Paragraph 28
-Subparagraph (b)
-SubTopic 10
-Topic 230
-Publisher FASB
-URI https://asc.fasb.org/1943274/2147482740/230-10-45-28
Reference 2: http://www.xbrl.org/2003/role/exampleRef
-Topic 280
-SubTopic 10
-Name Accounting Standards Codification
-Section 55
-Paragraph 48
-Publisher FASB
-URI https://asc.fasb.org/1943274/2147482785/280-10-55-48
Reference 3: http://www.xbrl.org/2003/role/exampleRef
-Topic 280
-SubTopic 10
-Name Accounting Standards Codification
-Section 55
-Paragraph 49
-Publisher FASB
-URI https://asc.fasb.org/1943274/2147482785/280-10-55-49
Reference 4: http://www.xbrl.org/2003/role/disclosureRef
-Topic 270
-SubTopic 10
-Name Accounting Standards Codification
-Section 50
-Paragraph 1
-Subparagraph (i)
-Publisher FASB
-URI https://asc.fasb.org/1943274/2147482964/270-10-50-1
Reference 5: http://www.xbrl.org/2003/role/disclosureRef
-Topic 280
-SubTopic 10
-Name Accounting Standards Codification
-Section 50
-Paragraph 32
-Subparagraph (ee)
-Publisher FASB
-URI https://asc.fasb.org/1943274/2147482810/280-10-50-32
Reference 6: http://www.xbrl.org/2003/role/disclosureRef
-Topic 280
-SubTopic 10
-Name Accounting Standards Codification
-Section 50
-Paragraph 22
-Subparagraph (e)
-Publisher FASB
-URI https://asc.fasb.org/1943274/2147482810/280-10-50-22
| Name: |
us-gaap_DepreciationDepletionAndAmortization |
| Namespace Prefix: |
us-gaap_ |
| Data Type: |
xbrli:monetaryItemType |
| Balance Type: |
debit |
| Period Type: |
duration |
|
| X |
- DefinitionAmount of increase (decrease) from effect of exchange rate changes on cash and cash equivalents, and cash and cash equivalents restricted to withdrawal or usage; held in foreign currencies. Excludes amounts for disposal group and discontinued operations. Cash includes, but is not limited to, currency on hand, demand deposits with banks or financial institutions, and other accounts with general characteristics of demand deposits. Cash equivalents include, but are not limited to, short-term, highly liquid investments that are both readily convertible to known amounts of cash and so near their maturity that they present insignificant risk of changes in value because of changes in interest rates. Reference 1: http://www.xbrl.org/2003/role/disclosureRef
-Topic 830
-SubTopic 230
-Name Accounting Standards Codification
-Section 45
-Paragraph 1
-Publisher FASB
-URI https://asc.fasb.org/1943274/2147477401/830-230-45-1
| Name: |
us-gaap_EffectOfExchangeRateOnCashCashEquivalentsRestrictedCashAndRestrictedCashEquivalents |
| Namespace Prefix: |
us-gaap_ |
| Data Type: |
xbrli:monetaryItemType |
| Balance Type: |
debit |
| Period Type: |
duration |
|
| X |
- DefinitionThe increase (decrease) during the reporting period in the aggregate amount of liabilities incurred (and for which invoices have typically been received) and payable to vendors for goods and services received that are used in an entity's business. Reference 1: http://fasb.org/us-gaap/role/ref/legacyRef
-Name Accounting Standards Codification
-Section 45
-Paragraph 28
-Subparagraph (a)
-SubTopic 10
-Topic 230
-Publisher FASB
-URI https://asc.fasb.org/1943274/2147482740/230-10-45-28
| Name: |
us-gaap_IncreaseDecreaseInAccountsPayable |
| Namespace Prefix: |
us-gaap_ |
| Data Type: |
xbrli:monetaryItemType |
| Balance Type: |
debit |
| Period Type: |
duration |
|
| X |
- DefinitionThe increase (decrease) during the reporting period in amount due within one year (or one business cycle) from customers for the credit sale of goods and services. Reference 1: http://fasb.org/us-gaap/role/ref/legacyRef
-Name Accounting Standards Codification
-Section 45
-Paragraph 28
-Subparagraph (a)
-SubTopic 10
-Topic 230
-Publisher FASB
-URI https://asc.fasb.org/1943274/2147482740/230-10-45-28
| Name: |
us-gaap_IncreaseDecreaseInAccountsReceivable |
| Namespace Prefix: |
us-gaap_ |
| Data Type: |
xbrli:monetaryItemType |
| Balance Type: |
credit |
| Period Type: |
duration |
|
| X |
- DefinitionThe increase (decrease) during the reporting period in the aggregate amount of expenses incurred but not yet paid. Reference 1: http://fasb.org/us-gaap/role/ref/legacyRef
-Name Accounting Standards Codification
-Section 45
-Paragraph 28
-Subparagraph (a)
-SubTopic 10
-Topic 230
-Publisher FASB
-URI https://asc.fasb.org/1943274/2147482740/230-10-45-28
| Name: |
us-gaap_IncreaseDecreaseInAccruedLiabilities |
| Namespace Prefix: |
us-gaap_ |
| Data Type: |
xbrli:monetaryItemType |
| Balance Type: |
debit |
| Period Type: |
duration |
|
| X |
- DefinitionAmount of increase (decrease) in deferred income and obligation to transfer product and service to customer for which consideration has been received or is receivable. Reference 1: http://www.xbrl.org/2003/role/exampleRef
-Name Accounting Standards Codification
-Section 45
-Paragraph 28
-Subparagraph (a)
-SubTopic 10
-Topic 230
-Publisher FASB
-URI https://asc.fasb.org/1943274/2147482740/230-10-45-28
| Name: |
us-gaap_IncreaseDecreaseInDeferredRevenue |
| Namespace Prefix: |
us-gaap_ |
| Data Type: |
xbrli:monetaryItemType |
| Balance Type: |
debit |
| Period Type: |
duration |
|
| X |
- References
+ Details
| Name: |
us-gaap_IncreaseDecreaseInOperatingCapitalAbstract |
| Namespace Prefix: |
us-gaap_ |
| Data Type: |
xbrli:stringItemType |
| Balance Type: |
na |
| Period Type: |
duration |
|
| X |
- DefinitionAmount of increase (decrease) in operating assets classified as other. Reference 1: http://fasb.org/us-gaap/role/ref/legacyRef
-Name Accounting Standards Codification
-Section 45
-Paragraph 28
-Subparagraph (a)
-SubTopic 10
-Topic 230
-Publisher FASB
-URI https://asc.fasb.org/1943274/2147482740/230-10-45-28
| Name: |
us-gaap_IncreaseDecreaseInOtherOperatingAssets |
| Namespace Prefix: |
us-gaap_ |
| Data Type: |
xbrli:monetaryItemType |
| Balance Type: |
credit |
| Period Type: |
duration |
|
| X |
- DefinitionAmount of interest income (expense) classified as nonoperating. Reference 1: http://www.xbrl.org/2009/role/commonPracticeRef
-Topic 220
-SubTopic 10
-Name Accounting Standards Codification
-Section S99
-Paragraph 2
-Subparagraph (SX 210.5-03)
-Publisher FASB
-URI https://asc.fasb.org/1943274/2147483621/220-10-S99-2
Reference 2: http://www.xbrl.org/2009/role/commonPracticeRef
-Topic 280
-SubTopic 10
-Name Accounting Standards Codification
-Section 50
-Paragraph 22
-Publisher FASB
-URI https://asc.fasb.org/1943274/2147482810/280-10-50-22
Reference 3: http://www.xbrl.org/2003/role/exampleRef
-Topic 280
-SubTopic 10
-Name Accounting Standards Codification
-Section 55
-Paragraph 48
-Publisher FASB
-URI https://asc.fasb.org/1943274/2147482785/280-10-55-48
| Name: |
us-gaap_InterestIncomeExpenseNonoperatingNet |
| Namespace Prefix: |
us-gaap_ |
| Data Type: |
xbrli:monetaryItemType |
| Balance Type: |
credit |
| Period Type: |
duration |
|
| X |
- DefinitionAmount of cash paid for interest, excluding capitalized interest, classified as operating activity. Includes, but is not limited to, payment to settle zero-coupon bond for accreted interest of debt discount and debt instrument with insignificant coupon interest rate in relation to effective interest rate of borrowing attributable to accreted interest of debt discount. Reference 1: http://www.xbrl.org/2003/role/disclosureRef
-Topic 230
-SubTopic 10
-Name Accounting Standards Codification
-Section 45
-Paragraph 17
-Subparagraph (d)
-Publisher FASB
-URI https://asc.fasb.org/1943274/2147482740/230-10-45-17
Reference 2: http://www.xbrl.org/2003/role/disclosureRef
-Topic 230
-SubTopic 10
-Name Accounting Standards Codification
-Section 45
-Paragraph 25
-Subparagraph (e)
-Publisher FASB
-URI https://asc.fasb.org/1943274/2147482740/230-10-45-25
Reference 3: http://www.xbrl.org/2003/role/disclosureRef
-Topic 230
-SubTopic 10
-Name Accounting Standards Codification
-Section 50
-Paragraph 2
-Publisher FASB
-URI https://asc.fasb.org/1943274/2147482913/230-10-50-2
| Name: |
us-gaap_InterestPaidNet |
| Namespace Prefix: |
us-gaap_ |
| Data Type: |
xbrli:monetaryItemType |
| Balance Type: |
credit |
| Period Type: |
duration |
|
| X |
- DefinitionAmount of cash inflow (outflow) from financing activities, including discontinued operations. Financing activity cash flows include obtaining resources from owners and providing them with a return on, and a return of, their investment; borrowing money and repaying amounts borrowed, or settling the obligation; and obtaining and paying for other resources obtained from creditors on long-term credit. Reference 1: http://www.xbrl.org/2003/role/disclosureRef
-Topic 230
-SubTopic 10
-Name Accounting Standards Codification
-Section 45
-Paragraph 24
-Publisher FASB
-URI https://asc.fasb.org/1943274/2147482740/230-10-45-24
| Name: |
us-gaap_NetCashProvidedByUsedInFinancingActivities |
| Namespace Prefix: |
us-gaap_ |
| Data Type: |
xbrli:monetaryItemType |
| Balance Type: |
debit |
| Period Type: |
duration |
|
| X |
- References
+ Details
| Name: |
us-gaap_NetCashProvidedByUsedInFinancingActivitiesAbstract |
| Namespace Prefix: |
us-gaap_ |
| Data Type: |
xbrli:stringItemType |
| Balance Type: |
na |
| Period Type: |
duration |
|
| X |
- DefinitionAmount of cash inflow (outflow) from investing activities, including discontinued operations. Investing activity cash flows include making and collecting loans and acquiring and disposing of debt or equity instruments and property, plant, and equipment and other productive assets. Reference 1: http://www.xbrl.org/2003/role/disclosureRef
-Topic 230
-SubTopic 10
-Name Accounting Standards Codification
-Section 45
-Paragraph 24
-Publisher FASB
-URI https://asc.fasb.org/1943274/2147482740/230-10-45-24
| Name: |
us-gaap_NetCashProvidedByUsedInInvestingActivities |
| Namespace Prefix: |
us-gaap_ |
| Data Type: |
xbrli:monetaryItemType |
| Balance Type: |
debit |
| Period Type: |
duration |
|
| X |
- References
+ Details
| Name: |
us-gaap_NetCashProvidedByUsedInInvestingActivitiesAbstract |
| Namespace Prefix: |
us-gaap_ |
| Data Type: |
xbrli:stringItemType |
| Balance Type: |
na |
| Period Type: |
duration |
|
| X |
- DefinitionAmount of cash inflow (outflow) from operating activities, including discontinued operations. Operating activity cash flows include transactions, adjustments, and changes in value not defined as investing or financing activities. Reference 1: http://fasb.org/us-gaap/role/ref/legacyRef
-Topic 230
-SubTopic 10
-Name Accounting Standards Codification
-Section 45
-Paragraph 28
-Publisher FASB
-URI https://asc.fasb.org/1943274/2147482740/230-10-45-28
Reference 2: http://fasb.org/us-gaap/role/ref/legacyRef
-Topic 230
-SubTopic 10
-Name Accounting Standards Codification
-Section 45
-Paragraph 24
-Publisher FASB
-URI https://asc.fasb.org/1943274/2147482740/230-10-45-24
Reference 3: http://fasb.org/us-gaap/role/ref/legacyRef
-Topic 230
-SubTopic 10
-Name Accounting Standards Codification
-Section 45
-Paragraph 25
-Publisher FASB
-URI https://asc.fasb.org/1943274/2147482740/230-10-45-25
| Name: |
us-gaap_NetCashProvidedByUsedInOperatingActivities |
| Namespace Prefix: |
us-gaap_ |
| Data Type: |
xbrli:monetaryItemType |
| Balance Type: |
na |
| Period Type: |
duration |
|
| X |
- References
+ Details
| Name: |
us-gaap_NetCashProvidedByUsedInOperatingActivitiesAbstract |
| Namespace Prefix: |
us-gaap_ |
| Data Type: |
xbrli:stringItemType |
| Balance Type: |
na |
| Period Type: |
duration |
|
| X |
- DefinitionInterest paid other than in cash for example by issuing additional debt securities. As a noncash item, it is added to net income when calculating cash provided by or used in operations using the indirect method. Reference 1: http://fasb.org/us-gaap/role/ref/legacyRef
-Name Accounting Standards Codification
-Section 45
-Paragraph 28
-Subparagraph (b)
-SubTopic 10
-Topic 230
-Publisher FASB
-URI https://asc.fasb.org/1943274/2147482740/230-10-45-28
| Name: |
us-gaap_PaidInKindInterest |
| Namespace Prefix: |
us-gaap_ |
| Data Type: |
xbrli:monetaryItemType |
| Balance Type: |
debit |
| Period Type: |
duration |
|
| X |
- DefinitionThe cash outflow paid to third parties in connection with debt origination, which will be amortized over the remaining maturity period of the associated long-term debt. Reference 1: http://fasb.org/us-gaap/role/ref/legacyRef
-Name Accounting Standards Codification
-Topic 230
-SubTopic 10
-Section 45
-Paragraph 15
-Subparagraph (e)
-Publisher FASB
-URI https://asc.fasb.org/1943274/2147482740/230-10-45-15
| Name: |
us-gaap_PaymentsOfDebtIssuanceCosts |
| Namespace Prefix: |
us-gaap_ |
| Data Type: |
xbrli:monetaryItemType |
| Balance Type: |
credit |
| Period Type: |
duration |
|
| X |
- DefinitionThe cash outflow associated with the acquisition of a business, net of the cash acquired from the purchase. Reference 1: http://fasb.org/us-gaap/role/ref/legacyRef
-Name Accounting Standards Codification
-Topic 230
-SubTopic 10
-Section 45
-Paragraph 13
-Subparagraph (b)
-Publisher FASB
-URI https://asc.fasb.org/1943274/2147482740/230-10-45-13
| Name: |
us-gaap_PaymentsToAcquireBusinessesNetOfCashAcquired |
| Namespace Prefix: |
us-gaap_ |
| Data Type: |
xbrli:monetaryItemType |
| Balance Type: |
credit |
| Period Type: |
duration |
|
| X |
- DefinitionThe cash outflow associated with the acquisition of long-lived, physical assets that are used in the normal conduct of business to produce goods and services and not intended for resale; includes cash outflows to pay for construction of self-constructed assets. Reference 1: http://fasb.org/us-gaap/role/ref/legacyRef
-Topic 230
-SubTopic 10
-Name Accounting Standards Codification
-Section 45
-Paragraph 13
-Subparagraph (c)
-Publisher FASB
-URI https://asc.fasb.org/1943274/2147482740/230-10-45-13
| Name: |
us-gaap_PaymentsToAcquirePropertyPlantAndEquipment |
| Namespace Prefix: |
us-gaap_ |
| Data Type: |
xbrli:monetaryItemType |
| Balance Type: |
credit |
| Period Type: |
duration |
|
| X |
- DefinitionThe cash outflow associated with the acquisition from vendors of software programs or applications for internal use (that is, not to be sold, leased or otherwise marketed to others) that qualify for capitalization. Reference 1: http://fasb.org/us-gaap/role/ref/legacyRef
-Topic 230
-SubTopic 10
-Name Accounting Standards Codification
-Section 45
-Paragraph 13
-Subparagraph (c)
-Publisher FASB
-URI https://asc.fasb.org/1943274/2147482740/230-10-45-13
| Name: |
us-gaap_PaymentsToAcquireSoftware |
| Namespace Prefix: |
us-gaap_ |
| Data Type: |
xbrli:monetaryItemType |
| Balance Type: |
credit |
| Period Type: |
duration |
|
| X |
- DefinitionThe cash inflow from borrowings supported by a written promise to pay an obligation that is uncollateralized (where debt is not backed by the pledge of collateral). Reference 1: http://fasb.org/us-gaap/role/ref/legacyRef
-Name Accounting Standards Codification
-Topic 230
-SubTopic 10
-Section 45
-Paragraph 14
-Subparagraph (b)
-Publisher FASB
-URI https://asc.fasb.org/1943274/2147482740/230-10-45-14
| Name: |
us-gaap_ProceedsFromUnsecuredNotesPayable |
| Namespace Prefix: |
us-gaap_ |
| Data Type: |
xbrli:monetaryItemType |
| Balance Type: |
debit |
| Period Type: |
duration |
|
| X |
- DefinitionThe consolidated profit or loss for the period, net of income taxes, including the portion attributable to the noncontrolling interest. Reference 1: http://www.xbrl.org/2003/role/disclosureRef
-Topic 250
-SubTopic 10
-Name Accounting Standards Codification
-Section 50
-Paragraph 6
-Publisher FASB
-URI https://asc.fasb.org/1943274/2147483443/250-10-50-6
Reference 2: http://www.xbrl.org/2003/role/disclosureRef
-Topic 250
-SubTopic 10
-Name Accounting Standards Codification
-Section 50
-Paragraph 9
-Publisher FASB
-URI https://asc.fasb.org/1943274/2147483443/250-10-50-9
Reference 3: http://www.xbrl.org/2003/role/disclosureRef
-Topic 805
-SubTopic 60
-Name Accounting Standards Codification
-Section 65
-Paragraph 1
-Subparagraph (g)
-Publisher FASB
-URI https://asc.fasb.org/1943274/2147476176/805-60-65-1
Reference 4: http://www.xbrl.org/2003/role/disclosureRef
-Topic 740
-SubTopic 323
-Name Accounting Standards Codification
-Section 65
-Paragraph 2
-Subparagraph (g)(3)
-Publisher FASB
-URI https://asc.fasb.org/1943274/2147478666/740-323-65-2
Reference 5: http://www.xbrl.org/2003/role/disclosureRef
-Topic 235
-SubTopic 10
-Name Accounting Standards Codification
-Section S99
-Paragraph 1
-Subparagraph (SX 210.4-08(g)(1)(ii))
-Publisher FASB
-URI https://asc.fasb.org/1943274/2147480678/235-10-S99-1
Reference 6: http://www.xbrl.org/2003/role/disclosureRef
-Topic 323
-SubTopic 10
-Name Accounting Standards Codification
-Section 50
-Paragraph 3
-Subparagraph (c)
-Publisher FASB
-URI https://asc.fasb.org/1943274/2147481687/323-10-50-3
Reference 7: http://www.xbrl.org/2003/role/disclosureRef
-Topic 825
-SubTopic 10
-Name Accounting Standards Codification
-Section 50
-Paragraph 28
-Subparagraph (f)
-Publisher FASB
-URI https://asc.fasb.org/1943274/2147482907/825-10-50-28
Reference 8: http://www.xbrl.org/2003/role/disclosureRef
-Topic 250
-SubTopic 10
-Name Accounting Standards Codification
-Section 50
-Paragraph 1
-Subparagraph (b)(2)
-Publisher FASB
-URI https://asc.fasb.org/1943274/2147483443/250-10-50-1
Reference 9: http://www.xbrl.org/2003/role/disclosureRef
-Topic 815
-SubTopic 40
-Name Accounting Standards Codification
-Section 65
-Paragraph 1
-Subparagraph (f)
-Publisher FASB
-URI https://asc.fasb.org/1943274/2147480175/815-40-65-1
Reference 10: http://www.xbrl.org/2003/role/disclosureRef
-Topic 250
-SubTopic 10
-Name Accounting Standards Codification
-Section 50
-Paragraph 8
-Publisher FASB
-URI https://asc.fasb.org/1943274/2147483443/250-10-50-8
Reference 11: http://www.xbrl.org/2003/role/exampleRef
-Topic 946
-SubTopic 830
-Name Accounting Standards Codification
-Section 55
-Paragraph 11
-Publisher FASB
-URI https://asc.fasb.org/1943274/2147479168/946-830-55-11
Reference 12: http://www.xbrl.org/2003/role/disclosureRef
-Topic 946
-SubTopic 205
-Name Accounting Standards Codification
-Section 45
-Paragraph 3
-Subparagraph (a)
-Publisher FASB
-URI https://asc.fasb.org/1943274/2147478009/946-205-45-3
Reference 13: http://www.xbrl.org/2003/role/disclosureRef
-Topic 946
-SubTopic 220
-Name Accounting Standards Codification
-Section 45
-Paragraph 7
-Publisher FASB
-URI https://asc.fasb.org/1943274/2147479105/946-220-45-7
Reference 14: http://www.xbrl.org/2003/role/disclosureRef
-Topic 944
-SubTopic 220
-Name Accounting Standards Codification
-Section S99
-Paragraph 1
-Subparagraph (SX 210.7-04(16))
-Publisher FASB
-URI https://asc.fasb.org/1943274/2147477250/944-220-S99-1
Reference 15: http://www.xbrl.org/2003/role/disclosureRef
-Topic 946
-SubTopic 220
-Name Accounting Standards Codification
-Section S99
-Paragraph 1
-Subparagraph (SX 210.6-07(9))
-Publisher FASB
-URI https://asc.fasb.org/1943274/2147479134/946-220-S99-1
Reference 16: http://www.xbrl.org/2003/role/disclosureRef
-Topic 946
-SubTopic 220
-Name Accounting Standards Codification
-Section S99
-Paragraph 3
-Subparagraph (SX 210.6-09(1)(d))
-Publisher FASB
-URI https://asc.fasb.org/1943274/2147479134/946-220-S99-3
Reference 17: http://www.xbrl.org/2003/role/disclosureRef
-Topic 810
-SubTopic 10
-Name Accounting Standards Codification
-Section 45
-Paragraph 19
-Publisher FASB
-URI https://asc.fasb.org/1943274/2147481231/810-10-45-19
Reference 18: http://www.xbrl.org/2009/role/commonPracticeRef
-Topic 220
-SubTopic 10
-Name Accounting Standards Codification
-Section 50
-Paragraph 6
-Publisher FASB
-URI https://asc.fasb.org/1943274/2147482765/220-10-50-6
Reference 19: http://www.xbrl.org/2003/role/disclosureRef
-Topic 470
-SubTopic 10
-Name Accounting Standards Codification
-Section S99
-Paragraph 1A
-Subparagraph (SX 210.13-01(a)(4)(i))
-Publisher FASB
-URI https://asc.fasb.org/1943274/2147480097/470-10-S99-1A
Reference 20: http://www.xbrl.org/2009/role/commonPracticeRef
-Topic 470
-SubTopic 10
-Name Accounting Standards Codification
-Section S99
-Paragraph 1A
-Subparagraph (SX 210.13-01(a)(4)(ii))
-Publisher FASB
-URI https://asc.fasb.org/1943274/2147480097/470-10-S99-1A
Reference 21: http://www.xbrl.org/2003/role/disclosureRef
-Topic 470
-SubTopic 10
-Name Accounting Standards Codification
-Section S99
-Paragraph 1A
-Subparagraph (SX 210.13-01(a)(4)(iii)(A))
-Publisher FASB
-URI https://asc.fasb.org/1943274/2147480097/470-10-S99-1A
Reference 22: http://www.xbrl.org/2003/role/disclosureRef
-Topic 470
-SubTopic 10
-Name Accounting Standards Codification
-Section S99
-Paragraph 1A
-Subparagraph (SX 210.13-01(a)(4)(iv))
-Publisher FASB
-URI https://asc.fasb.org/1943274/2147480097/470-10-S99-1A
Reference 23: http://www.xbrl.org/2003/role/disclosureRef
-Topic 470
-SubTopic 10
-Name Accounting Standards Codification
-Section S99
-Paragraph 1A
-Subparagraph (SX 210.13-01(a)(5))
-Publisher FASB
-URI https://asc.fasb.org/1943274/2147480097/470-10-S99-1A
Reference 24: http://www.xbrl.org/2003/role/disclosureRef
-Topic 470
-SubTopic 10
-Name Accounting Standards Codification
-Section S99
-Paragraph 1B
-Subparagraph (SX 210.13-02(a)(4)(i))
-Publisher FASB
-URI https://asc.fasb.org/1943274/2147480097/470-10-S99-1B
Reference 25: http://www.xbrl.org/2003/role/disclosureRef
-Topic 470
-SubTopic 10
-Name Accounting Standards Codification
-Section S99
-Paragraph 1B
-Subparagraph (SX 210.13-02(a)(4)(iii)(A))
-Publisher FASB
-URI https://asc.fasb.org/1943274/2147480097/470-10-S99-1B
Reference 26: http://www.xbrl.org/2003/role/disclosureRef
-Topic 470
-SubTopic 10
-Name Accounting Standards Codification
-Section S99
-Paragraph 1B
-Subparagraph (SX 210.13-02(a)(4)(iii)(B))
-Publisher FASB
-URI https://asc.fasb.org/1943274/2147480097/470-10-S99-1B
Reference 27: http://www.xbrl.org/2003/role/disclosureRef
-Topic 470
-SubTopic 10
-Name Accounting Standards Codification
-Section S99
-Paragraph 1B
-Subparagraph (SX 210.13-02(a)(4)(iv))
-Publisher FASB
-URI https://asc.fasb.org/1943274/2147480097/470-10-S99-1B
Reference 28: http://www.xbrl.org/2003/role/disclosureRef
-Topic 470
-SubTopic 10
-Name Accounting Standards Codification
-Section S99
-Paragraph 1B
-Subparagraph (SX 210.13-02(a)(5))
-Publisher FASB
-URI https://asc.fasb.org/1943274/2147480097/470-10-S99-1B
Reference 29: http://www.xbrl.org/2003/role/disclosureRef
-Topic 942
-SubTopic 235
-Name Accounting Standards Codification
-Section S99
-Paragraph 1
-Subparagraph (SX 210.9-05(b)(2))
-Publisher FASB
-URI https://asc.fasb.org/1943274/2147477314/942-235-S99-1
Reference 30: http://www.xbrl.org/2003/role/disclosureRef
-Topic 205
-SubTopic 20
-Name Accounting Standards Codification
-Section 50
-Paragraph 7
-Publisher FASB
-URI https://asc.fasb.org/1943274/2147483499/205-20-50-7
Reference 31: http://www.xbrl.org/2003/role/exampleRef
-Topic 810
-SubTopic 10
-Name Accounting Standards Codification
-Section 55
-Paragraph 4J
-Publisher FASB
-URI https://asc.fasb.org/1943274/2147481175/810-10-55-4J
Reference 32: http://www.xbrl.org/2003/role/exampleRef
-Topic 810
-SubTopic 10
-Name Accounting Standards Codification
-Section 55
-Paragraph 4K
-Publisher FASB
-URI https://asc.fasb.org/1943274/2147481175/810-10-55-4K
Reference 33: http://www.xbrl.org/2003/role/disclosureRef
-Topic 220
-SubTopic 10
-Name Accounting Standards Codification
-Section 45
-Paragraph 1A
-Subparagraph (a)
-Publisher FASB
-URI https://asc.fasb.org/1943274/2147482790/220-10-45-1A
Reference 34: http://www.xbrl.org/2003/role/disclosureRef
-Topic 220
-SubTopic 10
-Name Accounting Standards Codification
-Section 45
-Paragraph 1B
-Subparagraph (a)
-Publisher FASB
-URI https://asc.fasb.org/1943274/2147482790/220-10-45-1B
Reference 35: http://www.xbrl.org/2003/role/disclosureRef
-Topic 230
-SubTopic 10
-Name Accounting Standards Codification
-Section 45
-Paragraph 2
-Publisher FASB
-URI https://asc.fasb.org/1943274/2147482740/230-10-45-2
Reference 36: http://www.xbrl.org/2003/role/disclosureRef
-Topic 810
-SubTopic 10
-Name Accounting Standards Codification
-Section 50
-Paragraph 1A
-Subparagraph (a)(1)
-Publisher FASB
-URI https://asc.fasb.org/1943274/2147481203/810-10-50-1A
Reference 37: http://www.xbrl.org/2003/role/disclosureRef
-Topic 810
-SubTopic 10
-Name Accounting Standards Codification
-Section 50
-Paragraph 1A
-Subparagraph (c)(1)
-Publisher FASB
-URI https://asc.fasb.org/1943274/2147481203/810-10-50-1A
| Name: |
us-gaap_ProfitLoss |
| Namespace Prefix: |
us-gaap_ |
| Data Type: |
xbrli:monetaryItemType |
| Balance Type: |
credit |
| Period Type: |
duration |
|
| X |
- DefinitionAmount of expense related to credit loss from transactions other than loan and lease transactions. Reference 1: http://fasb.org/us-gaap/role/ref/legacyRef
-Name Accounting Standards Codification
-Section 45
-Paragraph 28
-Subparagraph (a)
-SubTopic 10
-Topic 230
-Publisher FASB
-URI https://asc.fasb.org/1943274/2147482740/230-10-45-28
Reference 2: http://fasb.org/us-gaap/role/ref/legacyRef
-Topic 942
-SubTopic 220
-Name Accounting Standards Codification
-Section S99
-Paragraph 1
-Subparagraph (SX 210.9-04(11))
-Publisher FASB
-URI https://asc.fasb.org/1943274/2147478524/942-220-S99-1
| Name: |
us-gaap_ProvisionForOtherCreditLosses |
| Namespace Prefix: |
us-gaap_ |
| Data Type: |
xbrli:monetaryItemType |
| Balance Type: |
debit |
| Period Type: |
duration |
|
| X |
- DefinitionThe cash outflow for a borrowing supported by a written promise to pay an obligation. Reference 1: http://fasb.org/us-gaap/role/ref/legacyRef
-Topic 230
-SubTopic 10
-Name Accounting Standards Codification
-Section 45
-Paragraph 15
-Subparagraph (b)
-Publisher FASB
-URI https://asc.fasb.org/1943274/2147482740/230-10-45-15
| Name: |
us-gaap_RepaymentsOfNotesPayable |
| Namespace Prefix: |
us-gaap_ |
| Data Type: |
xbrli:monetaryItemType |
| Balance Type: |
credit |
| Period Type: |
duration |
|
| X |
- DefinitionAmount of noncash expense for share-based payment arrangement. Reference 1: http://fasb.org/us-gaap/role/ref/legacyRef
-Name Accounting Standards Codification
-Section 45
-Paragraph 28
-Subparagraph (a)
-SubTopic 10
-Topic 230
-Publisher FASB
-URI https://asc.fasb.org/1943274/2147482740/230-10-45-28
| Name: |
us-gaap_ShareBasedCompensation |
| Namespace Prefix: |
us-gaap_ |
| Data Type: |
xbrli:monetaryItemType |
| Balance Type: |
debit |
| Period Type: |
duration |
|
| X |
- DefinitionThe net change in the difference between the fair value and the carrying value, or in the comparative fair values, of derivative instruments, including options, swaps, futures, and forward contracts, held at each balance sheet date, that was included in earnings for the period. Reference 1: http://fasb.org/us-gaap/role/ref/legacyRef
-Name Accounting Standards Codification
-Section 45
-Paragraph 28
-Subparagraph (b)
-SubTopic 10
-Topic 230
-Publisher FASB
-URI https://asc.fasb.org/1943274/2147482740/230-10-45-28
Reference 2: http://www.xbrl.org/2003/role/disclosureRef
-Topic 946
-SubTopic 220
-Name Accounting Standards Codification
-Section S99
-Paragraph 1
-Subparagraph (SX 210.6-07(7)(c)(3))
-Publisher FASB
-URI https://asc.fasb.org/1943274/2147479134/946-220-S99-1
Reference 3: http://www.xbrl.org/2003/role/disclosureRef
-Topic 946
-SubTopic 220
-Name Accounting Standards Codification
-Section S99
-Paragraph 1
-Subparagraph (SX 210.6-07(7)(c)(5))
-Publisher FASB
-URI https://asc.fasb.org/1943274/2147479134/946-220-S99-1
Reference 4: http://www.xbrl.org/2003/role/disclosureRef
-Topic 946
-SubTopic 220
-Name Accounting Standards Codification
-Section S99
-Paragraph 1
-Subparagraph (SX 210.6-07(7)(c)(6))
-Publisher FASB
-URI https://asc.fasb.org/1943274/2147479134/946-220-S99-1
Reference 5: http://www.xbrl.org/2003/role/disclosureRef
-Topic 946
-SubTopic 220
-Name Accounting Standards Codification
-Section S99
-Paragraph 1
-Subparagraph (SX 210.6-07(7)(c)(7))
-Publisher FASB
-URI https://asc.fasb.org/1943274/2147479134/946-220-S99-1
Reference 6: http://www.xbrl.org/2003/role/disclosureRef
-Topic 946
-SubTopic 320
-Name Accounting Standards Codification
-Section S99
-Paragraph 5A
-Subparagraph (SX 210.12-13A(Column F))
-Publisher FASB
-URI https://asc.fasb.org/1943274/2147477271/946-320-S99-5A
| Name: |
us-gaap_UnrealizedGainLossOnDerivatives |
| Namespace Prefix: |
us-gaap_ |
| Data Type: |
xbrli:monetaryItemType |
| Balance Type: |
credit |
| Period Type: |
duration |
|
v3.24.2.u1
Basis of Presentation
|
6 Months Ended |
Jun. 30, 2024 |
|---|
| Basis of Presentation |
|
| Basis of Presentation |
Note 1. Basis of Presentation The unaudited interim consolidated balance sheet as of June 30, 2024 and consolidated statements of operations, comprehensive income, stockholders’ equity and cash flows for the three and six-month periods ended June 30, 2024 and 2023 included herein, have been prepared in accordance with the instructions for Form 10-Q under the Securities Exchange Act of 1934, as amended (the “Exchange Act”), and Article 10 of Regulation S-X under the Exchange Act. In the opinion of management, they include all normal recurring adjustments necessary for a fair presentation of the financial statements. Results of operations reported for the interim periods are not necessarily indicative of results for the entire year. Certain information and footnote disclosures normally included in financial statements prepared in accordance with accounting principles generally accepted in the United States ("US GAAP") have been condensed or omitted pursuant to such rules and regulations relating to interim financial statements. The interim financial information should be read in conjunction with the 2023 audited financial statements of Issuer Direct Corporation (the “Company”, “We”, or “Our”) filed on Form 10-K for the year ended December 31, 2023.
|
| X |
- References
+ Details
| Name: |
isdr_BasisOfPresentationAbstract |
| Namespace Prefix: |
isdr_ |
| Data Type: |
xbrli:stringItemType |
| Balance Type: |
na |
| Period Type: |
duration |
|
| X |
- DefinitionThe entire disclosure for the business description and basis of presentation concepts. Business description describes the nature and type of organization including but not limited to organizational structure as may be applicable to holding companies, parent and subsidiary relationships, business divisions, business units, business segments, affiliates and information about significant ownership of the reporting entity. Basis of presentation describes the underlying basis used to prepare the financial statements (for example, US Generally Accepted Accounting Principles, Other Comprehensive Basis of Accounting, IFRS). Reference 1: http://fasb.org/us-gaap/role/ref/legacyRef
-Topic 235
-Name Accounting Standards Codification
-Publisher FASB
-URI https://asc.fasb.org/235/tableOfContent
Reference 2: http://fasb.org/us-gaap/role/ref/legacyRef
-Topic 275
-Name Accounting Standards Codification
-Publisher FASB
-URI https://asc.fasb.org/275/tableOfContent
Reference 3: http://fasb.org/us-gaap/role/ref/legacyRef
-Topic 205
-Name Accounting Standards Codification
-Publisher FASB
-URI https://asc.fasb.org/205/tableOfContent
| Name: |
us-gaap_BusinessDescriptionAndBasisOfPresentationTextBlock |
| Namespace Prefix: |
us-gaap_ |
| Data Type: |
dtr-types:textBlockItemType |
| Balance Type: |
na |
| Period Type: |
duration |
|
v3.24.2.u1
Summary of Significant Accounting Policies
|
6 Months Ended |
Jun. 30, 2024 |
|---|
| Summary of Significant Accounting Policies |
|
| Summary Of Significant Accounting Policies |
Note 2. Summary of Significant Accounting Policies The consolidated financial statements include the accounts of the Company and its wholly owned subsidiaries. Significant intercompany accounts and transactions are eliminated in consolidation. Earnings Per Share (EPS) Earnings per share accounting guidance requires that basic net income per common share be computed by dividing net income for the period by the weighted average number of common shares outstanding during the period. Diluted net income per share is computed by dividing the net income for the period by the weighted average number of common and dilutive common equivalent shares outstanding during the period. Shares issuable upon the exercise of stock options totaling 70,750 and 68,750 were excluded in the computation of diluted earnings per common share during the three and six-month periods ended June 30, 2024, respectively, because their impact was anti-dilutive. There were 72,250 shares issuable upon the exercise of stock options excluded in the computation of diluted earnings per common share during the three and six-month periods ended June 30, 2023, because their impact was anti-dilutive. Revenue Recognition Substantially all the Company’s revenue comes from contracts with customers for subscriptions to its cloud-based products or contracts for Communications and Compliance products and services. Customers consist of public corporate issuers and professional firms, such as investor and public relations firms. In the case of news distribution and webcasting offerings, customers also include private companies. The Company accounts for a contract with a customer when there is an enforceable contract between the Company and the customer, the rights of the parties are identified, the contract has economic substance, and collectability of the contract consideration is probable. The Company's revenues are measured based on consideration specified in the contract with each customer. The Company's contracts include either a subscription to its entire platform, certain modules within the platform or to its Press Release Optimizer Plan (“PRO”), or an agreement to perform services, or any combination thereof, and often contain multiple subscriptions and services. For these bundled contracts, the Company accounts for individual subscriptions and services as separate performance obligations if they are distinct, which is when a product or service is separately identifiable from other items in the bundled package, and a customer can benefit from it on its own or with other resources that are readily available to the customer. The Company separates revenue from its contracts into two revenue streams: i) Communications and ii) Compliance. Performance obligations of Communications contracts include providing subscriptions to certain modules or our entire Communications platform, distributing press releases on a per release basis or conducting webcasts, virtual annual meetings, or other events on a per event basis. PRO subscription contracts contain two performance obligations: (i) the first is a series of distinct services that include, but are not limited to, developing specific media plans, and creating content to be distributed and (ii) the second performance obligation being access to the PRO platform along with distribution of press releases, ongoing support, and assessment of performance as a stand-ready obligation. Performance obligations of Compliance contracts include providing subscriptions to certain Compliance modules or other stand-ready obligations to deliver services and annual report printing and distribution. Additionally, services are provided on a per project basis. Set up fees for disclosure services are considered a separate performance obligation and are satisfied upfront. Set up fees for the transfer agent module and investor relations content management module are immaterial. The Company’s subscription and service contracts are generally for one year, with automatic renewal clauses included in the contract until the contract is cancelled. The contracts do not contain any rights of returns, guarantees, or warranties. Since contracts are generally for one year, all the revenue is expected to be recognized within one year from the contract start date. As such, the Company has elected the optional exemption that allows the Company not to disclose the transaction price allocated to performance obligations that are unsatisfied or partially satisfied at the end of each reporting period. The Company recognizes revenue for subscriptions evenly over the contract period, upon distribution for per release contracts and upon event completion for webcasting and virtual annual meeting events. For service contracts that include stand ready obligations, revenue is recognized evenly over the contract period. For all other services delivered on a per project or event basis, the revenue is recognized at the completion of the event. The Company believes recognizing revenue for subscriptions and stand ready obligations using a time-based measure of progress, best reflects the Company’s performance in satisfying the obligations. For bundled contracts, revenue is allocated to each performance obligation based on its relative standalone selling price. Standalone selling prices are based on observable prices at which the Company separately sells the subscription or service. If a standalone selling price is not directly observable, the Company uses the residual method to allocate any remaining price to that subscription or service. The Company reviews standalone selling prices, at least annually, and updates these estimates if necessary. The Company invoices its customers based on the billing schedules designated in its contracts, typically upfront on either a monthly, quarterly or annual basis or per transaction at the completion of the performance obligation. Deferred revenue for the periods presented was primarily related to press release packages which have been prepaid, however the releases have not yet been disseminated, as well as, subscription and service contracts, which are billed upfront, quarterly, or annually, however the revenue has not yet been recognized. The associated deferred revenue is generally recognized as press releases are disseminated for press release packages and ratably over the billing period for subscriptions. Deferred revenue as of June 30, 2024 and December 31, 2023, was $5,476,000 and $5,412,000, respectively, and is expected to be recognized within one year. Revenue recognized for the six months ended June 30, 2024 and 2023, which was included in the deferred revenue balance at the beginning of each reporting period, was approximately $4,934,000 and $4,337,000, respectively. Accounts receivable, net of allowance for credit losses, related to contracts with customers was $4,686,000 and $4,368,000 as of June 30, 2024 and December 31, 2023, respectively. Since substantially all the contracts have terms of one year or less, the Company has elected to use the practical expedient regarding the existence of a significant financing. Costs to obtain contracts with customers consist primarily of sales commissions. As of June 30, 2024 and December 31, 2023, the Company has capitalized $118,000 and $130,000, respectively, of costs to obtain contracts that are expected to be amortized over more than one year. For contract costs expected to be amortized in less than one year, the Company has elected to use the practical expedient allowing the recognition of incremental costs of obtaining a contract as an expense when incurred. The Company has considered historical renewal rates, expectations of future renewals and economic factors in making these determinations. Cash Equivalents For purposes of the Company’s financial statements, the Company considers all highly liquid investments purchased with an original maturity date of three months or less to be cash equivalents. Accounts Receivable and Allowance for Credit Losses The Company adopted Financial Accounting Standards Codification (“ASC”) Topic 326, Financial Statements – Credit Losses (“Topic 326”) with an adoption date of January 1, 2023. As a result, the Company changed its accounting policy for allowance for doubtful accounts using an expected losses model rather than using incurred losses. The new model is based on the credit losses expected to arise over the life of the asset based on the Company’s expectations as of the balances sheet date through analyzing historical customer data as well as taking into consideration current economic trends. The Company adopted Topic 326 and determined it did not have a material financial impact. The roll forward of the allowance for doubtful accounts for the three and six-months ended June 30, 2024 and 2023, are as follows (in 000’s): | | For the Three Months Ended | | | For the Six Months Ended | | | | June 30, | | | June 30, | | | June 30, | | | June 30, | | | | 2024 | | | 2023 | | | 2024 | | | 2023 | | | | | | | | | | | | | | | Beginning balance | | $ | 1,144 | | | $ | 858 | | | $ | 1,119 | | | $ | 745 | | Provision for credit losses | | | 313 | | | | 109 | | | | 595 | | | | 260 | | Write-offs | | | (301 | ) | | | (11 | ) | | | (558 | ) | | | (49 | ) | Ending Balance | | | 1,156 | | | | 956 | | | | 1,156 | | | | 956 | |
Concentration of Credit Risk Financial instruments and related items which potentially subject the Company to concentrations of credit risk consist primarily of cash, cash equivalents and accounts receivables. The Company places its cash and temporary cash investments with credit quality institutions. As of June 30, 2024, the Company’s domestic cash balance is spread among different depository institutions such that there is no balance which exceeds the FDIC insurance limit of $250,000. The Company also had cash-on-hand of $64,000 in Europe and $1,293,000 in Canada as of June 30, 2024. The Company believes it did not have any financial instruments that could have potentially subjected us to significant concentrations of credit risk for any relevant period. Use of Estimates The preparation of financial statements in conformity with US GAAP requires management to make estimates and assumptions that affect the reported amounts of assets and liabilities and disclosure of contingent assets and liabilities at the date of the financial statements and the reported amounts of revenues and expenses during the reporting period. Significant estimates include the allowance for credit losses and the valuation of goodwill, intangible assets, deferred tax assets, and stock-based compensation. Actual results could differ from those estimates. Income Taxes Deferred income tax assets and liabilities are computed for differences between the financial statement and tax bases of assets and liabilities that will result in future taxable or deductible amounts based on enacted tax laws and rates applicable to the periods in which the differences are expected to affect taxable income. Valuation allowances are established, when necessary, to reduce deferred income tax assets to the amounts expected to be realized. For any uncertain tax positions, the Company recognizes the impact of a tax position, only if it is more likely than not of being sustained upon examination, based on the technical merits of the position. The Company’s policy regarding the classification of interest and penalties is to classify them as income tax expense in the financial statements, if applicable. Capitalized Software Costs incurred to develop the Company’s cloud-based platform products are capitalized when the preliminary project phase is complete, management commits to fund the project and it is probable the project will be completed and used for its intended purposes. Once the software is substantially complete and ready for its intended use, the software is amortized over its estimated useful life, which is typically four years. Costs related to design or maintenance of the software are expensed as incurred. Capitalized costs and amortization for the three and six-month periods ended June 30, 2024 and 2023, are as follows (in thousands): | | For the Three Months Ended | | | For the Six Months Ended | | | | June 30, | | | June 30, | | | June 30, | | | June 30, | | | | 2024 | | | 2023 | | | 2024 | | | 2023 | | | | | | | | | | | | | | | Capitalized software development costs | | $ | 155 | | | $ | 167 | | | $ | 400 | | | $ | 167 | | Amortization included in cost of revenues | | | 54 | | | | 13 | | | | 100 | | | | 28 | |
Impairment of Long-lived Assets In accordance with the authoritative guidance for accounting for long-lived assets, assets such as property and equipment, trademarks, and intangible assets subject to amortization, are reviewed for impairment whenever events or changes in circumstances indicate that the carrying amount of an asset group may not be recoverable. Recoverability of asset groups to be held and used is measured by a comparison of the carrying amount of an asset group to estimated undiscounted future cash flows expected to be generated by the asset group. If the carrying amount of an asset group exceeds its estimated future cash flows, an impairment charge is recognized by the amount by which the carrying amount of an asset group exceeds fair value of the asset group. Lease Accounting The Company determines if an arrangement is a lease at inception. Operating lease agreements are primarily for office space and are included within lease right-of-use (“ROU”) assets and lease liabilities on the consolidated balance sheet. ROU assets represent the right to use an underlying asset for the lease term and lease liabilities represent the obligation to make lease payments arising from the lease. ROU assets and lease liabilities are recognized at the commencement date based on the present value of lease payments over the lease term. Variable lease payments consist of non-lease services related to the lease and payments under operating leases classified as short-term. Variable lease payments are excluded from the ROU assets and lease liabilities and are recognized in the period in which the obligation for those payments is incurred. As most of the leases do not provide an implicit rate, the Company uses its incremental borrowing rate based on the information available at commencement date in determining the present value of lease payments. ROU assets include any lease payments due and exclude lease incentives. Rental expense for lease payments related to operating leases is recognized on a straight-line basis over the lease term. Fair Value Measurements Accounting Standards Codification (“ASC”) Topic 820 establishes a fair value hierarchy that requires an entity to maximize the use of observable inputs and minimize the use of unobservable inputs when measuring fair value. Assets and liabilities recorded at fair value in the financial statements are categorized based upon the hierarchy of levels of judgment associated with the inputs used to measure their fair value. Hierarchical levels directly related to the amount of subjectivity associated with the inputs to fair valuation of these assets and liabilities, are as follows: | · | Level 1 - Quoted prices are available in active markets for identical assets or liabilities at the reporting date. Generally, this includes debt and equity securities that are traded in an active market. Cash and cash equivalents are quoted at Level 1. |
| · | Level 2 - Observable inputs other than Level 1 prices such as quoted prices for similar assets or liabilities; quoted prices in markets that are not active; or other inputs that are observable or can be corroborated by observable market data for substantially the full term of the assets or liabilities. The fair value of the Company’s long-term debt and interest rate swap are quoted at Level 2. | | | | | · | Level 3 - Unobservable inputs that are supported by little or no market activity and that are significant to the fair value of the assets or liabilities. Level 3 assets and liabilities include financial instruments whose value is determined using pricing models, discounted cash flow methodologies, or other valuation techniques, as well as instruments for which the determination of fair value requires significant management judgment or estimation. |
As of June 30, 2024 and December 31, 2023, the Company believes the fair value of its financial instruments, such as, accounts receivable, long-term debt, the line of credit, and accounts payable approximate their carrying amounts. Translation of Foreign Financial Statements The financial statements of the foreign subsidiaries of the Company have been translated into U.S. dollars. All assets and liabilities have been translated at current rates of exchange in effect at the end of the period. Income and expense items have been translated at the average exchange rates for the year or the applicable interim period. The gains or losses that result from this process are recorded as a separate component of other accumulated comprehensive income until the entity is sold or substantially liquidated. Business Combinations, Goodwill, and Intangible Assets The authoritative guidance for business combinations specifies the criteria for recognizing and reporting intangible assets apart from goodwill. The Company records the assets acquired and liabilities assumed in business combinations at their respective fair values at the date of acquisition, with any excess purchase price recorded as goodwill. Goodwill is an asset representing the future economic benefits arising from other assets acquired in a business combination that are not individually identified and separately recognized. Intangible assets consist of client relationships, customer lists, distribution partner relationships, software, technology, non-compete agreements and trademarks that are initially measured at fair value. At the time of the business combination, trademarks may be considered an indefinite-lived asset and, as such, are not amortized as there may be no foreseeable limit to cash flows generated from them. For the Newswire acquisition the Company determined the trademarks acquired were considered a definite lived asset which will be amortized over a period of 15 years. The client relationships (5-10 years), customer lists (3 years), distribution partner relationships (10 years), non-compete agreements (5 years) and software and technology (3-7 years) are amortized over their estimated useful lives. The goodwill and intangible assets are assessed annually for impairment, or whenever conditions indicate the asset may be impaired, and any such impairment will be recognized in the period identified. As of June 30, 2024, the Company’s market capitalization is less than the carrying value of its equity, plus net debt. This may be an indicator of impairment of the Company’s long-lived assets, however, at this time, management believes the Company’s stock price is in temporary decline and also considers other factors such as future growth, positive cash flow and other measures the Company is able to control in determining if a quantitative test is necessary. Should the stock price continue to remain at levels below the Company’s carrying value, a quantitative test may be necessary, which could conclude an impairment exists. Comprehensive Income Comprehensive income consists of net income and other comprehensive income related to changes in the cumulative foreign currency translation adjustment. Advertising The Company expenses advertising as incurred. During the three and six-month periods ended June 30, 2024, advertising expense was $339,000 and $778,000, respectively. During the three and six-month periods ended June 30, 2023, advertising expense was $364,000 and $826,000, respectively. Stock-based Compensation The authoritative guidance for stock compensation requires that companies estimate the fair value of share-based payment awards on the date of the grant using an option-pricing model. The associated cost is recognized over the period during which an employee or director is required to provide service in exchange for the award.
|
| X |
- References
+ Details
| Name: |
us-gaap_AccountingPoliciesAbstract |
| Namespace Prefix: |
us-gaap_ |
| Data Type: |
xbrli:stringItemType |
| Balance Type: |
na |
| Period Type: |
duration |
|
| X |
- DefinitionThe entire disclosure for all significant accounting policies of the reporting entity. Reference 1: http://www.xbrl.org/2003/role/disclosureRef
-Topic 235
-SubTopic 10
-Name Accounting Standards Codification
-Section 50
-Paragraph 1
-Publisher FASB
-URI https://asc.fasb.org/1943274/2147483426/235-10-50-1
Reference 2: http://fasb.org/us-gaap/role/ref/legacyRef
-Topic 235
-Name Accounting Standards Codification
-Publisher FASB
-URI https://asc.fasb.org/235/tableOfContent
| Name: |
us-gaap_SignificantAccountingPoliciesTextBlock |
| Namespace Prefix: |
us-gaap_ |
| Data Type: |
dtr-types:textBlockItemType |
| Balance Type: |
na |
| Period Type: |
duration |
|
v3.24.2.u1
Equity
|
6 Months Ended |
Jun. 30, 2024 |
|---|
| Equity |
|
| Equity |
Note 3: Equity Dividends The Company did not pay any dividends during the three and six-month periods ended June 30, 2024 and 2023. Preferred stock and common stock There were no issuances of preferred stock or common stock during the three and six-month periods ended June 30, 2024 and 2023, other than stock awarded to employees and the Board of Directors. 2014 Equity Incentive Plan On May 23, 2014, the shareholders of the Company approved the 2014 Equity Incentive Plan, as amended (the “2014 Plan”). Under the terms of the 2014 Plan, the Company is authorized to issue incentive awards for common stock up to 200,000 shares to employees and other personnel. On June 10, 2016 and June 17, 2020, the shareholders of the Company approved an additional 200,000 and 200,000 awards, respectively, to be issued under the 2014 Plan, bringing the total number of shares to be awarded to 600,000. The awards may be in the form of incentive stock options, nonqualified stock options, restricted stock, restricted stock units and performance awards. The 2014 Plan was effective through March 31, 2024. As of June 30, 2024, there are 105,076 shares which remain to be granted under the 2014 Plan. These shares were assumed by the 2023 Plan described below. On June 7, 2023, the shareholders of the Company approved the 2023 Equity Incentive Plan (the “2023 Plan”). Under the terms of the 2023 Plan, the Company is authorized to issue incentive awards for common stock up to 300,000 shares to employees and other personnel. The awards may be in the form of incentive stock options, nonqualified stock options, restricted stock, restricted stock units and performance awards. The 2023 Plan is effective through April 1, 2033. As of June 30, 2024, there are 358,244 shares which remain to be granted under the 2023 Plan, including 105,076 shares assumed under the 2014 Plan described above. The following table summarizes information about stock options outstanding and exercisable at June 30, 2024: | | Options Outstanding | | | Options Exercisable | | Exercise Price Range | | Number | | | Weighted Average Remaining Contractual Life (in Years) | | | Weighted Average Exercise Price | | | Number | | $ 0.01 - 8.00 | | | 5,000 | | | | 1.39 | | | $ | 6.80 | | | | 5,000 | | $ 8.01 - 11.00 | | | 3,000 | | | | 3.50 | | | $ | 10.25 | | | | 3,000 | | $ 11.01 - 16.00 | | | 18,000 | | | | 4.03 | | | $ | 13.12 | | | | 18,000 | | $ 16.01 - 27.00 | | | 38,000 | | | | 7.55 | | | $ | 24.96 | | | | 15,500 | | $ 27.01 - 27.71 | | | 12,750 | | | | 7.55 | | | $ | 27.71 | | | | — | | Total | | | 76,750 | | | | 6.16 | | | $ | 20.88 | | | | 41,500 | |
As of June 30, 2024, the Company had unrecognized stock compensation related to the options of $291,000, which will be recognized through 2027. During the three and six-months ended June 30, 2024, the Company granted 6,000 and 32,500, respectively, of restricted stock units to employees and contractors, which vest at various intervals over the next 3 years. The average grant date fair value of these grants was $9.70 and $13.91 per share during the three and six-month periods ended June 30, 2024, respectively. During the three and six-months ended June 30, 2023, the Company granted 14,332 and 74,732 restricted stock units, with a grant date fair value of $18.70 and $26.08 per share, respectively. During the three and six-month periods ended June 30, 2024, 14,332 and 16,499 restricted stock units with an average intrinsic value of $18.70 and 19.95 per share, respectively, vested. As of June 30, 2024, there was $1,143,000 of unrecognized compensation cost related to our unvested restricted stock units, which will be recognized through 2027.
|
| X |
- References
+ Details
| Name: |
us-gaap_EquityAbstract |
| Namespace Prefix: |
us-gaap_ |
| Data Type: |
xbrli:stringItemType |
| Balance Type: |
na |
| Period Type: |
duration |
|
| X |
- DefinitionThe entire disclosure for equity. Reference 1: http://www.xbrl.org/2003/role/disclosureRef
-Topic 505
-SubTopic 10
-Name Accounting Standards Codification
-Section 50
-Paragraph 13
-Subparagraph (b)
-Publisher FASB
-URI https://asc.fasb.org/1943274/2147481112/505-10-50-13
Reference 2: http://www.xbrl.org/2003/role/disclosureRef
-Topic 505
-SubTopic 10
-Name Accounting Standards Codification
-Section 50
-Paragraph 13
-Subparagraph (h)
-Publisher FASB
-URI https://asc.fasb.org/1943274/2147481112/505-10-50-13
Reference 3: http://www.xbrl.org/2003/role/disclosureRef
-Topic 505
-SubTopic 10
-Name Accounting Standards Codification
-Section 50
-Paragraph 14
-Subparagraph (b)
-Publisher FASB
-URI https://asc.fasb.org/1943274/2147481112/505-10-50-14
Reference 4: http://www.xbrl.org/2003/role/disclosureRef
-Topic 946
-SubTopic 235
-Name Accounting Standards Codification
-Section 50
-Paragraph 2
-Subparagraph (a)
-Publisher FASB
-URI https://asc.fasb.org/1943274/2147477968/946-235-50-2
Reference 5: http://www.xbrl.org/2003/role/disclosureRef
-Topic 946
-SubTopic 235
-Name Accounting Standards Codification
-Section 50
-Paragraph 2
-Subparagraph (d)
-Publisher FASB
-URI https://asc.fasb.org/1943274/2147477968/946-235-50-2
Reference 6: http://www.xbrl.org/2003/role/disclosureRef
-Topic 946
-SubTopic 505
-Name Accounting Standards Codification
-Section 50
-Paragraph 6
-Publisher FASB
-URI https://asc.fasb.org/1943274/2147478448/946-505-50-6
Reference 7: http://www.xbrl.org/2003/role/disclosureRef
-Topic 815
-SubTopic 40
-Name Accounting Standards Codification
-Section 50
-Paragraph 6
-Subparagraph (a)
-Publisher FASB
-URI https://asc.fasb.org/1943274/2147480237/815-40-50-6
Reference 8: http://www.xbrl.org/2003/role/disclosureRef
-Topic 505
-SubTopic 10
-Name Accounting Standards Codification
-Section S99
-Paragraph 1
-Subparagraph (SX 210.3-04)
-Publisher FASB
-URI https://asc.fasb.org/1943274/2147480008/505-10-S99-1
Reference 9: http://www.xbrl.org/2003/role/disclosureRef
-Topic 235
-SubTopic 10
-Name Accounting Standards Codification
-Section S99
-Paragraph 1
-Subparagraph (SX 210.4-08(e)(1))
-Publisher FASB
-URI https://asc.fasb.org/1943274/2147480678/235-10-S99-1
Reference 10: http://fasb.org/us-gaap/role/ref/legacyRef
-Topic 505
-Name Accounting Standards Codification
-Publisher FASB
-URI https://asc.fasb.org/505/tableOfContent
Reference 11: http://www.xbrl.org/2003/role/disclosureRef
-Topic 505
-SubTopic 10
-Name Accounting Standards Codification
-Section 50
-Paragraph 13
-Publisher FASB
-URI https://asc.fasb.org/1943274/2147481112/505-10-50-13
Reference 12: http://www.xbrl.org/2003/role/disclosureRef
-Topic 505
-SubTopic 10
-Name Accounting Standards Codification
-Section 50
-Paragraph 13
-Subparagraph (g)
-Publisher FASB
-URI https://asc.fasb.org/1943274/2147481112/505-10-50-13
Reference 13: http://www.xbrl.org/2003/role/disclosureRef
-Topic 505
-SubTopic 10
-Name Accounting Standards Codification
-Section 50
-Paragraph 13
-Subparagraph (i)
-Publisher FASB
-URI https://asc.fasb.org/1943274/2147481112/505-10-50-13
Reference 14: http://www.xbrl.org/2003/role/disclosureRef
-Topic 505
-SubTopic 10
-Name Accounting Standards Codification
-Section 50
-Paragraph 14
-Subparagraph (a)
-Publisher FASB
-URI https://asc.fasb.org/1943274/2147481112/505-10-50-14
Reference 15: http://www.xbrl.org/2003/role/disclosureRef
-Topic 505
-SubTopic 10
-Name Accounting Standards Codification
-Section 50
-Paragraph 14
-Subparagraph (c)
-Publisher FASB
-URI https://asc.fasb.org/1943274/2147481112/505-10-50-14
Reference 16: http://www.xbrl.org/2003/role/disclosureRef
-Topic 505
-SubTopic 10
-Name Accounting Standards Codification
-Section 50
-Paragraph 16
-Subparagraph (b)
-Publisher FASB
-URI https://asc.fasb.org/1943274/2147481112/505-10-50-16
Reference 17: http://www.xbrl.org/2003/role/disclosureRef
-Topic 505
-SubTopic 10
-Name Accounting Standards Codification
-Section 50
-Paragraph 18
-Subparagraph (a)
-Publisher FASB
-URI https://asc.fasb.org/1943274/2147481112/505-10-50-18
Reference 18: http://www.xbrl.org/2003/role/disclosureRef
-Topic 505
-SubTopic 10
-Name Accounting Standards Codification
-Section 50
-Paragraph 18
-Subparagraph (b)
-Publisher FASB
-URI https://asc.fasb.org/1943274/2147481112/505-10-50-18
Reference 19: http://www.xbrl.org/2003/role/disclosureRef
-Topic 505
-SubTopic 10
-Name Accounting Standards Codification
-Section 50
-Paragraph 18
-Subparagraph (d)
-Publisher FASB
-URI https://asc.fasb.org/1943274/2147481112/505-10-50-18
| Name: |
us-gaap_StockholdersEquityNoteDisclosureTextBlock |
| Namespace Prefix: |
us-gaap_ |
| Data Type: |
dtr-types:textBlockItemType |
| Balance Type: |
na |
| Period Type: |
duration |
|
v3.24.2.u1
Income Taxes
|
6 Months Ended |
Jun. 30, 2024 |
|---|
| Income Taxes |
|
| Income Taxes |
Note 4: Income Taxes The Company recognized an income tax expense of $47,000 and $63,000 for the three and six-month period ended June 30, 2024, compared to income tax expense of $482,000 and $434,000 during the same periods of 2023. At the end of each interim period, the Company estimates the effective tax rate expected to be applicable for the full fiscal year and this rate is applied to the results for the year-to-date period, and then adjusted for any discrete period items. For the three and six-month periods ended June 30, 2024 and 2023, the variance between our effective tax rate and the U.S. statutory rate of 21% is primarily attributable to state income tax and expenses not deductible for tax purposes. For the three and six-month periods ended June 30, 2024, the effective tax rate was also impacted by additional expense associated with vesting of stock-based compensation.
|
| X |
- DefinitionThe entire disclosure for income tax. Reference 1: http://www.xbrl.org/2003/role/disclosureRef
-Topic 740
-SubTopic 10
-Name Accounting Standards Codification
-Section 50
-Paragraph 12
-Publisher FASB
-URI https://asc.fasb.org/1943274/2147482685/740-10-50-12
Reference 2: http://www.xbrl.org/2003/role/exampleRef
-Topic 740
-SubTopic 10
-Name Accounting Standards Codification
-Section 55
-Paragraph 231
-Publisher FASB
-URI https://asc.fasb.org/1943274/2147482663/740-10-55-231
Reference 3: http://www.xbrl.org/2003/role/disclosureRef
-Topic 740
-SubTopic 10
-Name Accounting Standards Codification
-Section 50
-Paragraph 12C
-Publisher FASB
-URI https://asc.fasb.org/1943274/2147482685/740-10-50-12C
Reference 4: http://www.xbrl.org/2003/role/disclosureRef
-Topic 740
-SubTopic 10
-Name Accounting Standards Codification
-Section 50
-Paragraph 12B
-Publisher FASB
-URI https://asc.fasb.org/1943274/2147482685/740-10-50-12B
Reference 5: http://www.xbrl.org/2003/role/disclosureRef
-Topic 740
-SubTopic 270
-Name Accounting Standards Codification
-Section 50
-Paragraph 1
-Publisher FASB
-URI https://asc.fasb.org/1943274/2147477891/740-270-50-1
Reference 6: http://www.xbrl.org/2003/role/disclosureRef
-Topic 740
-SubTopic 10
-Name Accounting Standards Codification
-Section S99
-Paragraph 1
-Subparagraph (SAB Topic 6.I.5.Q1)
-Publisher FASB
-URI https://asc.fasb.org/1943274/2147479360/740-10-S99-1
Reference 7: http://www.xbrl.org/2003/role/disclosureRef
-Topic 946
-SubTopic 20
-Name Accounting Standards Codification
-Section 50
-Paragraph 13
-Publisher FASB
-URI https://asc.fasb.org/1943274/2147480990/946-20-50-13
Reference 8: http://www.xbrl.org/2003/role/disclosureRef
-Topic 235
-SubTopic 10
-Name Accounting Standards Codification
-Section S99
-Paragraph 1
-Subparagraph (SX 210.4-08(h)(2))
-Publisher FASB
-URI https://asc.fasb.org/1943274/2147480678/235-10-S99-1
Reference 9: http://www.xbrl.org/2003/role/disclosureRef
-Topic 740
-Name Accounting Standards Codification
-Publisher FASB
-URI https://asc.fasb.org/740/tableOfContent
Reference 10: http://www.xbrl.org/2003/role/disclosureRef
-Topic 740
-SubTopic 10
-Name Accounting Standards Codification
-Section 50
-Paragraph 14
-Publisher FASB
-URI https://asc.fasb.org/1943274/2147482685/740-10-50-14
Reference 11: http://www.xbrl.org/2003/role/disclosureRef
-Topic 740
-SubTopic 10
-Name Accounting Standards Codification
-Section 50
-Paragraph 21
-Publisher FASB
-URI https://asc.fasb.org/1943274/2147482685/740-10-50-21
Reference 12: http://www.xbrl.org/2003/role/disclosureRef
-Topic 740
-SubTopic 10
-Name Accounting Standards Codification
-Section 50
-Paragraph 17
-Subparagraph (b)
-Publisher FASB
-URI https://asc.fasb.org/1943274/2147482685/740-10-50-17
Reference 13: http://www.xbrl.org/2003/role/disclosureRef
-Topic 740
-SubTopic 10
-Name Accounting Standards Codification
-Section S99
-Paragraph 2
-Subparagraph (SAB Topic 11.C)
-Publisher FASB
-URI https://asc.fasb.org/1943274/2147479360/740-10-S99-2
Reference 14: http://www.xbrl.org/2003/role/disclosureRef
-Topic 740
-SubTopic 30
-Name Accounting Standards Codification
-Section 50
-Paragraph 2
-Subparagraph (a)
-Publisher FASB
-URI https://asc.fasb.org/1943274/2147482603/740-30-50-2
| Name: |
us-gaap_IncomeTaxDisclosureTextBlock |
| Namespace Prefix: |
us-gaap_ |
| Data Type: |
dtr-types:textBlockItemType |
| Balance Type: |
na |
| Period Type: |
duration |
|
v3.24.2.u1
Leases
|
6 Months Ended |
Jun. 30, 2024 |
|---|
| Leases |
|
| Leases |
Note 5: Leases Leasing activity generally consists of office leases. In March 2019, we signed a new lease to move the corporate headquarters to Raleigh, North Carolina. The new lease, which had a lease commencement date of October 2, 2019, expires December 31, 2027. Minimum lease payments are $2,997,000, not including a tenant improvement allowance of $488,000, which is included in fixed assets as of June 30, 2024. The Company recognized a ROU asset and corresponding lease liability of $2,596,000, which represents the present value of minimum lease payments discounted at 3.77%, the Company’s incremental borrowing rate at lease inception. Lease liabilities totaled $1,224,000 as of June 30, 2024. The current portion of this liability of $384,000 is included in Accrued expenses on the Consolidated balance sheets and the long-term portion of $840,000 is included in Lease liabilities on the Consolidated Balance Sheets. Rent expense consists of both operating lease expense from amortization of our ROU assets as well as variable lease expense which consists of non-lease components of office leases (i.e. common area maintenance) or rent expense associated with short-term leases. The components of lease expense were as follows (in 000’s): | | For the Three Months Ended | | | For the Six Months Ended | | | | June 30, | | | June 30, | | | June 30, | | | June 30, | | | | 2024 | | | 2023 | | | 2024 | | | 2023 | | Lease expense | | | | | | | | | | | | | Operating lease expense | | $ | 76 | | | $ | 76 | | | $ | 152 | | | $ | 152 | | Variable lease expense | | | 18 | | | | 15 | | | | 32 | | | | 21 | | Total lease expense | | $ | 94 | | | $ | 91 | | | $ | 184 | | | $ | 173 | |
The weighted-average remaining non-cancelable lease term for our operating leases was 3.50 years as of June 30, 2024. As of June 30, 2024, the weighted-average discount rate used to determine the lease liability was 3.77%. The future minimum lease payments to be made under non-cancelable operating leases on June 30, 2024, are as follows (in 000’s): Year Ended December 31: | | | | 2024 | | $ | 191 | | 2025 | | | 390 | | 2026 | | | 401 | | 2027 | | | 412 | | Total lease payments | | | 1,394 | | Present value adjustment | | | (170 | ) | Lease liability | | $ | 1,224 | |
We have performed an evaluation of our other contracts with customers and suppliers in accordance with Topic 842 and have determined that, except for the leases described above, none of our contracts contain a lease.
|
| X |
- References
+ Details
| Name: |
us-gaap_LeasesAbstract |
| Namespace Prefix: |
us-gaap_ |
| Data Type: |
xbrli:stringItemType |
| Balance Type: |
na |
| Period Type: |
duration |
|
| X |
- DefinitionThe entire disclosure for lessee entity's leasing arrangements including, but not limited to, all of the following: (a.) The basis on which contingent rental payments are determined, (b.) The existence and terms of renewal or purchase options and escalation clauses, (c.) Restrictions imposed by lease agreements, such as those concerning dividends, additional debt, and further leasing. Reference 1: http://fasb.org/us-gaap/role/ref/otherTransitionRef
-Topic 840
-Name Accounting Standards Codification
-Publisher FASB
-URI https://asc.fasb.org/840/tableOfContent
| Name: |
us-gaap_LeasesOfLesseeDisclosureTextBlock |
| Namespace Prefix: |
us-gaap_ |
| Data Type: |
dtr-types:textBlockItemType |
| Balance Type: |
na |
| Period Type: |
duration |
|
v3.24.2.u1
Revenue
|
6 Months Ended |
Jun. 30, 2024 |
|---|
| Revenue |
|
| Revenue |
Note 6: Revenue The Company considers itself to be a single reportable segment under the authoritative guidance for segment reporting, specifically a communications and compliance company for publicly traded and private companies. The following tables present revenue disaggregated by revenue stream in (000’s): | | Three months ended June 30, | | Revenue Streams | | 2024 | | | 2023 | | Communications | | $ | 5,944 | | | | 77.3 | % | | $ | 5,936 | | | | 61.5 | % | Compliance | | | 1,743 | | | | 22.7 | % | | | 3,715 | | | | 38.5 | % | Total | | $ | 7,687 | | | | 100.0 | % | | $ | 9,651 | | | | 100.0 | % |
| | Six months ended June 30, | | Revenue Streams | | 2024 | | | 2023 | | Communications | | $ | 11,403 | | | | 77.8 | % | | $ | 12,502 | | | | 68.4 | % | Compliance | | | 3,246 | | | | 22.2 | % | | | 5,768 | | | | 31.6 | % | Total | | $ | 14,649 | | | | 100.0 | % | | $ | 18,270 | | | | 100.0 | % |
The Company did not have any customers during the three and six-month periods ended June 30, 2024 or the six-month period ended June 30, 2023 that accounted for more than 10% of our revenue. There was one customer during the three-month period ended June 30, 2023 that accounted for more than 10% of revenue.
|
| X |
- References
+ Details
| Name: |
us-gaap_RevenueFromContractWithCustomerAbstract |
| Namespace Prefix: |
us-gaap_ |
| Data Type: |
xbrli:stringItemType |
| Balance Type: |
na |
| Period Type: |
duration |
|
| X |
- DefinitionThe entire disclosure of revenue from contract with customer to transfer good or service and to transfer nonfinancial asset. Includes, but is not limited to, disaggregation of revenue, credit loss recognized from contract with customer, judgment and change in judgment related to contract with customer, and asset recognized from cost incurred to obtain or fulfill contract with customer. Excludes insurance and lease contracts. Reference 1: http://www.xbrl.org/2003/role/disclosureRef
-Topic 606
-SubTopic 10
-Name Accounting Standards Codification
-Section 50
-Paragraph 9
-Publisher FASB
-URI https://asc.fasb.org/1943274/2147479806/606-10-50-9
Reference 2: http://www.xbrl.org/2003/role/disclosureRef
-Topic 606
-SubTopic 10
-Name Accounting Standards Codification
-Section 50
-Paragraph 10
-Publisher FASB
-URI https://asc.fasb.org/1943274/2147479806/606-10-50-10
Reference 3: http://www.xbrl.org/2003/role/disclosureRef
-Topic 606
-SubTopic 10
-Name Accounting Standards Codification
-Section 50
-Paragraph 15
-Publisher FASB
-URI https://asc.fasb.org/1943274/2147479806/606-10-50-15
Reference 4: http://www.xbrl.org/2003/role/disclosureRef
-Topic 606
-SubTopic 10
-Name Accounting Standards Codification
-Section 50
-Paragraph 12
-Subparagraph (a)
-Publisher FASB
-URI https://asc.fasb.org/1943274/2147479806/606-10-50-12
Reference 5: http://www.xbrl.org/2003/role/disclosureRef
-Topic 606
-SubTopic 10
-Name Accounting Standards Codification
-Section 50
-Paragraph 12
-Subparagraph (b)
-Publisher FASB
-URI https://asc.fasb.org/1943274/2147479806/606-10-50-12
Reference 6: http://www.xbrl.org/2003/role/disclosureRef
-Topic 606
-SubTopic 10
-Name Accounting Standards Codification
-Section 50
-Paragraph 12
-Subparagraph (c)
-Publisher FASB
-URI https://asc.fasb.org/1943274/2147479806/606-10-50-12
Reference 7: http://www.xbrl.org/2003/role/disclosureRef
-Topic 606
-SubTopic 10
-Name Accounting Standards Codification
-Section 50
-Paragraph 12
-Subparagraph (d)
-Publisher FASB
-URI https://asc.fasb.org/1943274/2147479806/606-10-50-12
Reference 8: http://www.xbrl.org/2003/role/disclosureRef
-Topic 606
-SubTopic 10
-Name Accounting Standards Codification
-Section 50
-Paragraph 12
-Subparagraph (e)
-Publisher FASB
-URI https://asc.fasb.org/1943274/2147479806/606-10-50-12
Reference 9: http://www.xbrl.org/2003/role/disclosureRef
-Topic 606
-SubTopic 10
-Name Accounting Standards Codification
-Section 50
-Paragraph 13
-Subparagraph (b)(2)
-Publisher FASB
-URI https://asc.fasb.org/1943274/2147479806/606-10-50-13
Reference 10: http://www.xbrl.org/2003/role/disclosureRef
-Name Accounting Standards Codification
-Topic 606
-Publisher FASB
-URI https://asc.fasb.org/606/tableOfContent
| Name: |
us-gaap_RevenueFromContractWithCustomerTextBlock |
| Namespace Prefix: |
us-gaap_ |
| Data Type: |
dtr-types:textBlockItemType |
| Balance Type: |
na |
| Period Type: |
duration |
|
v3.24.2.u1
Credit Agreement
|
6 Months Ended |
Jun. 30, 2024 |
|---|
| Credit Agreement |
|
| Credit Agreement |
Note 7: Credit Agreement On March 20, 2023 (the “Closing Date”), the Company entered into a $25 million credit agreement (the “Credit Agreement”) with Pinnacle Bank (“Pinnacle”). The Credit Agreement provides for the following: (i) term loan facility in an aggregate principal amount of $20 million (the “Term Loan”), and (ii) revolving line of credit in an up to aggregate principal amount of $5 million (the “Revolving LOC”), subject to an 85% limit based on the current eligible accounts receivable (as defined in the Credit Agreement). Pursuant to the terms of the Credit Agreement, the per annum interest rate of the Term Loan is variable based on the one-month secured overnight financing rate (“SOFR”) plus 2.35%, subject to a minimum SOFR of 2.00%. However, the Term Loan issued on the Closing Date has a per annum interest rate of 6.217%, which was fixed with respect to the entire principal amount as a result of an interest rate swap agreement entered into between the Company and Pinnacle on the Closing Date in accordance with the terms of the Credit Agreement. The Company began making monthly interest only payments on the Term Loan on April 1, 2023. On January 1, 2024, the Company began making monthly principal payments of $333,333 plus interest payments on the Term Loan until the maturity date of December 20, 2028. The proceeds of the Term Loan along with certain cash on hand of the Company were used to repay in its entirety the one-year Secured Promissory Note (the “Seller Note”) issued to Lead Capital, LLC (“the Seller”) in connection with the Company’s November 1, 2022 acquisition of iNewswire.com LLC (“Newswire”) for a lump sum payment of $22,880,000. In order to settle the Seller Note on March 20, 2023, the Company paid $370,000 to Seller, with the Seller agreeing to forgive $440,000 of interest which would have otherwise been due. The $370,000 payment is recorded in Other income (expense), net on the Consolidated statements of operations for the six months ended June 30, 2023. Effective June 25, 2024, the aggregate principal amount of the Revolving LOC was reduced to $1,500,000. The Company currently has no plans to utilize the Revolving LOC but may do so in the future. If the Company does utilize any funds under the Revolving LOC, the funds will bear interest at a per annum rate equal to the then current SOFR plus 2.05%. Effective June 25, 2024, Pinnacle’s commitment to fund under the Revolving LOC was amended to terminate on June 30, 2025, unless terminated earlier pursuant to the terms of the Credit Agreement. The Company terminated its existing $3,000,000 unsecured line of credit with Fifth Third Bank immediately prior to the Closing Date. As of June 30, 2024, there was no outstanding balance under the Revolving LOC and the interest rate was 7.39%. The Credit Agreement originally contained financial covenants, which commenced with fiscal quarter ending June 30, 2023, and were subsequently amended on June 25, 2024, as follows: | Original | As Amended | Fiscal Quarter | Fixed Charge Coverage Ratio | Fixed Charge Coverage Ratio | Each fiscal quarter ending on or after June 30, 2023 through June 30, 2024 | 1.2:1.0 | 1.2:1.0 | Fiscal quarter ending on or after September 30, 2024 through March 31, 2025 | 1.2:1.0 | 1.15:1.0 | Each fiscal quarter ending on or after June 30, 2025 | 1.2:1.0 | 1.2:1.0 | | | | | Leverage Ratio | Leverage Ratio | Each fiscal quarter ending on or after June 30, 2023 through September 30, 2023 | 2.75:1.0 | 2.75:1.0 | Fiscal quarter ending December 31, 2023 | 2.5:1.0 | 2.5:1.0 | Fiscal quarter ending March 31, 2024 | 2.5:1.0 | 2.75:1.0 | Each fiscal quarter ending on or after June 30, 2024 through September 30, 2024 | 2.5:1.0 | 3.5:1.0 | Fiscal quarter ending December 31, 2024 | 2.5:1.0 | 3.0:1.0 | Fiscal quarter ending March 31, 2025 | 2.5:1.0 | 2.85:1.0 | Each fiscal quarter ending on or after June 30, 2025 | 2.5:1.0 | 2.75:1.0 |
Additionally, as long as the Company maintains a Leverage Ratio greater than 2.75 : 1.0, the Company is required to maintain unrestricted liquidity, as defined in the amendment, of not less than $1,500,000, beginning June 30, 2024. The Credit Agreement also contains customary affirmative covenants for a transaction of this nature, including among other things, covenants relating to: maintenance of adequate financial and accounting books and records, delivery of financial statements and other information, preservation of existence of the Company and subsidiaries, payment of taxes and claims, compliance with laws, maintenance of insurance, foreign qualification, use of proceeds, cash management system, maintenance of properties, and conduct of business. The Credit Agreement also contains customary negative covenants for a transaction of this nature, including, among other things, covenants relating to debt, liens, investments, negative pledges, dividends and other debt payments, restriction on fundamental changes, sale of assets, transactions with affiliates, restrictive agreements, and changes in fiscal year. The Credit Agreement also contains various Events of Default (subject to certain grace periods, to the extent applicable), including among other things, Events of Default for the nonpayment of principal, interest or fees; breach of certain covenants; inaccuracy of the representations or warranties in any material respect; bankruptcy or insolvency; dissolution or change of control; certain unsatisfied judgments; defaults under material agreements; certain unfunded liabilities under employee benefit plans; certain unsatisfied judgments; certain ERISA violations; and the invalidity or unenforceability of the Credit Agreement. If an Event of Default occurs, the Company may be required to repay all amounts outstanding under the Credit Agreement. The Term Loan and any advances under the Revolving LOC are secured by a first priority lien and security interest to the benefit of Pinnacle in the Event of Default on all of the Company’s current or future assets and each of the Guarantor’s current or future assets.
|
| X |
- References
+ Details
| Name: |
isdr_CreditAgreementAbstract |
| Namespace Prefix: |
isdr_ |
| Data Type: |
xbrli:stringItemType |
| Balance Type: |
na |
| Period Type: |
duration |
|
| X |
- References
+ Details
| Name: |
isdr_CreditAgreementTextBlock |
| Namespace Prefix: |
isdr_ |
| Data Type: |
nonnum:textBlockItemType |
| Balance Type: |
na |
| Period Type: |
duration |
|
v3.24.2.u1
Interest Rate Swap
|
6 Months Ended |
Jun. 30, 2024 |
|---|
| Interest Rate Swap |
|
| Interest Rate Swap |
Note 8: Interest Rate Swap The Company entered into an interest rate swap agreement to convert its interest rate exposure from variable rate to fixed rate to control cash outflows related to interest on its variable rate debt. The Company has $20,000,000 of notional amount interest rate swap agreement, which amortizes in-line with its long-term credit agreement. Under the swap agreement, the Company pays a fixed rate of interest at 6.217% and receives an average variable rate of SOFR + 2.35% adjusted monthly. At June 30, 2024, the weighted average rate was 7.69%. The carrying amount for the Company’s derivative financial instrument is the estimated fair value of the financial instrument. The Company’s derivative is not exchange listed and therefore the fair value is estimated under a mark-to-market approach using an analytics model that is a readily observable market input. This model reflects the contractual terms of the derivative, such as notional value and expiration date, as well as market-based observables including interest rates, yield curves, and the credit quality of the counterparty. The model also incorporates the Company’s creditworthiness in order to appropriately reflect non-performance risk. Inputs to the derivative pricing model are generally observable and do not contain a high level of subjectivity, and accordingly, the Company’s derivative is classified within Level 2 of the fair value hierarchy. While the Company believes its estimate results in a reasonable reflection of the fair value of the instrument, the estimated value may not be representative of actual value that could have been realized or that will be realized in the near future. In accounting for the interest rate swap, the Company has determined it does not qualify for hedge accounting. The fair value of the swap agreement as of June 30, 2024 and December 31, 2023 was a net asset of $198,000 and net liability of $21,000, respectively, and is included in Other long-term assets and Other long-term liabilities, in the Consolidated Balance Sheets. The fair value of the swap agreement excludes accrued interest and takes into consideration current interest rates and current likelihood of the swap counterparty’s compliance with its contractual obligations. During the three and six-month periods ended June 30, 2024, we recognized a gain of $14,000 and $219,000, respectively, in Other income (expense) in the Consolidated statements of operations, as a result of the interest rate swap. During the three and six-month periods ended June 30, 2023, we recognized a gain of $379,000 and $214,000, respectively, in Other income (expense) in the Consolidated statements of operations, as a result of the interest rate swap.
|
| X |
- References
+ Details
| Name: |
isdr_InterestRateSwapAbstract |
| Namespace Prefix: |
isdr_ |
| Data Type: |
xbrli:stringItemType |
| Balance Type: |
na |
| Period Type: |
duration |
|
| X |
- References
+ Details
| Name: |
isdr_InterestRateSwapTextBlock |
| Namespace Prefix: |
isdr_ |
| Data Type: |
nonnum:textBlockItemType |
| Balance Type: |
na |
| Period Type: |
duration |
|
v3.24.2.u1
Summary of Significant Accounting Policies (Policies)
|
6 Months Ended |
Jun. 30, 2024 |
|---|
| Summary of Significant Accounting Policies |
|
| Earnings Per Share (EPS) |
Earnings per share accounting guidance requires that basic net income per common share be computed by dividing net income for the period by the weighted average number of common shares outstanding during the period. Diluted net income per share is computed by dividing the net income for the period by the weighted average number of common and dilutive common equivalent shares outstanding during the period. Shares issuable upon the exercise of stock options totaling 70,750 and 68,750 were excluded in the computation of diluted earnings per common share during the three and six-month periods ended June 30, 2024, respectively, because their impact was anti-dilutive. There were 72,250 shares issuable upon the exercise of stock options excluded in the computation of diluted earnings per common share during the three and six-month periods ended June 30, 2023, because their impact was anti-dilutive.
|
| Revenue Recognition |
Substantially all the Company’s revenue comes from contracts with customers for subscriptions to its cloud-based products or contracts for Communications and Compliance products and services. Customers consist of public corporate issuers and professional firms, such as investor and public relations firms. In the case of news distribution and webcasting offerings, customers also include private companies. The Company accounts for a contract with a customer when there is an enforceable contract between the Company and the customer, the rights of the parties are identified, the contract has economic substance, and collectability of the contract consideration is probable. The Company's revenues are measured based on consideration specified in the contract with each customer. The Company's contracts include either a subscription to its entire platform, certain modules within the platform or to its Press Release Optimizer Plan (“PRO”), or an agreement to perform services, or any combination thereof, and often contain multiple subscriptions and services. For these bundled contracts, the Company accounts for individual subscriptions and services as separate performance obligations if they are distinct, which is when a product or service is separately identifiable from other items in the bundled package, and a customer can benefit from it on its own or with other resources that are readily available to the customer. The Company separates revenue from its contracts into two revenue streams: i) Communications and ii) Compliance. Performance obligations of Communications contracts include providing subscriptions to certain modules or our entire Communications platform, distributing press releases on a per release basis or conducting webcasts, virtual annual meetings, or other events on a per event basis. PRO subscription contracts contain two performance obligations: (i) the first is a series of distinct services that include, but are not limited to, developing specific media plans, and creating content to be distributed and (ii) the second performance obligation being access to the PRO platform along with distribution of press releases, ongoing support, and assessment of performance as a stand-ready obligation. Performance obligations of Compliance contracts include providing subscriptions to certain Compliance modules or other stand-ready obligations to deliver services and annual report printing and distribution. Additionally, services are provided on a per project basis. Set up fees for disclosure services are considered a separate performance obligation and are satisfied upfront. Set up fees for the transfer agent module and investor relations content management module are immaterial. The Company’s subscription and service contracts are generally for one year, with automatic renewal clauses included in the contract until the contract is cancelled. The contracts do not contain any rights of returns, guarantees, or warranties. Since contracts are generally for one year, all the revenue is expected to be recognized within one year from the contract start date. As such, the Company has elected the optional exemption that allows the Company not to disclose the transaction price allocated to performance obligations that are unsatisfied or partially satisfied at the end of each reporting period. The Company recognizes revenue for subscriptions evenly over the contract period, upon distribution for per release contracts and upon event completion for webcasting and virtual annual meeting events. For service contracts that include stand ready obligations, revenue is recognized evenly over the contract period. For all other services delivered on a per project or event basis, the revenue is recognized at the completion of the event. The Company believes recognizing revenue for subscriptions and stand ready obligations using a time-based measure of progress, best reflects the Company’s performance in satisfying the obligations. For bundled contracts, revenue is allocated to each performance obligation based on its relative standalone selling price. Standalone selling prices are based on observable prices at which the Company separately sells the subscription or service. If a standalone selling price is not directly observable, the Company uses the residual method to allocate any remaining price to that subscription or service. The Company reviews standalone selling prices, at least annually, and updates these estimates if necessary. The Company invoices its customers based on the billing schedules designated in its contracts, typically upfront on either a monthly, quarterly or annual basis or per transaction at the completion of the performance obligation. Deferred revenue for the periods presented was primarily related to press release packages which have been prepaid, however the releases have not yet been disseminated, as well as, subscription and service contracts, which are billed upfront, quarterly, or annually, however the revenue has not yet been recognized. The associated deferred revenue is generally recognized as press releases are disseminated for press release packages and ratably over the billing period for subscriptions. Deferred revenue as of June 30, 2024 and December 31, 2023, was $5,476,000 and $5,412,000, respectively, and is expected to be recognized within one year. Revenue recognized for the six months ended June 30, 2024 and 2023, which was included in the deferred revenue balance at the beginning of each reporting period, was approximately $4,934,000 and $4,337,000, respectively. Accounts receivable, net of allowance for credit losses, related to contracts with customers was $4,686,000 and $4,368,000 as of June 30, 2024 and December 31, 2023, respectively. Since substantially all the contracts have terms of one year or less, the Company has elected to use the practical expedient regarding the existence of a significant financing. Costs to obtain contracts with customers consist primarily of sales commissions. As of June 30, 2024 and December 31, 2023, the Company has capitalized $118,000 and $130,000, respectively, of costs to obtain contracts that are expected to be amortized over more than one year. For contract costs expected to be amortized in less than one year, the Company has elected to use the practical expedient allowing the recognition of incremental costs of obtaining a contract as an expense when incurred. The Company has considered historical renewal rates, expectations of future renewals and economic factors in making these determinations.
|
| Cash Equivalents |
For purposes of the Company’s financial statements, the Company considers all highly liquid investments purchased with an original maturity date of three months or less to be cash equivalents.
|
| Accounts Receivable and Allowance for Credit Losses |
The Company adopted Financial Accounting Standards Codification (“ASC”) Topic 326, Financial Statements – Credit Losses (“Topic 326”) with an adoption date of January 1, 2023. As a result, the Company changed its accounting policy for allowance for doubtful accounts using an expected losses model rather than using incurred losses. The new model is based on the credit losses expected to arise over the life of the asset based on the Company’s expectations as of the balances sheet date through analyzing historical customer data as well as taking into consideration current economic trends. The Company adopted Topic 326 and determined it did not have a material financial impact. The roll forward of the allowance for doubtful accounts for the three and six-months ended June 30, 2024 and 2023, are as follows (in 000’s): | | For the Three Months Ended | | | For the Six Months Ended | | | | June 30, | | | June 30, | | | June 30, | | | June 30, | | | | 2024 | | | 2023 | | | 2024 | | | 2023 | | | | | | | | | | | | | | | Beginning balance | | $ | 1,144 | | | $ | 858 | | | $ | 1,119 | | | $ | 745 | | Provision for credit losses | | | 313 | | | | 109 | | | | 595 | | | | 260 | | Write-offs | | | (301 | ) | | | (11 | ) | | | (558 | ) | | | (49 | ) | Ending Balance | | | 1,156 | | | | 956 | | | | 1,156 | | | | 956 | |
|
| Concentration Of Credit Risk |
Financial instruments and related items which potentially subject the Company to concentrations of credit risk consist primarily of cash, cash equivalents and accounts receivables. The Company places its cash and temporary cash investments with credit quality institutions. As of June 30, 2024, the Company’s domestic cash balance is spread among different depository institutions such that there is no balance which exceeds the FDIC insurance limit of $250,000. The Company also had cash-on-hand of $64,000 in Europe and $1,293,000 in Canada as of June 30, 2024. The Company believes it did not have any financial instruments that could have potentially subjected us to significant concentrations of credit risk for any relevant period.
|
| Use Of Estimates |
The preparation of financial statements in conformity with US GAAP requires management to make estimates and assumptions that affect the reported amounts of assets and liabilities and disclosure of contingent assets and liabilities at the date of the financial statements and the reported amounts of revenues and expenses during the reporting period. Significant estimates include the allowance for credit losses and the valuation of goodwill, intangible assets, deferred tax assets, and stock-based compensation. Actual results could differ from those estimates.
|
| Income Taxes |
Deferred income tax assets and liabilities are computed for differences between the financial statement and tax bases of assets and liabilities that will result in future taxable or deductible amounts based on enacted tax laws and rates applicable to the periods in which the differences are expected to affect taxable income. Valuation allowances are established, when necessary, to reduce deferred income tax assets to the amounts expected to be realized. For any uncertain tax positions, the Company recognizes the impact of a tax position, only if it is more likely than not of being sustained upon examination, based on the technical merits of the position. The Company’s policy regarding the classification of interest and penalties is to classify them as income tax expense in the financial statements, if applicable.
|
| Capitalized Software |
Costs incurred to develop the Company’s cloud-based platform products are capitalized when the preliminary project phase is complete, management commits to fund the project and it is probable the project will be completed and used for its intended purposes. Once the software is substantially complete and ready for its intended use, the software is amortized over its estimated useful life, which is typically four years. Costs related to design or maintenance of the software are expensed as incurred. Capitalized costs and amortization for the three and six-month periods ended June 30, 2024 and 2023, are as follows (in thousands): | | For the Three Months Ended | | | For the Six Months Ended | | | | June 30, | | | June 30, | | | June 30, | | | June 30, | | | | 2024 | | | 2023 | | | 2024 | | | 2023 | | | | | | | | | | | | | | | Capitalized software development costs | | $ | 155 | | | $ | 167 | | | $ | 400 | | | $ | 167 | | Amortization included in cost of revenues | | | 54 | | | | 13 | | | | 100 | | | | 28 | |
|
| Impairment Of Long-lived Assets |
In accordance with the authoritative guidance for accounting for long-lived assets, assets such as property and equipment, trademarks, and intangible assets subject to amortization, are reviewed for impairment whenever events or changes in circumstances indicate that the carrying amount of an asset group may not be recoverable. Recoverability of asset groups to be held and used is measured by a comparison of the carrying amount of an asset group to estimated undiscounted future cash flows expected to be generated by the asset group. If the carrying amount of an asset group exceeds its estimated future cash flows, an impairment charge is recognized by the amount by which the carrying amount of an asset group exceeds fair value of the asset group.
|
| Lease Accounting |
The Company determines if an arrangement is a lease at inception. Operating lease agreements are primarily for office space and are included within lease right-of-use (“ROU”) assets and lease liabilities on the consolidated balance sheet. ROU assets represent the right to use an underlying asset for the lease term and lease liabilities represent the obligation to make lease payments arising from the lease. ROU assets and lease liabilities are recognized at the commencement date based on the present value of lease payments over the lease term. Variable lease payments consist of non-lease services related to the lease and payments under operating leases classified as short-term. Variable lease payments are excluded from the ROU assets and lease liabilities and are recognized in the period in which the obligation for those payments is incurred. As most of the leases do not provide an implicit rate, the Company uses its incremental borrowing rate based on the information available at commencement date in determining the present value of lease payments. ROU assets include any lease payments due and exclude lease incentives. Rental expense for lease payments related to operating leases is recognized on a straight-line basis over the lease term.
|
| Fair Value Measurements |
Accounting Standards Codification (“ASC”) Topic 820 establishes a fair value hierarchy that requires an entity to maximize the use of observable inputs and minimize the use of unobservable inputs when measuring fair value. Assets and liabilities recorded at fair value in the financial statements are categorized based upon the hierarchy of levels of judgment associated with the inputs used to measure their fair value. Hierarchical levels directly related to the amount of subjectivity associated with the inputs to fair valuation of these assets and liabilities, are as follows: | · | Level 1 - Quoted prices are available in active markets for identical assets or liabilities at the reporting date. Generally, this includes debt and equity securities that are traded in an active market. Cash and cash equivalents are quoted at Level 1. |
| · | Level 2 - Observable inputs other than Level 1 prices such as quoted prices for similar assets or liabilities; quoted prices in markets that are not active; or other inputs that are observable or can be corroborated by observable market data for substantially the full term of the assets or liabilities. The fair value of the Company’s long-term debt and interest rate swap are quoted at Level 2. | | | | | · | Level 3 - Unobservable inputs that are supported by little or no market activity and that are significant to the fair value of the assets or liabilities. Level 3 assets and liabilities include financial instruments whose value is determined using pricing models, discounted cash flow methodologies, or other valuation techniques, as well as instruments for which the determination of fair value requires significant management judgment or estimation. |
As of June 30, 2024 and December 31, 2023, the Company believes the fair value of its financial instruments, such as, accounts receivable, long-term debt, the line of credit, and accounts payable approximate their carrying amounts.
|
| Translation Of Foreign Financial Statements |
The financial statements of the foreign subsidiaries of the Company have been translated into U.S. dollars. All assets and liabilities have been translated at current rates of exchange in effect at the end of the period. Income and expense items have been translated at the average exchange rates for the year or the applicable interim period. The gains or losses that result from this process are recorded as a separate component of other accumulated comprehensive income until the entity is sold or substantially liquidated.
|
| Business Combinations, Goodwill And Intangible Assets |
The authoritative guidance for business combinations specifies the criteria for recognizing and reporting intangible assets apart from goodwill. The Company records the assets acquired and liabilities assumed in business combinations at their respective fair values at the date of acquisition, with any excess purchase price recorded as goodwill. Goodwill is an asset representing the future economic benefits arising from other assets acquired in a business combination that are not individually identified and separately recognized. Intangible assets consist of client relationships, customer lists, distribution partner relationships, software, technology, non-compete agreements and trademarks that are initially measured at fair value. At the time of the business combination, trademarks may be considered an indefinite-lived asset and, as such, are not amortized as there may be no foreseeable limit to cash flows generated from them. For the Newswire acquisition the Company determined the trademarks acquired were considered a definite lived asset which will be amortized over a period of 15 years. The client relationships (5-10 years), customer lists (3 years), distribution partner relationships (10 years), non-compete agreements (5 years) and software and technology (3-7 years) are amortized over their estimated useful lives. The goodwill and intangible assets are assessed annually for impairment, or whenever conditions indicate the asset may be impaired, and any such impairment will be recognized in the period identified. As of June 30, 2024, the Company’s market capitalization is less than the carrying value of its equity, plus net debt. This may be an indicator of impairment of the Company’s long-lived assets, however, at this time, management believes the Company’s stock price is in temporary decline and also considers other factors such as future growth, positive cash flow and other measures the Company is able to control in determining if a quantitative test is necessary. Should the stock price continue to remain at levels below the Company’s carrying value, a quantitative test may be necessary, which could conclude an impairment exists.
|
| Comprehensive Income |
Comprehensive income consists of net income and other comprehensive income related to changes in the cumulative foreign currency translation adjustment.
|
| Advertising |
The Company expenses advertising as incurred. During the three and six-month periods ended June 30, 2024, advertising expense was $339,000 and $778,000, respectively. During the three and six-month periods ended June 30, 2023, advertising expense was $364,000 and $826,000, respectively.
|
| Stock-based Compensation |
The authoritative guidance for stock compensation requires that companies estimate the fair value of share-based payment awards on the date of the grant using an option-pricing model. The associated cost is recognized over the period during which an employee or director is required to provide service in exchange for the award.
|
| X |
- References
+ Details
| Name: |
isdr_ReceivablesTradeAndOtherAccountsReceivableAllowanceForDoubtfulAccountPolicy |
| Namespace Prefix: |
isdr_ |
| Data Type: |
nonnum:textBlockItemType |
| Balance Type: |
na |
| Period Type: |
duration |
|
| X |
- References
+ Details
| Name: |
us-gaap_AccountingPoliciesAbstract |
| Namespace Prefix: |
us-gaap_ |
| Data Type: |
xbrli:stringItemType |
| Balance Type: |
na |
| Period Type: |
duration |
|
| X |
- DefinitionDisclosure of accounting policy for advertising cost. Reference 1: http://www.xbrl.org/2003/role/disclosureRef
-Name Accounting Standards Codification
-Section 50
-Paragraph 1
-Subparagraph (a)
-SubTopic 35
-Topic 720
-Publisher FASB
-URI https://asc.fasb.org/1943274/2147483406/720-35-50-1
| Name: |
us-gaap_AdvertisingCostsPolicyTextBlock |
| Namespace Prefix: |
us-gaap_ |
| Data Type: |
dtr-types:textBlockItemType |
| Balance Type: |
na |
| Period Type: |
duration |
|
| X |
- DefinitionDisclosure of accounting policy for completed business combinations (purchase method, acquisition method or combination of entities under common control). This accounting policy may include a general discussion of the purchase method or acquisition method of accounting (including for example, the treatment accorded contingent consideration, the identification of assets and liabilities, the purchase price allocation process, how the fair values of acquired assets and liabilities are determined) and the entity's specific application thereof. An entity that acquires another entity in a leveraged buyout transaction generally discloses the accounting policy followed by the acquiring entity in determining the basis used to value its interest in the acquired entity, and the rationale for that accounting policy. Reference 1: http://fasb.org/us-gaap/role/ref/legacyRef
-Topic 805
-SubTopic 10
-Name Accounting Standards Codification
-Section 05
-Paragraph 4
-Subparagraph (d)
-Publisher FASB
-URI https://asc.fasb.org/1943274/2147479515/805-10-05-4
Reference 2: http://fasb.org/us-gaap/role/ref/legacyRef
-Topic 805
-SubTopic 10
-Name Accounting Standards Codification
-Section 05
-Paragraph 4
-Subparagraph (c)
-Publisher FASB
-URI https://asc.fasb.org/1943274/2147479515/805-10-05-4
Reference 3: http://fasb.org/us-gaap/role/ref/legacyRef
-Topic 805
-SubTopic 10
-Name Accounting Standards Codification
-Section 05
-Paragraph 4
-Subparagraph (b)
-Publisher FASB
-URI https://asc.fasb.org/1943274/2147479515/805-10-05-4
Reference 4: http://fasb.org/us-gaap/role/ref/legacyRef
-Topic 805
-SubTopic 10
-Name Accounting Standards Codification
-Section 05
-Paragraph 4
-Subparagraph (a)
-Publisher FASB
-URI https://asc.fasb.org/1943274/2147479515/805-10-05-4
| Name: |
us-gaap_BusinessCombinationsPolicy |
| Namespace Prefix: |
us-gaap_ |
| Data Type: |
dtr-types:textBlockItemType |
| Balance Type: |
na |
| Period Type: |
duration |
|
| X |
- DefinitionDisclosure of accounting policy for cash and cash equivalents, including the policy for determining which items are treated as cash equivalents. Other information that may be disclosed includes (1) the nature of any restrictions on the entity's use of its cash and cash equivalents, (2) whether the entity's cash and cash equivalents are insured or expose the entity to credit risk, (3) the classification of any negative balance accounts (overdrafts), and (4) the carrying basis of cash equivalents (for example, at cost) and whether the carrying amount of cash equivalents approximates fair value. Reference 1: http://fasb.org/us-gaap/role/ref/legacyRef
-Name Accounting Standards Codification
-Topic 230
-SubTopic 10
-Section 50
-Paragraph 1
-Publisher FASB
-URI https://asc.fasb.org/1943274/2147482913/230-10-50-1
| Name: |
us-gaap_CashAndCashEquivalentsPolicyTextBlock |
| Namespace Prefix: |
us-gaap_ |
| Data Type: |
dtr-types:textBlockItemType |
| Balance Type: |
na |
| Period Type: |
duration |
|
| X |
- DefinitionDisclosure of accounting policy for comprehensive income.
| Name: |
us-gaap_ComprehensiveIncomePolicyPolicyTextBlock |
| Namespace Prefix: |
us-gaap_ |
| Data Type: |
dtr-types:textBlockItemType |
| Balance Type: |
na |
| Period Type: |
duration |
|
| X |
- DefinitionDisclosure of accounting policy for credit risk. Reference 1: http://fasb.org/us-gaap/role/ref/legacyRef
-Name Accounting Standards Codification
-Topic 942
-SubTopic 825
-Section 50
-Paragraph 1
-Publisher FASB
-URI https://asc.fasb.org/1943274/2147478898/942-825-50-1
Reference 2: http://www.xbrl.org/2003/role/disclosureRef
-Name Accounting Standards Codification
-Section 50
-Paragraph 1
-Subparagraph (d)
-SubTopic 10
-Topic 275
-Publisher FASB
-URI https://asc.fasb.org/1943274/2147482861/275-10-50-1
| Name: |
us-gaap_ConcentrationRiskCreditRisk |
| Namespace Prefix: |
us-gaap_ |
| Data Type: |
dtr-types:textBlockItemType |
| Balance Type: |
na |
| Period Type: |
duration |
|
| X |
- DefinitionDisclosure of accounting policy for computing basic and diluted earnings or loss per share for each class of common stock and participating security. Addresses all significant policy factors, including any antidilutive items that have been excluded from the computation and takes into account stock dividends, splits and reverse splits that occur after the balance sheet date of the latest reporting period but before the issuance of the financial statements. Reference 1: http://www.xbrl.org/2003/role/disclosureRef
-Topic 260
-SubTopic 10
-Name Accounting Standards Codification
-Section 50
-Paragraph 1
-Subparagraph (d)
-Publisher FASB
-URI https://asc.fasb.org/1943274/2147482662/260-10-50-1
Reference 2: http://fasb.org/us-gaap/role/ref/legacyRef
-Name Accounting Standards Codification
-Topic 260
-SubTopic 10
-Section 50
-Paragraph 1
-Subparagraph (c)
-Publisher FASB
-URI https://asc.fasb.org/1943274/2147482662/260-10-50-1
Reference 3: http://fasb.org/us-gaap/role/ref/legacyRef
-Name Accounting Standards Codification
-Topic 260
-SubTopic 10
-Section 50
-Paragraph 2
-Publisher FASB
-URI https://asc.fasb.org/1943274/2147482662/260-10-50-2
| Name: |
us-gaap_EarningsPerSharePolicyTextBlock |
| Namespace Prefix: |
us-gaap_ |
| Data Type: |
dtr-types:textBlockItemType |
| Balance Type: |
na |
| Period Type: |
duration |
|
| X |
- DefinitionDisclosure of accounting policy for fair value measurements of financial and non-financial assets, liabilities and instruments classified in shareholders' equity. Disclosures include, but are not limited to, how an entity that manages a group of financial assets and liabilities on the basis of its net exposure measures the fair value of those assets and liabilities.
| Name: |
us-gaap_FairValueMeasurementPolicyPolicyTextBlock |
| Namespace Prefix: |
us-gaap_ |
| Data Type: |
dtr-types:textBlockItemType |
| Balance Type: |
na |
| Period Type: |
duration |
|
| X |
- DefinitionDisclosure of accounting policy for (1) transactions denominated in a currency other than the reporting enterprise's functional currency, (2) translating foreign currency financial statements that are incorporated into the financial statements of the reporting enterprise by consolidation, combination, or the equity method of accounting, and (3) remeasurement of the financial statements of a foreign reporting enterprise in a hyperinflationary economy. Reference 1: http://www.xbrl.org/2003/role/disclosureRef
-Topic 830
-Name Accounting Standards Codification
-Publisher FASB
-URI https://asc.fasb.org/830/tableOfContent
| Name: |
us-gaap_ForeignCurrencyTransactionsAndTranslationsPolicyTextBlock |
| Namespace Prefix: |
us-gaap_ |
| Data Type: |
dtr-types:textBlockItemType |
| Balance Type: |
na |
| Period Type: |
duration |
|
| X |
- DefinitionDisclosure of accounting policy for recognizing and measuring the impairment of long-lived assets. An entity also may disclose its accounting policy for long-lived assets to be sold. This policy excludes goodwill and intangible assets. Reference 1: http://fasb.org/us-gaap/role/ref/legacyRef
-Topic 360
-SubTopic 10
-Name Accounting Standards Codification
-Section S99
-Paragraph 2
-Subparagraph (SAB Topic 5.CC)
-Publisher FASB
-URI https://asc.fasb.org/1943274/2147480091/360-10-S99-2
Reference 2: http://fasb.org/us-gaap/role/ref/legacyRef
-Name Accounting Standards Codification
-Section 05
-Paragraph 4
-SubTopic 10
-Topic 360
-Publisher FASB
-URI https://asc.fasb.org/1943274/2147482338/360-10-05-4
| Name: |
us-gaap_ImpairmentOrDisposalOfLongLivedAssetsPolicyTextBlock |
| Namespace Prefix: |
us-gaap_ |
| Data Type: |
dtr-types:textBlockItemType |
| Balance Type: |
na |
| Period Type: |
duration |
|
| X |
- DefinitionDisclosure of accounting policy for income taxes, which may include its accounting policies for recognizing and measuring deferred tax assets and liabilities and related valuation allowances, recognizing investment tax credits, operating loss carryforwards, tax credit carryforwards, and other carryforwards, methodologies for determining its effective income tax rate and the characterization of interest and penalties in the financial statements. Reference 1: http://www.xbrl.org/2003/role/disclosureRef
-Topic 740
-SubTopic 10
-Name Accounting Standards Codification
-Section 50
-Paragraph 20
-Publisher FASB
-URI https://asc.fasb.org/1943274/2147482685/740-10-50-20
Reference 2: http://www.xbrl.org/2003/role/disclosureRef
-Topic 740
-SubTopic 10
-Name Accounting Standards Codification
-Section 50
-Paragraph 19
-Publisher FASB
-URI https://asc.fasb.org/1943274/2147482685/740-10-50-19
Reference 3: http://www.xbrl.org/2003/role/disclosureRef
-Topic 740
-SubTopic 10
-Name Accounting Standards Codification
-Section 45
-Paragraph 25
-Publisher FASB
-URI https://asc.fasb.org/1943274/2147482525/740-10-45-25
Reference 4: http://www.xbrl.org/2003/role/disclosureRef
-Topic 946
-SubTopic 10
-Name Accounting Standards Codification
-Section S99
-Paragraph 3
-Subparagraph (SX 210.6-03(h)(1))
-Publisher FASB
-URI https://asc.fasb.org/1943274/2147479886/946-10-S99-3
Reference 5: http://www.xbrl.org/2003/role/disclosureRef
-Topic 740
-SubTopic 10
-Name Accounting Standards Codification
-Section 50
-Paragraph 17
-Subparagraph (b)
-Publisher FASB
-URI https://asc.fasb.org/1943274/2147482685/740-10-50-17
Reference 6: http://www.xbrl.org/2003/role/disclosureRef
-Topic 740
-SubTopic 10
-Name Accounting Standards Codification
-Section 50
-Paragraph 9
-Publisher FASB
-URI https://asc.fasb.org/1943274/2147482685/740-10-50-9
Reference 7: http://www.xbrl.org/2003/role/disclosureRef
-Topic 740
-SubTopic 10
-Name Accounting Standards Codification
-Section 45
-Paragraph 28
-Publisher FASB
-URI https://asc.fasb.org/1943274/2147482525/740-10-45-28
Reference 8: http://www.xbrl.org/2003/role/disclosureRef
-Topic 220
-SubTopic 10
-Name Accounting Standards Codification
-Section 50
-Paragraph 1
-Publisher FASB
-URI https://asc.fasb.org/1943274/2147482765/220-10-50-1
| Name: |
us-gaap_IncomeTaxPolicyTextBlock |
| Namespace Prefix: |
us-gaap_ |
| Data Type: |
dtr-types:textBlockItemType |
| Balance Type: |
na |
| Period Type: |
duration |
|
| X |
- DefinitionDisclosure of accounting policy for costs incurred when both (1) the software is acquired, internally developed, or modified solely to meet the entity's internal needs, and (2) during the software's development or modification, no substantive plan exists or is being developed to market the software externally. Reference 1: http://www.xbrl.org/2003/role/disclosureRef
-Topic 350
-SubTopic 40
-Name Accounting Standards Codification
-Publisher FASB
-URI https://asc.fasb.org/350-40/tableOfContent
| Name: |
us-gaap_InternalUseSoftwarePolicy |
| Namespace Prefix: |
us-gaap_ |
| Data Type: |
dtr-types:textBlockItemType |
| Balance Type: |
na |
| Period Type: |
duration |
|
| X |
- DefinitionDisclosure of accounting policy for leasing arrangement entered into by lessee. Reference 1: http://www.xbrl.org/2003/role/disclosureRef
-Topic 842
-SubTopic 20
-Name Accounting Standards Codification
-Section 50
-Paragraph 1
-Subparagraph (b)
-Publisher FASB
-URI https://asc.fasb.org/1943274/2147478964/842-20-50-1
| Name: |
us-gaap_LesseeLeasesPolicyTextBlock |
| Namespace Prefix: |
us-gaap_ |
| Data Type: |
dtr-types:textBlockItemType |
| Balance Type: |
na |
| Period Type: |
duration |
|
| X |
- DefinitionDisclosure of accounting policy for revenue. Includes revenue from contract with customer and from other sources. Reference 1: http://www.xbrl.org/2003/role/disclosureRef
-Topic 946
-SubTopic 220
-Name Accounting Standards Codification
-Section S99
-Paragraph 1
-Subparagraph (SX 210.6-07(1))
-Publisher FASB
-URI https://asc.fasb.org/1943274/2147479134/946-220-S99-1
Reference 2: http://www.xbrl.org/2003/role/exampleRef
-Topic 235
-SubTopic 10
-Name Accounting Standards Codification
-Section 50
-Paragraph 4
-Subparagraph (f)
-Publisher FASB
-URI https://asc.fasb.org/1943274/2147483426/235-10-50-4
Reference 3: http://www.xbrl.org/2003/role/exampleRef
-Name Accounting Standards Codification
-Section 50
-Paragraph 4
-Subparagraph (e)
-SubTopic 10
-Topic 235
-Publisher FASB
-URI https://asc.fasb.org/1943274/2147483426/235-10-50-4
| Name: |
us-gaap_RevenueRecognitionPolicyTextBlock |
| Namespace Prefix: |
us-gaap_ |
| Data Type: |
dtr-types:textBlockItemType |
| Balance Type: |
na |
| Period Type: |
duration |
|
| X |
- DefinitionDisclosure of accounting policy for award under share-based payment arrangement. Includes, but is not limited to, methodology and assumption used in measuring cost. Reference 1: http://www.xbrl.org/2003/role/disclosureRef
-Topic 718
-SubTopic 10
-Name Accounting Standards Codification
-Section 50
-Paragraph 2
-Subparagraph (f)(1)
-Publisher FASB
-URI https://asc.fasb.org/1943274/2147480429/718-10-50-2
Reference 2: http://www.xbrl.org/2003/role/disclosureRef
-Topic 718
-SubTopic 10
-Name Accounting Standards Codification
-Section 50
-Paragraph 2
-Subparagraph (f)(2)(i)
-Publisher FASB
-URI https://asc.fasb.org/1943274/2147480429/718-10-50-2
Reference 3: http://www.xbrl.org/2003/role/disclosureRef
-Topic 718
-SubTopic 10
-Name Accounting Standards Codification
-Section 50
-Paragraph 2
-Subparagraph (f)(2)(ii)
-Publisher FASB
-URI https://asc.fasb.org/1943274/2147480429/718-10-50-2
Reference 4: http://www.xbrl.org/2003/role/disclosureRef
-Topic 718
-SubTopic 10
-Name Accounting Standards Codification
-Section 50
-Paragraph 2
-Subparagraph (f)(2)(v)
-Publisher FASB
-URI https://asc.fasb.org/1943274/2147480429/718-10-50-2
Reference 5: http://www.xbrl.org/2003/role/disclosureRef
-Topic 718
-SubTopic 10
-Name Accounting Standards Codification
-Section S99
-Paragraph 1
-Subparagraph (SAB Topic 14.C.Q3)
-Publisher FASB
-URI https://asc.fasb.org/1943274/2147479830/718-10-S99-1
Reference 6: http://www.xbrl.org/2003/role/disclosureRef
-Topic 718
-SubTopic 10
-Name Accounting Standards Codification
-Section S99
-Paragraph 1
-Subparagraph (SAB Topic 14.D.1.Q5)
-Publisher FASB
-URI https://asc.fasb.org/1943274/2147479830/718-10-S99-1
Reference 7: http://www.xbrl.org/2003/role/disclosureRef
-Topic 718
-SubTopic 10
-Name Accounting Standards Codification
-Section S99
-Paragraph 1
-Subparagraph (SAB Topic 14.D.3.Q2)
-Publisher FASB
-URI https://asc.fasb.org/1943274/2147479830/718-10-S99-1
Reference 8: http://www.xbrl.org/2003/role/disclosureRef
-Topic 718
-SubTopic 10
-Name Accounting Standards Codification
-Section S99
-Paragraph 1
-Subparagraph (SAB Topic 14.D.2.Q6)
-Publisher FASB
-URI https://asc.fasb.org/1943274/2147479830/718-10-S99-1
Reference 9: http://www.xbrl.org/2003/role/disclosureRef
-Topic 718
-Name Accounting Standards Codification
-Publisher FASB
-URI https://asc.fasb.org/718/tableOfContent
Reference 10: http://www.xbrl.org/2003/role/disclosureRef
-Topic 718
-SubTopic 10
-Name Accounting Standards Codification
-Section 50
-Paragraph 2
-Subparagraph (b)
-Publisher FASB
-URI https://asc.fasb.org/1943274/2147480429/718-10-50-2
Reference 11: http://www.xbrl.org/2003/role/disclosureRef
-Topic 718
-SubTopic 10
-Name Accounting Standards Codification
-Section 50
-Paragraph 2
-Subparagraph (f)(2)
-Publisher FASB
-URI https://asc.fasb.org/1943274/2147480429/718-10-50-2
| Name: |
us-gaap_ShareBasedCompensationOptionAndIncentivePlansPolicy |
| Namespace Prefix: |
us-gaap_ |
| Data Type: |
dtr-types:textBlockItemType |
| Balance Type: |
na |
| Period Type: |
duration |
|
| X |
- DefinitionDisclosure of accounting policy for the use of estimates in the preparation of financial statements in conformity with generally accepted accounting principles. Reference 1: http://fasb.org/us-gaap/role/ref/legacyRef
-Name Accounting Standards Codification
-Topic 275
-SubTopic 10
-Section 50
-Paragraph 9
-Publisher FASB
-URI https://asc.fasb.org/1943274/2147482861/275-10-50-9
Reference 2: http://fasb.org/us-gaap/role/ref/legacyRef
-Name Accounting Standards Codification
-Topic 275
-SubTopic 10
-Section 50
-Paragraph 4
-Publisher FASB
-URI https://asc.fasb.org/1943274/2147482861/275-10-50-4
Reference 3: http://www.xbrl.org/2003/role/disclosureRef
-Name Accounting Standards Codification
-Section 50
-Paragraph 1
-Subparagraph (b)
-SubTopic 10
-Topic 275
-Publisher FASB
-URI https://asc.fasb.org/1943274/2147482861/275-10-50-1
Reference 4: http://www.xbrl.org/2003/role/disclosureRef
-Name Accounting Standards Codification
-Section 50
-Paragraph 1
-Subparagraph (c)
-SubTopic 10
-Topic 275
-Publisher FASB
-URI https://asc.fasb.org/1943274/2147482861/275-10-50-1
Reference 5: http://www.xbrl.org/2003/role/disclosureRef
-Name Accounting Standards Codification
-Section 50
-Paragraph 11
-SubTopic 10
-Topic 275
-Publisher FASB
-URI https://asc.fasb.org/1943274/2147482861/275-10-50-11
Reference 6: http://www.xbrl.org/2003/role/disclosureRef
-Name Accounting Standards Codification
-Section 50
-Paragraph 12
-SubTopic 10
-Topic 275
-Publisher FASB
-URI https://asc.fasb.org/1943274/2147482861/275-10-50-12
Reference 7: http://fasb.org/us-gaap/role/ref/legacyRef
-Name Accounting Standards Codification
-Topic 275
-SubTopic 10
-Section 50
-Paragraph 8
-Publisher FASB
-URI https://asc.fasb.org/1943274/2147482861/275-10-50-8
| Name: |
us-gaap_UseOfEstimates |
| Namespace Prefix: |
us-gaap_ |
| Data Type: |
dtr-types:textBlockItemType |
| Balance Type: |
na |
| Period Type: |
duration |
|
v3.24.2.u1
Summary of Significant Accounting Policies (Tables)
|
6 Months Ended |
Jun. 30, 2024 |
|---|
| Summary of Significant Accounting Policies |
|
| Allowance for doubtful accounts |
| | For the Three Months Ended | | | For the Six Months Ended | | | | June 30, | | | June 30, | | | June 30, | | | June 30, | | | | 2024 | | | 2023 | | | 2024 | | | 2023 | | | | | | | | | | | | | | | Beginning balance | | $ | 1,144 | | | $ | 858 | | | $ | 1,119 | | | $ | 745 | | Provision for credit losses | | | 313 | | | | 109 | | | | 595 | | | | 260 | | Write-offs | | | (301 | ) | | | (11 | ) | | | (558 | ) | | | (49 | ) | Ending Balance | | | 1,156 | | | | 956 | | | | 1,156 | | | | 956 | |
|
| Capitalized costs and amortization |
| | For the Three Months Ended | | | For the Six Months Ended | | | | June 30, | | | June 30, | | | June 30, | | | June 30, | | | | 2024 | | | 2023 | | | 2024 | | | 2023 | | | | | | | | | | | | | | | Capitalized software development costs | | $ | 155 | | | $ | 167 | | | $ | 400 | | | $ | 167 | | Amortization included in cost of revenues | | | 54 | | | | 13 | | | | 100 | | | | 28 | |
|
| X |
- References
+ Details
| Name: |
us-gaap_AccountingPoliciesAbstract |
| Namespace Prefix: |
us-gaap_ |
| Data Type: |
xbrli:stringItemType |
| Balance Type: |
na |
| Period Type: |
duration |
|
| X |
- DefinitionTabular disclosure of allowance for credit loss on accounts receivable. Reference 1: http://www.xbrl.org/2009/role/commonPracticeRef
-Topic 326
-SubTopic 20
-Name Accounting Standards Codification
-Section 50
-Paragraph 13
-Publisher FASB
-URI https://asc.fasb.org/1943274/2147479319/326-20-50-13
| Name: |
us-gaap_AccountsReceivableAllowanceForCreditLossTableTextBlock |
| Namespace Prefix: |
us-gaap_ |
| Data Type: |
dtr-types:textBlockItemType |
| Balance Type: |
na |
| Period Type: |
duration |
|
| X |
- DefinitionTabular disclosure of the capitalization of the entity comprised of its long-term debt and equity instruments. The table may be detailed by subsidiary (legal entity) and include information by type of debt or equity detailed by instrument.
| Name: |
us-gaap_ScheduleOfCapitalizationTextBlock |
| Namespace Prefix: |
us-gaap_ |
| Data Type: |
dtr-types:textBlockItemType |
| Balance Type: |
na |
| Period Type: |
duration |
|
v3.24.2.u1
Equity (Tables)
|
6 Months Ended |
Jun. 30, 2024 |
|---|
| Equity |
|
| Schedule of stock Options Outstanding And Exercisable |
| | Options Outstanding | | | Options Exercisable | | Exercise Price Range | | Number | | | Weighted Average Remaining Contractual Life (in Years) | | | Weighted Average Exercise Price | | | Number | | $ 0.01 - 8.00 | | | 5,000 | | | | 1.39 | | | $ | 6.80 | | | | 5,000 | | $ 8.01 - 11.00 | | | 3,000 | | | | 3.50 | | | $ | 10.25 | | | | 3,000 | | $ 11.01 - 16.00 | | | 18,000 | | | | 4.03 | | | $ | 13.12 | | | | 18,000 | | $ 16.01 - 27.00 | | | 38,000 | | | | 7.55 | | | $ | 24.96 | | | | 15,500 | | $ 27.01 - 27.71 | | | 12,750 | | | | 7.55 | | | $ | 27.71 | | | | — | | Total | | | 76,750 | | | | 6.16 | | | $ | 20.88 | | | | 41,500 | |
|
| X |
- References
+ Details
| Name: |
us-gaap_EquityAbstract |
| Namespace Prefix: |
us-gaap_ |
| Data Type: |
xbrli:stringItemType |
| Balance Type: |
na |
| Period Type: |
duration |
|
| X |
- DefinitionTabular disclosure of option exercise prices, by grouped ranges, including the upper and lower limits of the price range, the number of shares under option, weighted average exercise price and remaining contractual option terms. Reference 1: http://fasb.org/us-gaap/role/ref/legacyRef
-Name Accounting Standards Codification
-Topic 718
-SubTopic 10
-Section 50
-Paragraph 2
-Publisher FASB
-URI https://asc.fasb.org/1943274/2147480429/718-10-50-2
| Name: |
us-gaap_ScheduleOfShareBasedCompensationSharesAuthorizedUnderStockOptionPlansByExercisePriceRangeTextBlock |
| Namespace Prefix: |
us-gaap_ |
| Data Type: |
dtr-types:textBlockItemType |
| Balance Type: |
na |
| Period Type: |
duration |
|
v3.24.2.u1
Leases (Tables)
|
6 Months Ended |
Jun. 30, 2024 |
|---|
| Leases |
|
| Lease Expense |
| | For the Three Months Ended | | | For the Six Months Ended | | | | June 30, | | | June 30, | | | June 30, | | | June 30, | | | | 2024 | | | 2023 | | | 2024 | | | 2023 | | Lease expense | | | | | | | | | | | | | Operating lease expense | | $ | 76 | | | $ | 76 | | | $ | 152 | | | $ | 152 | | Variable lease expense | | | 18 | | | | 15 | | | | 32 | | | | 21 | | Total lease expense | | $ | 94 | | | $ | 91 | | | $ | 184 | | | $ | 173 | |
|
| Future Minimum Lease Payments |
Year Ended December 31: | | | | 2024 | | $ | 191 | | 2025 | | | 390 | | 2026 | | | 401 | | 2027 | | | 412 | | Total lease payments | | | 1,394 | | Present value adjustment | | | (170 | ) | Lease liability | | $ | 1,224 | |
|
| X |
- DefinitionTabular disclosure of lessee's lease cost. Includes, but is not limited to, interest expense for finance lease, amortization of right-of-use asset for finance lease, operating lease cost, short-term lease cost, variable lease cost and sublease income. Reference 1: http://www.xbrl.org/2009/role/commonPracticeRef
-Topic 842
-SubTopic 20
-Name Accounting Standards Codification
-Section 50
-Paragraph 4
-Publisher FASB
-URI https://asc.fasb.org/1943274/2147478964/842-20-50-4
| Name: |
us-gaap_LeaseCostTableTextBlock |
| Namespace Prefix: |
us-gaap_ |
| Data Type: |
dtr-types:textBlockItemType |
| Balance Type: |
na |
| Period Type: |
duration |
|
| X |
- References
+ Details
| Name: |
us-gaap_LeasesAbstract |
| Namespace Prefix: |
us-gaap_ |
| Data Type: |
xbrli:stringItemType |
| Balance Type: |
na |
| Period Type: |
duration |
|
| X |
- DefinitionTabular disclosure of undiscounted cash flows of lessee's operating lease liability. Includes, but is not limited to, reconciliation of undiscounted cash flows to operating lease liability recognized in statement of financial position. Reference 1: http://www.xbrl.org/2009/role/commonPracticeRef
-Topic 842
-SubTopic 20
-Name Accounting Standards Codification
-Section 50
-Paragraph 6
-Publisher FASB
-URI https://asc.fasb.org/1943274/2147478964/842-20-50-6
| Name: |
us-gaap_LesseeOperatingLeaseLiabilityMaturityTableTextBlock |
| Namespace Prefix: |
us-gaap_ |
| Data Type: |
dtr-types:textBlockItemType |
| Balance Type: |
na |
| Period Type: |
duration |
|
v3.24.2.u1
Revenue (Tables)
|
6 Months Ended |
Jun. 30, 2024 |
|---|
| Revenue |
|
| Disaggregated Revenue |
| | Three months ended June 30, | | Revenue Streams | | 2024 | | | 2023 | | Communications | | $ | 5,944 | | | | 77.3 | % | | $ | 5,936 | | | | 61.5 | % | Compliance | | | 1,743 | | | | 22.7 | % | | | 3,715 | | | | 38.5 | % | Total | | $ | 7,687 | | | | 100.0 | % | | $ | 9,651 | | | | 100.0 | % |
| | Six months ended June 30, | | Revenue Streams | | 2024 | | | 2023 | | Communications | | $ | 11,403 | | | | 77.8 | % | | $ | 12,502 | | | | 68.4 | % | Compliance | | | 3,246 | | | | 22.2 | % | | | 5,768 | | | | 31.6 | % | Total | | $ | 14,649 | | | | 100.0 | % | | $ | 18,270 | | | | 100.0 | % |
|
| X |
- DefinitionTabular disclosure of disaggregation of revenue into categories depicting how nature, amount, timing, and uncertainty of revenue and cash flows are affected by economic factor. Reference 1: http://www.xbrl.org/2009/role/commonPracticeRef
-Topic 606
-SubTopic 10
-Name Accounting Standards Codification
-Section 50
-Paragraph 5
-Publisher FASB
-URI https://asc.fasb.org/1943274/2147479806/606-10-50-5
| Name: |
us-gaap_DisaggregationOfRevenueTableTextBlock |
| Namespace Prefix: |
us-gaap_ |
| Data Type: |
dtr-types:textBlockItemType |
| Balance Type: |
na |
| Period Type: |
duration |
|
| X |
- References
+ Details
| Name: |
us-gaap_RevenueFromContractWithCustomerAbstract |
| Namespace Prefix: |
us-gaap_ |
| Data Type: |
xbrli:stringItemType |
| Balance Type: |
na |
| Period Type: |
duration |
|
v3.24.2.u1
Credit Agreement (Tables)
|
6 Months Ended |
Jun. 30, 2024 |
|---|
| Credit Agreement |
|
| Schedule of credit agreement |
| Original | As Amended | Fiscal Quarter | Fixed Charge Coverage Ratio | Fixed Charge Coverage Ratio | Each fiscal quarter ending on or after June 30, 2023 through June 30, 2024 | 1.2:1.0 | 1.2:1.0 | Fiscal quarter ending on or after September 30, 2024 through March 31, 2025 | 1.2:1.0 | 1.15:1.0 | Each fiscal quarter ending on or after June 30, 2025 | 1.2:1.0 | 1.2:1.0 | | | | | Leverage Ratio | Leverage Ratio | Each fiscal quarter ending on or after June 30, 2023 through September 30, 2023 | 2.75:1.0 | 2.75:1.0 | Fiscal quarter ending December 31, 2023 | 2.5:1.0 | 2.5:1.0 | Fiscal quarter ending March 31, 2024 | 2.5:1.0 | 2.75:1.0 | Each fiscal quarter ending on or after June 30, 2024 through September 30, 2024 | 2.5:1.0 | 3.5:1.0 | Fiscal quarter ending December 31, 2024 | 2.5:1.0 | 3.0:1.0 | Fiscal quarter ending March 31, 2025 | 2.5:1.0 | 2.85:1.0 | Each fiscal quarter ending on or after June 30, 2025 | 2.5:1.0 | 2.75:1.0 |
|
| X |
- References
+ Details
| Name: |
isdr_CreditAgreementAbstract |
| Namespace Prefix: |
isdr_ |
| Data Type: |
xbrli:stringItemType |
| Balance Type: |
na |
| Period Type: |
duration |
|
| X |
- References
+ Details
| Name: |
isdr_ScheduleOfCreditAgreementTableTextBlock |
| Namespace Prefix: |
isdr_ |
| Data Type: |
nonnum:textBlockItemType |
| Balance Type: |
na |
| Period Type: |
duration |
|
v3.24.2.u1
Summary of Significant Accounting Policies (Details) - USD ($)
$ in Thousands |
3 Months Ended |
6 Months Ended |
Jun. 30, 2024 |
Jun. 30, 2023 |
Jun. 30, 2024 |
Jun. 30, 2023 |
| Summary of Significant Accounting Policies |
|
|
|
|
| Allowance for doubtful accounts, beginning |
$ 1,144
|
$ 858
|
$ 1,119
|
$ 745
|
| Provision for credit losses |
313
|
109
|
595
|
260
|
| Write-offs |
(301)
|
(11)
|
(558)
|
(49)
|
| Allowance for doubtful accounts, ending |
$ 1,156
|
$ 956
|
$ 1,156
|
$ 956
|
| X |
- References
+ Details
| Name: |
isdr_AllowanceForDoubtfulAccountsBeginning |
| Namespace Prefix: |
isdr_ |
| Data Type: |
xbrli:monetaryItemType |
| Balance Type: |
credit |
| Period Type: |
duration |
|
| X |
- References
+ Details
| Name: |
isdr_AllowanceForDoubtfulAccountsEnding |
| Namespace Prefix: |
isdr_ |
| Data Type: |
xbrli:monetaryItemType |
| Balance Type: |
credit |
| Period Type: |
duration |
|
| X |
- References
+ Details
| Name: |
us-gaap_AccountingPoliciesAbstract |
| Namespace Prefix: |
us-gaap_ |
| Data Type: |
xbrli:stringItemType |
| Balance Type: |
na |
| Period Type: |
duration |
|
| X |
- DefinitionAmount of direct write-downs of accounts receivable charged against the allowance. Reference 1: http://www.xbrl.org/2003/role/disclosureRef
-Topic 326
-SubTopic 20
-Name Accounting Standards Codification
-Section 50
-Paragraph 13
-Subparagraph (d)
-Publisher FASB
-URI https://asc.fasb.org/1943274/2147479319/326-20-50-13
| Name: |
us-gaap_AllowanceForDoubtfulAccountsReceivableWriteOffs |
| Namespace Prefix: |
us-gaap_ |
| Data Type: |
xbrli:monetaryItemType |
| Balance Type: |
debit |
| Period Type: |
duration |
|
| X |
- DefinitionAmount of expense related to credit loss from transactions other than loan and lease transactions. Reference 1: http://fasb.org/us-gaap/role/ref/legacyRef
-Name Accounting Standards Codification
-Section 45
-Paragraph 28
-Subparagraph (a)
-SubTopic 10
-Topic 230
-Publisher FASB
-URI https://asc.fasb.org/1943274/2147482740/230-10-45-28
Reference 2: http://fasb.org/us-gaap/role/ref/legacyRef
-Topic 942
-SubTopic 220
-Name Accounting Standards Codification
-Section S99
-Paragraph 1
-Subparagraph (SX 210.9-04(11))
-Publisher FASB
-URI https://asc.fasb.org/1943274/2147478524/942-220-S99-1
| Name: |
us-gaap_ProvisionForOtherCreditLosses |
| Namespace Prefix: |
us-gaap_ |
| Data Type: |
xbrli:monetaryItemType |
| Balance Type: |
debit |
| Period Type: |
duration |
|
v3.24.2.u1
| X |
- References
+ Details
| Name: |
isdr_AmortizationIncludedInCostOfRevenues |
| Namespace Prefix: |
isdr_ |
| Data Type: |
xbrli:monetaryItemType |
| Balance Type: |
debit |
| Period Type: |
duration |
|
| X |
- References
+ Details
| Name: |
us-gaap_AccountingPoliciesAbstract |
| Namespace Prefix: |
us-gaap_ |
| Data Type: |
xbrli:stringItemType |
| Balance Type: |
na |
| Period Type: |
duration |
|
| X |
- DefinitionAmount of development cost incurred in oil- and gas-producing activities. Includes capitalized cost and cost charged to expense. Reference 1: http://www.xbrl.org/2003/role/exampleRef
-Topic 932
-SubTopic 235
-Name Accounting Standards Codification
-Section 55
-Paragraph 4
-Publisher FASB
-URI https://asc.fasb.org/1943274/2147477916/932-235-55-4
Reference 2: http://www.xbrl.org/2003/role/exampleRef
-Topic 932
-SubTopic 235
-Name Accounting Standards Codification
-Section 50
-Paragraph 17
-Publisher FASB
-URI https://asc.fasb.org/1943274/2147477215/932-235-50-17
Reference 3: http://www.xbrl.org/2003/role/disclosureRef
-Topic 932
-SubTopic 235
-Name Accounting Standards Codification
-Section 50
-Paragraph 20
-Subparagraph (b)
-Publisher FASB
-URI https://asc.fasb.org/1943274/2147477215/932-235-50-20
Reference 4: http://www.xbrl.org/2003/role/disclosureRef
-Topic 932
-SubTopic 235
-Name Accounting Standards Codification
-Section 50
-Paragraph 20
-Subparagraph (a)
-Publisher FASB
-URI https://asc.fasb.org/1943274/2147477215/932-235-50-20
Reference 5: http://www.xbrl.org/2003/role/disclosureRef
-Topic 932
-SubTopic 235
-Name Accounting Standards Codification
-Section 50
-Paragraph 19
-Publisher FASB
-URI https://asc.fasb.org/1943274/2147477215/932-235-50-19
Reference 6: http://www.xbrl.org/2003/role/disclosureRef
-Topic 932
-SubTopic 235
-Name Accounting Standards Codification
-Section 50
-Paragraph 18
-Subparagraph (c)
-Publisher FASB
-URI https://asc.fasb.org/1943274/2147477215/932-235-50-18
| Name: |
us-gaap_CostsIncurredDevelopmentCosts |
| Namespace Prefix: |
us-gaap_ |
| Data Type: |
xbrli:monetaryItemType |
| Balance Type: |
debit |
| Period Type: |
duration |
|
v3.24.2.u1
Summary of Significant Accounting Policies (Details Narrative) - USD ($)
|
3 Months Ended |
6 Months Ended |
|
Jun. 30, 2024 |
Jun. 30, 2023 |
Jun. 30, 2024 |
Jun. 30, 2023 |
Dec. 31, 2023 |
| Antidilutive securities excluded from computation of earnings per common share |
70,750
|
72,250
|
68,750
|
72,250
|
|
| Deferred revenue |
$ 5,476,000
|
|
$ 5,476,000
|
|
$ 5,412,000
|
| Revenue Recognized Included in the Deferred Revenue |
|
|
4,934,000
|
$ 4,337,000
|
|
| Accounts receivable related to contracts with customers |
4,686,000
|
|
4,686,000
|
|
4,368,000
|
| Capitalized costs |
118,000
|
|
118,000
|
|
$ 130,000
|
| FDIC insurance limit |
250,000
|
|
250,000
|
|
|
| Advertising Expense |
339,000
|
$ 364,000
|
$ 778,000
|
$ 826,000
|
|
| Intangible asset estimated useful lives |
|
|
15 years
|
|
|
| Canada [Member] |
|
|
|
|
|
| Cash-on-hand |
1,293,000
|
|
$ 1,293,000
|
|
|
| Europe |
|
|
|
|
|
| Cash-on-hand |
$ 64,000
|
|
$ 64,000
|
|
|
| Customer Lists |
|
|
|
|
|
| Intangible asset estimated useful lives |
|
|
3 years
|
|
|
| Distribution Partner Relationships |
|
|
|
|
|
| Intangible asset estimated useful lives |
|
|
10 years
|
|
|
| Non-compete Agreements |
|
|
|
|
|
| Intangible asset estimated useful lives |
|
|
5 years
|
|
|
| Maximum [Member] | Customer Relationships |
|
|
|
|
|
| Intangible asset estimated useful lives |
|
|
10 years
|
|
|
| Maximum [Member] | Software and Technology |
|
|
|
|
|
| Intangible asset estimated useful lives |
|
|
7 years
|
|
|
| Minimum [Member] | Software and Technology |
|
|
|
|
|
| Intangible asset estimated useful lives |
|
|
3 years
|
|
|
| Common Stock |
|
|
|
|
|
| Intangible asset estimated useful lives |
|
|
5 years
|
|
|
| X |
- References
+ Details
| Name: |
isdr_FiniteLivedIntangibleAssetsAmortizationPeriodUsefulLife |
| Namespace Prefix: |
isdr_ |
| Data Type: |
xbrli:durationItemType |
| Balance Type: |
na |
| Period Type: |
duration |
|
| X |
- DefinitionAmount charged to advertising expense for the period, which are expenses incurred with the objective of increasing revenue for a specified brand, product or product line. Reference 1: http://www.xbrl.org/2003/role/exampleRef
-Topic 720
-SubTopic 35
-Name Accounting Standards Codification
-Section 55
-Paragraph 1
-Publisher FASB
-URI https://asc.fasb.org/1943274/2147483385/720-35-55-1
Reference 2: http://www.xbrl.org/2003/role/disclosureRef
-Topic 720
-SubTopic 35
-Name Accounting Standards Codification
-Section 50
-Paragraph 1
-Subparagraph (b)
-Publisher FASB
-URI https://asc.fasb.org/1943274/2147483406/720-35-50-1
| Name: |
us-gaap_AdvertisingExpense |
| Namespace Prefix: |
us-gaap_ |
| Data Type: |
xbrli:monetaryItemType |
| Balance Type: |
debit |
| Period Type: |
duration |
|
| X |
- DefinitionSecurities (including those issuable pursuant to contingent stock agreements) that could potentially dilute basic earnings per share (EPS) or earnings per unit (EPU) in the future that were not included in the computation of diluted EPS or EPU because to do so would increase EPS or EPU amounts or decrease loss per share or unit amounts for the period presented. Reference 1: http://www.xbrl.org/2003/role/disclosureRef
-Topic 260
-SubTopic 10
-Name Accounting Standards Codification
-Section 50
-Paragraph 1
-Subparagraph (c)
-Publisher FASB
-URI https://asc.fasb.org/1943274/2147482662/260-10-50-1
| Name: |
us-gaap_AntidilutiveSecuritiesExcludedFromComputationOfEarningsPerShareAmount |
| Namespace Prefix: |
us-gaap_ |
| Data Type: |
xbrli:sharesItemType |
| Balance Type: |
na |
| Period Type: |
duration |
|
| X |
- DefinitionAmount, after accumulated amortization and accumulated impairment loss, of asset recognized from cost incurred to obtain or fulfill contract with customer. Reference 1: http://www.xbrl.org/2003/role/disclosureRef
-Topic 340
-SubTopic 40
-Name Accounting Standards Codification
-Section 50
-Paragraph 3
-Subparagraph (a)
-Publisher FASB
-URI https://asc.fasb.org/1943274/2147479483/340-40-50-3
| Name: |
us-gaap_CapitalizedContractCostNet |
| Namespace Prefix: |
us-gaap_ |
| Data Type: |
xbrli:monetaryItemType |
| Balance Type: |
debit |
| Period Type: |
instant |
|
| X |
- DefinitionAmount of currency on hand as well as demand deposits with banks or financial institutions. Includes other kinds of accounts that have the general characteristics of demand deposits. Excludes cash and cash equivalents within disposal group and discontinued operation. Reference 1: http://www.xbrl.org/2003/role/exampleRef
-Topic 852
-SubTopic 10
-Name Accounting Standards Codification
-Section 55
-Paragraph 10
-Publisher FASB
-URI https://asc.fasb.org/1943274/2147481372/852-10-55-10
Reference 2: http://www.xbrl.org/2003/role/exampleRef
-Topic 946
-SubTopic 830
-Name Accounting Standards Codification
-Section 55
-Paragraph 12
-Publisher FASB
-URI https://asc.fasb.org/1943274/2147479168/946-830-55-12
Reference 3: http://www.xbrl.org/2003/role/disclosureRef
-Topic 944
-SubTopic 210
-Name Accounting Standards Codification
-Section S99
-Paragraph 1
-Subparagraph (SX 210.7-03(a)(2))
-Publisher FASB
-URI https://asc.fasb.org/1943274/2147478777/944-210-S99-1
Reference 4: http://www.xbrl.org/2003/role/disclosureRef
-Topic 946
-SubTopic 210
-Name Accounting Standards Codification
-Section S99
-Paragraph 1
-Subparagraph (SX 210.6-04(4))
-Publisher FASB
-URI https://asc.fasb.org/1943274/2147479170/946-210-S99-1
Reference 5: http://www.xbrl.org/2003/role/disclosureRef
-Topic 946
-SubTopic 210
-Name Accounting Standards Codification
-Section 45
-Paragraph 21
-Publisher FASB
-URI https://asc.fasb.org/1943274/2147477796/946-210-45-21
Reference 6: http://www.xbrl.org/2009/role/commonPracticeRef
-Topic 210
-SubTopic 10
-Name Accounting Standards Codification
-Section S99
-Paragraph 1
-Subparagraph (SX 210.5-02(1))
-Publisher FASB
-URI https://asc.fasb.org/1943274/2147480566/210-10-S99-1
Reference 7: http://www.xbrl.org/2003/role/disclosureRef
-Name Accounting Standards Codification
-Section 45
-Paragraph 20
-SubTopic 210
-Topic 946
-Publisher FASB
-URI https://asc.fasb.org/1943274/2147477796/946-210-45-20
| Name: |
us-gaap_Cash |
| Namespace Prefix: |
us-gaap_ |
| Data Type: |
xbrli:monetaryItemType |
| Balance Type: |
debit |
| Period Type: |
instant |
|
| X |
- DefinitionThe amount of cash deposited in financial institutions as of the balance sheet date that is insured by the Federal Deposit Insurance Corporation.
| Name: |
us-gaap_CashFDICInsuredAmount |
| Namespace Prefix: |
us-gaap_ |
| Data Type: |
xbrli:monetaryItemType |
| Balance Type: |
debit |
| Period Type: |
instant |
|
| X |
- DefinitionAmount, after allowance for credit loss, of right to consideration in exchange for good or service transferred to customer when right is conditioned on something other than passage of time. Reference 1: http://www.xbrl.org/2003/role/disclosureRef
-Topic 606
-SubTopic 10
-Name Accounting Standards Codification
-Section 45
-Paragraph 3
-Publisher FASB
-URI https://asc.fasb.org/1943274/2147479837/606-10-45-3
Reference 2: http://www.xbrl.org/2003/role/disclosureRef
-Topic 606
-SubTopic 10
-Name Accounting Standards Codification
-Section 45
-Paragraph 1
-Publisher FASB
-URI https://asc.fasb.org/1943274/2147479837/606-10-45-1
Reference 3: http://www.xbrl.org/2003/role/disclosureRef
-Topic 606
-SubTopic 10
-Name Accounting Standards Codification
-Section 50
-Paragraph 8
-Subparagraph (a)
-Publisher FASB
-URI https://asc.fasb.org/1943274/2147479806/606-10-50-8
| Name: |
us-gaap_ContractWithCustomerAssetNet |
| Namespace Prefix: |
us-gaap_ |
| Data Type: |
xbrli:monetaryItemType |
| Balance Type: |
debit |
| Period Type: |
instant |
|
| X |
- DefinitionAmount of deferred income and obligation to transfer product and service to customer for which consideration has been received or is receivable. Reference 1: http://www.xbrl.org/2009/role/commonPracticeRef
-Topic 210
-SubTopic 10
-Name Accounting Standards Codification
-Section S99
-Paragraph 1
-Subparagraph (SX 210.5-02(26)(c))
-Publisher FASB
-URI https://asc.fasb.org/1943274/2147480566/210-10-S99-1
| Name: |
us-gaap_DeferredRevenue |
| Namespace Prefix: |
us-gaap_ |
| Data Type: |
xbrli:monetaryItemType |
| Balance Type: |
credit |
| Period Type: |
instant |
|
| X |
- DefinitionThe amount of previously reported deferred or unearned revenue that was recognized as revenue during the period. For cash flows, this element primarily pertains to amortization of deferred credits on long-term arrangements. As a noncash item, it is deducted from net income when calculating cash provided by or used in operations using the indirect method. Reference 1: http://fasb.org/us-gaap/role/ref/otherTransitionRef
-Topic 230
-SubTopic 10
-Name Accounting Standards Codification
-Section 45
-Paragraph 28
-Publisher FASB
-URI https://asc.fasb.org/1943274/2147482740/230-10-45-28
| Name: |
us-gaap_RecognitionOfDeferredRevenue |
| Namespace Prefix: |
us-gaap_ |
| Data Type: |
xbrli:monetaryItemType |
| Balance Type: |
credit |
| Period Type: |
duration |
|
| X |
- Details
| Name: |
srt_StatementGeographicalAxis=srt_EuropeMember |
| Namespace Prefix: |
|
| Data Type: |
na |
| Balance Type: |
|
| Period Type: |
|
|
| X |
- Details
| Name: |
us-gaap_FiniteLivedIntangibleAssetsByMajorClassAxis=us-gaap_CustomerListsMember |
| Namespace Prefix: |
|
| Data Type: |
na |
| Balance Type: |
|
| Period Type: |
|
|
| X |
- Details
| Name: |
us-gaap_FiniteLivedIntangibleAssetsByMajorClassAxis=isdr_DistributionPartnerRelationshipsMember |
| Namespace Prefix: |
|
| Data Type: |
na |
| Balance Type: |
|
| Period Type: |
|
|
| X |
- Details
| Name: |
us-gaap_FiniteLivedIntangibleAssetsByMajorClassAxis=us-gaap_NoncompeteAgreementsMember |
| Namespace Prefix: |
|
| Data Type: |
na |
| Balance Type: |
|
| Period Type: |
|
|
| X |
- Details
| Name: |
srt_RangeAxis=srt_MaximumMember |
| Namespace Prefix: |
|
| Data Type: |
na |
| Balance Type: |
|
| Period Type: |
|
|
| X |
- Details
| Name: |
us-gaap_FiniteLivedIntangibleAssetsByMajorClassAxis=us-gaap_CustomerRelationshipsMember |
| Namespace Prefix: |
|
| Data Type: |
na |
| Balance Type: |
|
| Period Type: |
|
|
| X |
- Details
| Name: |
us-gaap_FiniteLivedIntangibleAssetsByMajorClassAxis=us-gaap_TechnologyBasedIntangibleAssetsMember |
| Namespace Prefix: |
|
| Data Type: |
na |
| Balance Type: |
|
| Period Type: |
|
|
| X |
- Details
| Name: |
srt_RangeAxis=srt_MinimumMember |
| Namespace Prefix: |
|
| Data Type: |
na |
| Balance Type: |
|
| Period Type: |
|
|
| X |
- Details
| Name: |
us-gaap_StatementEquityComponentsAxis=us-gaap_CommonStockMember |
| Namespace Prefix: |
|
| Data Type: |
na |
| Balance Type: |
|
| Period Type: |
|
|
v3.24.2.u1
Equity (Details) - $ / shares
|
6 Months Ended |
|
Jun. 30, 2024 |
Mar. 31, 2024 |
| Option 1 |
|
|
| Number of options outstanding |
|
5,000
|
| Weighted average remaining contractual life (in years) |
1 year 4 months 20 days
|
|
| Weighted average exercise price outstanding, beginning |
|
$ 6.80
|
| Number of options exercisable |
|
5,000
|
| Exercise price range |
0.01 - 8.00
|
|
| Option 2 |
|
|
| Number of options outstanding |
|
3,000
|
| Weighted average remaining contractual life (in years) |
3 years 6 months
|
|
| Weighted average exercise price outstanding, beginning |
|
$ 10.25
|
| Number of options exercisable |
|
3,000
|
| Exercise price range |
8.01 - 11.00
|
|
| Option 3 |
|
|
| Number of options outstanding |
|
18,000
|
| Weighted average remaining contractual life (in years) |
4 years 10 days
|
|
| Weighted average exercise price outstanding, beginning |
|
$ 13.12
|
| Number of options exercisable |
|
18,000
|
| Exercise price range |
11.01 - 16.00
|
|
| Option 4 |
|
|
| Number of options outstanding |
|
38,000
|
| Weighted average remaining contractual life (in years) |
7 years 6 months 18 days
|
|
| Weighted average exercise price outstanding, beginning |
|
$ 24.96
|
| Number of options exercisable |
|
15,500
|
| Exercise price range |
16.01 - 27.00
|
|
| Option 5 |
|
|
| Number of options outstanding |
|
12,750
|
| Weighted average remaining contractual life (in years) |
7 years 6 months 18 days
|
|
| Weighted average exercise price outstanding, beginning |
|
$ 27.71
|
| Number of options exercisable |
|
0
|
| Exercise price range |
27.01 - 27.71
|
|
| Option Total |
|
|
| Number of options outstanding |
|
76,750
|
| Weighted average remaining contractual life (in years) |
6 years 1 month 28 days
|
|
| Weighted average exercise price outstanding, beginning |
|
$ 20.88
|
| Number of options exercisable |
|
41,500
|
| X |
- References
+ Details
| Name: |
isdr_ExercisePriceRange |
| Namespace Prefix: |
isdr_ |
| Data Type: |
xbrli:stringItemType |
| Balance Type: |
na |
| Period Type: |
duration |
|
| X |
- DefinitionThe number of shares into which fully or partially vested stock options outstanding as of the balance sheet date can be currently converted under the option plan. Reference 1: http://www.xbrl.org/2003/role/disclosureRef
-Topic 718
-SubTopic 10
-Name Accounting Standards Codification
-Section 50
-Paragraph 2
-Subparagraph (c)(1)(iii)
-Publisher FASB
-URI https://asc.fasb.org/1943274/2147480429/718-10-50-2
| Name: |
us-gaap_ShareBasedCompensationArrangementByShareBasedPaymentAwardOptionsExercisableNumber |
| Namespace Prefix: |
us-gaap_ |
| Data Type: |
xbrli:sharesItemType |
| Balance Type: |
na |
| Period Type: |
instant |
|
| X |
- DefinitionNumber of options outstanding, including both vested and non-vested options. Reference 1: http://www.xbrl.org/2003/role/disclosureRef
-Topic 718
-SubTopic 10
-Name Accounting Standards Codification
-Section 50
-Paragraph 2
-Subparagraph (c)(1)(i)
-Publisher FASB
-URI https://asc.fasb.org/1943274/2147480429/718-10-50-2
Reference 2: http://www.xbrl.org/2003/role/disclosureRef
-Topic 718
-SubTopic 10
-Name Accounting Standards Codification
-Section 50
-Paragraph 2
-Subparagraph (c)(1)(ii)
-Publisher FASB
-URI https://asc.fasb.org/1943274/2147480429/718-10-50-2
| Name: |
us-gaap_ShareBasedCompensationArrangementByShareBasedPaymentAwardOptionsOutstandingNumber |
| Namespace Prefix: |
us-gaap_ |
| Data Type: |
xbrli:sharesItemType |
| Balance Type: |
na |
| Period Type: |
instant |
|
| X |
- DefinitionWeighted average price at which grantees can acquire the shares reserved for issuance under the stock option plan. Reference 1: http://www.xbrl.org/2003/role/disclosureRef
-Topic 718
-SubTopic 10
-Name Accounting Standards Codification
-Section 50
-Paragraph 2
-Subparagraph (c)(1)(i)
-Publisher FASB
-URI https://asc.fasb.org/1943274/2147480429/718-10-50-2
Reference 2: http://www.xbrl.org/2003/role/disclosureRef
-Topic 718
-SubTopic 10
-Name Accounting Standards Codification
-Section 50
-Paragraph 2
-Subparagraph (c)(1)(ii)
-Publisher FASB
-URI https://asc.fasb.org/1943274/2147480429/718-10-50-2
| Name: |
us-gaap_ShareBasedCompensationArrangementByShareBasedPaymentAwardOptionsOutstandingWeightedAverageExercisePrice |
| Namespace Prefix: |
us-gaap_ |
| Data Type: |
dtr-types:perShareItemType |
| Balance Type: |
na |
| Period Type: |
instant |
|
| X |
- DefinitionWeighted average remaining contractual term for option awards outstanding, in 'PnYnMnDTnHnMnS' format, for example, 'P1Y5M13D' represents the reported fact of one year, five months, and thirteen days. Reference 1: http://fasb.org/us-gaap/role/ref/legacyRef
-Topic 718
-SubTopic 10
-Subparagraph (e)(1)
-Name Accounting Standards Codification
-Paragraph 2
-Section 50
-Publisher FASB
-URI https://asc.fasb.org/1943274/2147480429/718-10-50-2
| Name: |
us-gaap_SharebasedCompensationArrangementBySharebasedPaymentAwardOptionsOutstandingWeightedAverageRemainingContractualTerm2 |
| Namespace Prefix: |
us-gaap_ |
| Data Type: |
xbrli:durationItemType |
| Balance Type: |
na |
| Period Type: |
duration |
|
| X |
- Details
| Name: |
us-gaap_ShareBasedCompensationSharesAuthorizedUnderStockOptionPlansByExercisePriceRangeAxis=isdr_StockOptionOneMember |
| Namespace Prefix: |
|
| Data Type: |
na |
| Balance Type: |
|
| Period Type: |
|
|
| X |
- Details
| Name: |
us-gaap_ShareBasedCompensationSharesAuthorizedUnderStockOptionPlansByExercisePriceRangeAxis=isdr_StockOptionTwoMember |
| Namespace Prefix: |
|
| Data Type: |
na |
| Balance Type: |
|
| Period Type: |
|
|
| X |
- Details
| Name: |
us-gaap_ShareBasedCompensationSharesAuthorizedUnderStockOptionPlansByExercisePriceRangeAxis=isdr_StockOptionThreeMember |
| Namespace Prefix: |
|
| Data Type: |
na |
| Balance Type: |
|
| Period Type: |
|
|
| X |
- Details
| Name: |
us-gaap_ShareBasedCompensationSharesAuthorizedUnderStockOptionPlansByExercisePriceRangeAxis=isdr_StockOptionFourMember |
| Namespace Prefix: |
|
| Data Type: |
na |
| Balance Type: |
|
| Period Type: |
|
|
| X |
- Details
| Name: |
us-gaap_ShareBasedCompensationSharesAuthorizedUnderStockOptionPlansByExercisePriceRangeAxis=isdr_StockOptionFiveMember |
| Namespace Prefix: |
|
| Data Type: |
na |
| Balance Type: |
|
| Period Type: |
|
|
| X |
- Details
| Name: |
us-gaap_ShareBasedCompensationSharesAuthorizedUnderStockOptionPlansByExercisePriceRangeAxis=isdr_StockOptionTotalMember |
| Namespace Prefix: |
|
| Data Type: |
na |
| Balance Type: |
|
| Period Type: |
|
|
v3.24.2.u1
Equity (Details Narrative) - USD ($)
|
|
1 Months Ended |
3 Months Ended |
6 Months Ended |
Jun. 10, 2016 |
Jun. 17, 2020 |
Jun. 30, 2024 |
Jun. 30, 2023 |
Jun. 30, 2024 |
Jun. 30, 2023 |
| Shares Available For Grant |
|
|
105,076
|
|
105,076
|
|
| Number of restricted stock units granted |
|
|
6,000
|
14,332
|
32,500
|
74,732
|
| Restricted stock units vested year |
|
|
|
|
3 years
|
|
| Grant date fair value |
|
|
$ 9.70
|
$ 18.70
|
$ 13.91
|
$ 26.08
|
| Number of restricted stock units vested/issued |
|
|
14,332
|
|
16,499
|
|
| Weighted average exercise price average intrinsic value |
|
|
$ 18.70
|
|
$ 19.95
|
|
| Unrecognized compensation expense, restricted stock units |
|
|
$ 291,000
|
|
$ 291,000
|
|
| Unvested Restricted Stock Units [Member] |
|
|
|
|
|
|
| Unrecognized compensation expense, restricted stock units |
|
|
$ 1,143,000
|
|
$ 1,143,000
|
|
| 2014 Plan |
|
|
|
|
|
|
| Shares Available For Grant |
|
|
105,076
|
|
105,076
|
|
| Shares issued incentive awards for common stock |
|
|
|
|
200,000
|
|
| Additional Awards |
200,000
|
200,000
|
|
|
|
|
| Total Number Of Shares To Be Awarded |
|
|
|
|
600,000
|
|
| 2023 Plan |
|
|
|
|
|
|
| Shares Available For Grant |
|
|
358,244
|
|
358,244
|
|
| Shares issued incentive awards for common stock |
|
|
|
|
300,000
|
|
| X |
- References
+ Details
| Name: |
isdr_GrantDateFairValue |
| Namespace Prefix: |
isdr_ |
| Data Type: |
num:perShareItemType |
| Balance Type: |
na |
| Period Type: |
duration |
|
| X |
- References
+ Details
| Name: |
isdr_ShareBasedCompensationArrangementsByShareBasedPaymentAwardEquityInstrumentsOtherThanOptionsVestedInPeriodWeightedAverageIntrinsicValue |
| Namespace Prefix: |
isdr_ |
| Data Type: |
num:perShareItemType |
| Balance Type: |
na |
| Period Type: |
duration |
|
| X |
- References
+ Details
| Name: |
isdr_StockIssuedDuringPeriodForIncentiveAawardsOfCommonStock |
| Namespace Prefix: |
isdr_ |
| Data Type: |
xbrli:sharesItemType |
| Balance Type: |
na |
| Period Type: |
duration |
|
| X |
- References
+ Details
| Name: |
isdr_VestedNumberOfYearRestrictedStock |
| Namespace Prefix: |
isdr_ |
| Data Type: |
xbrli:durationItemType |
| Balance Type: |
na |
| Period Type: |
duration |
|
| X |
- DefinitionAmount of cost to be recognized for nonvested award under share-based payment arrangement. Excludes share and unit options. Reference 1: http://www.xbrl.org/2009/role/commonPracticeRef
-Topic 718
-SubTopic 10
-Name Accounting Standards Codification
-Section 50
-Paragraph 2
-Subparagraph (i)
-Publisher FASB
-URI https://asc.fasb.org/1943274/2147480429/718-10-50-2
| Name: |
us-gaap_EmployeeServiceShareBasedCompensationNonvestedAwardsTotalCompensationCostNotYetRecognizedShareBasedAwardsOtherThanOptions |
| Namespace Prefix: |
us-gaap_ |
| Data Type: |
xbrli:monetaryItemType |
| Balance Type: |
debit |
| Period Type: |
instant |
|
| X |
- DefinitionThe number of grants made during the period on other than stock (or unit) option plans (for example, phantom stock or unit plan, stock or unit appreciation rights plan, performance target plan). Reference 1: http://www.xbrl.org/2003/role/disclosureRef
-Topic 718
-SubTopic 10
-Name Accounting Standards Codification
-Section 50
-Paragraph 2
-Subparagraph (c)(2)(iii)(01)
-Publisher FASB
-URI https://asc.fasb.org/1943274/2147480429/718-10-50-2
| Name: |
us-gaap_ShareBasedCompensationArrangementByShareBasedPaymentAwardEquityInstrumentsOtherThanOptionsGrantsInPeriod |
| Namespace Prefix: |
us-gaap_ |
| Data Type: |
xbrli:sharesItemType |
| Balance Type: |
na |
| Period Type: |
duration |
|
| X |
- DefinitionThe number of equity-based payment instruments, excluding stock (or unit) options, that vested during the reporting period. Reference 1: http://www.xbrl.org/2003/role/disclosureRef
-Topic 718
-SubTopic 10
-Name Accounting Standards Codification
-Section 50
-Paragraph 2
-Subparagraph (c)(2)(iii)(02)
-Publisher FASB
-URI https://asc.fasb.org/1943274/2147480429/718-10-50-2
| Name: |
us-gaap_ShareBasedCompensationArrangementByShareBasedPaymentAwardEquityInstrumentsOtherThanOptionsVestedInPeriod |
| Namespace Prefix: |
us-gaap_ |
| Data Type: |
xbrli:sharesItemType |
| Balance Type: |
na |
| Period Type: |
duration |
|
| X |
- DefinitionThe difference between the maximum number of shares (or other type of equity) authorized for issuance under the plan (including the effects of amendments and adjustments), and the sum of: 1) the number of shares (or other type of equity) already issued upon exercise of options or other equity-based awards under the plan; and 2) shares (or other type of equity) reserved for issuance on granting of outstanding awards, net of cancellations and forfeitures, if applicable. Reference 1: http://fasb.org/us-gaap/role/ref/legacyRef
-Name Accounting Standards Codification
-Topic 718
-SubTopic 10
-Section 50
-Paragraph 2
-Publisher FASB
-URI https://asc.fasb.org/1943274/2147480429/718-10-50-2
| Name: |
us-gaap_ShareBasedCompensationArrangementByShareBasedPaymentAwardNumberOfSharesAvailableForGrant |
| Namespace Prefix: |
us-gaap_ |
| Data Type: |
xbrli:sharesItemType |
| Balance Type: |
na |
| Period Type: |
instant |
|
| X |
- DefinitionNumber of shares of stock issued attributable to transactions classified as other.
| Name: |
us-gaap_StockIssuedDuringPeriodSharesOther |
| Namespace Prefix: |
us-gaap_ |
| Data Type: |
xbrli:sharesItemType |
| Balance Type: |
na |
| Period Type: |
duration |
|
| X |
- DefinitionTotal number of shares issued during the period, including shares forfeited, as a result of Restricted Stock Awards. Reference 1: http://fasb.org/us-gaap/role/ref/legacyRef
-Name Accounting Standards Codification
-Section 50
-Paragraph 2
-SubTopic 10
-Topic 505
-Publisher FASB
-URI https://asc.fasb.org/1943274/2147481112/505-10-50-2
Reference 2: http://fasb.org/us-gaap/role/ref/legacyRef
-Topic 505
-SubTopic 10
-Name Accounting Standards Codification
-Section S99
-Paragraph 1
-Subparagraph (SX 210.3-04)
-Publisher FASB
-URI https://asc.fasb.org/1943274/2147480008/505-10-S99-1
| Name: |
us-gaap_StockIssuedDuringPeriodSharesRestrictedStockAwardGross |
| Namespace Prefix: |
us-gaap_ |
| Data Type: |
xbrli:sharesItemType |
| Balance Type: |
na |
| Period Type: |
duration |
|
| X |
- Details
| Name: |
us-gaap_FinancialInstrumentAxis=isdr_UnvestedRestrictedStockMember |
| Namespace Prefix: |
|
| Data Type: |
na |
| Balance Type: |
|
| Period Type: |
|
|
| X |
- Details
| Name: |
us-gaap_PlanNameAxis=isdr_TwentyFourteenPlanMember |
| Namespace Prefix: |
|
| Data Type: |
na |
| Balance Type: |
|
| Period Type: |
|
|
| X |
- Details
| Name: |
us-gaap_PlanNameAxis=isdr_TwentyTwentyThreePlanMember |
| Namespace Prefix: |
|
| Data Type: |
na |
| Balance Type: |
|
| Period Type: |
|
|
v3.24.2.u1
v3.24.2.u1
| X |
- DefinitionAmount of lease cost recognized by lessee for lease contract. Reference 1: http://www.xbrl.org/2003/role/exampleRef
-Topic 842
-SubTopic 20
-Name Accounting Standards Codification
-Section 55
-Paragraph 53
-Publisher FASB
-URI https://asc.fasb.org/1943274/2147479589/842-20-55-53
Reference 2: http://www.xbrl.org/2003/role/disclosureRef
-Topic 842
-SubTopic 20
-Name Accounting Standards Codification
-Section 50
-Paragraph 4
-Publisher FASB
-URI https://asc.fasb.org/1943274/2147478964/842-20-50-4
| Name: |
us-gaap_LeaseCost |
| Namespace Prefix: |
us-gaap_ |
| Data Type: |
xbrli:monetaryItemType |
| Balance Type: |
debit |
| Period Type: |
duration |
|
| X |
- References
+ Details
| Name: |
us-gaap_LeasesAbstract |
| Namespace Prefix: |
us-gaap_ |
| Data Type: |
xbrli:stringItemType |
| Balance Type: |
na |
| Period Type: |
duration |
|
| X |
- DefinitionAmount of operating lease expense. Excludes sublease income. Reference 1: http://www.xbrl.org/2009/role/commonPracticeRef
-Topic 842
-SubTopic 20
-Name Accounting Standards Codification
-Section 45
-Paragraph 4
-Subparagraph (b)
-Publisher FASB
-URI https://asc.fasb.org/1943274/2147479041/842-20-45-4
| Name: |
us-gaap_OperatingLeaseExpense |
| Namespace Prefix: |
us-gaap_ |
| Data Type: |
xbrli:monetaryItemType |
| Balance Type: |
debit |
| Period Type: |
duration |
|
| X |
- DefinitionAmount of variable lease cost, excluded from lease liability, recognized when obligation for payment is incurred for finance and operating leases. Reference 1: http://www.xbrl.org/2003/role/exampleRef
-Topic 842
-SubTopic 20
-Name Accounting Standards Codification
-Section 55
-Paragraph 53
-Publisher FASB
-URI https://asc.fasb.org/1943274/2147479589/842-20-55-53
Reference 2: http://www.xbrl.org/2003/role/disclosureRef
-Topic 842
-SubTopic 20
-Name Accounting Standards Codification
-Section 50
-Paragraph 4
-Subparagraph (d)
-Publisher FASB
-URI https://asc.fasb.org/1943274/2147478964/842-20-50-4
| Name: |
us-gaap_VariableLeaseCost |
| Namespace Prefix: |
us-gaap_ |
| Data Type: |
xbrli:monetaryItemType |
| Balance Type: |
debit |
| Period Type: |
duration |
|
v3.24.2.u1
Leases (Details 1)
|
Jun. 30, 2024
USD ($)
|
| Leases |
|
| 2024 |
$ 191,000
|
| 2025 |
390,000
|
| 2026 |
401,000
|
| 2027 |
412,000
|
| Total Lease Payments |
1,394,000
|
| Present Value Adjustment |
(170,000)
|
| Lease Liability |
$ 1,224,000
|
| X |
- References
+ Details
| Name: |
us-gaap_LeasesAbstract |
| Namespace Prefix: |
us-gaap_ |
| Data Type: |
xbrli:stringItemType |
| Balance Type: |
na |
| Period Type: |
duration |
|
| X |
- DefinitionAmount of lessee's undiscounted obligation for lease payment for operating lease. Reference 1: http://www.xbrl.org/2003/role/disclosureRef
-Topic 842
-SubTopic 20
-Name Accounting Standards Codification
-Section 50
-Paragraph 6
-Publisher FASB
-URI https://asc.fasb.org/1943274/2147478964/842-20-50-6
| Name: |
us-gaap_LesseeOperatingLeaseLiabilityPaymentsDue |
| Namespace Prefix: |
us-gaap_ |
| Data Type: |
xbrli:monetaryItemType |
| Balance Type: |
credit |
| Period Type: |
instant |
|
| X |
- DefinitionAmount of lessee's undiscounted obligation for lease payment for operating lease to be paid in fourth fiscal year following current fiscal year. Excludes interim and annual periods when interim periods are reported from current statement of financial position date (rolling approach). Reference 1: http://www.xbrl.org/2003/role/disclosureRef
-Topic 842
-SubTopic 20
-Name Accounting Standards Codification
-Section 50
-Paragraph 6
-Publisher FASB
-URI https://asc.fasb.org/1943274/2147478964/842-20-50-6
| Name: |
us-gaap_LesseeOperatingLeaseLiabilityPaymentsDueYearFour |
| Namespace Prefix: |
us-gaap_ |
| Data Type: |
xbrli:monetaryItemType |
| Balance Type: |
credit |
| Period Type: |
instant |
|
| X |
- DefinitionAmount of lessee's undiscounted obligation for lease payment for operating lease to be paid in third fiscal year following current fiscal year. Excludes interim and annual periods when interim periods are reported from current statement of financial position date (rolling approach). Reference 1: http://www.xbrl.org/2003/role/disclosureRef
-Topic 842
-SubTopic 20
-Name Accounting Standards Codification
-Section 50
-Paragraph 6
-Publisher FASB
-URI https://asc.fasb.org/1943274/2147478964/842-20-50-6
| Name: |
us-gaap_LesseeOperatingLeaseLiabilityPaymentsDueYearThree |
| Namespace Prefix: |
us-gaap_ |
| Data Type: |
xbrli:monetaryItemType |
| Balance Type: |
credit |
| Period Type: |
instant |
|
| X |
- DefinitionAmount of lessee's undiscounted obligation for lease payment for operating lease to be paid in second fiscal year following current fiscal year. Excludes interim and annual periods when interim periods are reported from current statement of financial position date (rolling approach). Reference 1: http://www.xbrl.org/2003/role/disclosureRef
-Topic 842
-SubTopic 20
-Name Accounting Standards Codification
-Section 50
-Paragraph 6
-Publisher FASB
-URI https://asc.fasb.org/1943274/2147478964/842-20-50-6
| Name: |
us-gaap_LesseeOperatingLeaseLiabilityPaymentsDueYearTwo |
| Namespace Prefix: |
us-gaap_ |
| Data Type: |
xbrli:monetaryItemType |
| Balance Type: |
credit |
| Period Type: |
instant |
|
| X |
- DefinitionAmount of lessee's undiscounted obligation for lease payment for operating lease having initial or remaining lease term in excess of one year to be paid in remainder of current fiscal year. Reference 1: http://www.xbrl.org/2009/role/commonPracticeRef
-Topic 842
-SubTopic 20
-Name Accounting Standards Codification
-Section 50
-Paragraph 6
-Publisher FASB
-URI https://asc.fasb.org/1943274/2147478964/842-20-50-6
| Name: |
us-gaap_LesseeOperatingLeaseLiabilityPaymentsRemainderOfFiscalYear |
| Namespace Prefix: |
us-gaap_ |
| Data Type: |
xbrli:monetaryItemType |
| Balance Type: |
credit |
| Period Type: |
instant |
|
| X |
- DefinitionAmount of lessee's undiscounted obligation for lease payments in excess of discounted obligation for lease payments for operating lease. Reference 1: http://www.xbrl.org/2003/role/disclosureRef
-Topic 842
-SubTopic 20
-Name Accounting Standards Codification
-Section 50
-Paragraph 6
-Publisher FASB
-URI https://asc.fasb.org/1943274/2147478964/842-20-50-6
| Name: |
us-gaap_LesseeOperatingLeaseLiabilityUndiscountedExcessAmount |
| Namespace Prefix: |
us-gaap_ |
| Data Type: |
xbrli:monetaryItemType |
| Balance Type: |
credit |
| Period Type: |
instant |
|
| X |
- DefinitionPresent value of lessee's discounted obligation for lease payments from operating lease. Reference 1: http://www.xbrl.org/2003/role/disclosureRef
-Topic 842
-SubTopic 20
-Name Accounting Standards Codification
-Section 45
-Paragraph 1
-Subparagraph (b)
-Publisher FASB
-URI https://asc.fasb.org/1943274/2147479041/842-20-45-1
| Name: |
us-gaap_OperatingLeaseLiability |
| Namespace Prefix: |
us-gaap_ |
| Data Type: |
xbrli:monetaryItemType |
| Balance Type: |
credit |
| Period Type: |
instant |
|
v3.24.2.u1
Leases (Details Narrative) - USD ($)
|
6 Months Ended |
|
Jun. 30, 2024 |
Dec. 31, 2023 |
| Lease Liability, Current Portion |
$ 384,000
|
|
| Weighted Average Non Cancelable Lease Term |
3 years 6 months
|
|
| Weighted-average Discount Rate |
3.77%
|
|
| Lease Liability, Long term portion |
$ 840,000
|
$ 1,009,000
|
| Operating Lease Liability, Total |
1,224,000
|
|
| March 2019 |
|
|
| Lease Liability, Current Portion |
$ 2,596,000
|
|
| Expiry Of Lease |
Dec. 31, 2027
|
|
| Lease Payments |
$ 2,997,000
|
|
| Improvment Allowance Of Lease Payments |
$ 488,000
|
|
| Minimum lease payments discounted |
3.77%
|
|
| X |
- References
+ Details
| Name: |
isdr_MinimumLeasePaymentsDiscounted |
| Namespace Prefix: |
isdr_ |
| Data Type: |
num:percentItemType |
| Balance Type: |
na |
| Period Type: |
instant |
|
| X |
- References
+ Details
| Name: |
isdr_WeightedAverageNonCancelableLeaseTerm |
| Namespace Prefix: |
isdr_ |
| Data Type: |
xbrli:durationItemType |
| Balance Type: |
na |
| Period Type: |
duration |
|
| X |
- DefinitionDate which lease or group of leases is set to expire, in YYYY-MM-DD format.
| Name: |
us-gaap_LeaseExpirationDate1 |
| Namespace Prefix: |
us-gaap_ |
| Data Type: |
xbrli:dateItemType |
| Balance Type: |
na |
| Period Type: |
duration |
|
| X |
- DefinitionPresent value of lessee's discounted obligation for lease payments from operating lease. Reference 1: http://www.xbrl.org/2003/role/disclosureRef
-Topic 842
-SubTopic 20
-Name Accounting Standards Codification
-Section 45
-Paragraph 1
-Subparagraph (b)
-Publisher FASB
-URI https://asc.fasb.org/1943274/2147479041/842-20-45-1
| Name: |
us-gaap_OperatingLeaseLiability |
| Namespace Prefix: |
us-gaap_ |
| Data Type: |
xbrli:monetaryItemType |
| Balance Type: |
credit |
| Period Type: |
instant |
|
| X |
- DefinitionPresent value of lessee's discounted obligation for lease payments from operating lease, classified as current. Reference 1: http://www.xbrl.org/2003/role/disclosureRef
-Topic 842
-SubTopic 20
-Name Accounting Standards Codification
-Section 45
-Paragraph 1
-Subparagraph (b)
-Publisher FASB
-URI https://asc.fasb.org/1943274/2147479041/842-20-45-1
| Name: |
us-gaap_OperatingLeaseLiabilityCurrent |
| Namespace Prefix: |
us-gaap_ |
| Data Type: |
xbrli:monetaryItemType |
| Balance Type: |
credit |
| Period Type: |
instant |
|
| X |
- DefinitionPresent value of lessee's discounted obligation for lease payments from operating lease, classified as noncurrent. Reference 1: http://www.xbrl.org/2003/role/disclosureRef
-Topic 842
-SubTopic 20
-Name Accounting Standards Codification
-Section 45
-Paragraph 1
-Subparagraph (b)
-Publisher FASB
-URI https://asc.fasb.org/1943274/2147479041/842-20-45-1
| Name: |
us-gaap_OperatingLeaseLiabilityNoncurrent |
| Namespace Prefix: |
us-gaap_ |
| Data Type: |
xbrli:monetaryItemType |
| Balance Type: |
credit |
| Period Type: |
instant |
|
| X |
- DefinitionAmount of cash outflow from operating lease, excluding payments to bring another asset to condition and location necessary for its intended use. Reference 1: http://www.xbrl.org/2003/role/disclosureRef
-Topic 842
-SubTopic 20
-Name Accounting Standards Codification
-Section 45
-Paragraph 5
-Subparagraph (c)
-Publisher FASB
-URI https://asc.fasb.org/1943274/2147479041/842-20-45-5
Reference 2: http://www.xbrl.org/2003/role/disclosureRef
-Topic 842
-SubTopic 20
-Name Accounting Standards Codification
-Section 50
-Paragraph 4
-Subparagraph (g)(1)
-Publisher FASB
-URI https://asc.fasb.org/1943274/2147478964/842-20-50-4
| Name: |
us-gaap_OperatingLeasePayments |
| Namespace Prefix: |
us-gaap_ |
| Data Type: |
xbrli:monetaryItemType |
| Balance Type: |
credit |
| Period Type: |
duration |
|
| X |
- DefinitionWeighted average discount rate for operating lease calculated at point in time. Reference 1: http://www.xbrl.org/2003/role/exampleRef
-Topic 842
-SubTopic 20
-Name Accounting Standards Codification
-Section 55
-Paragraph 53
-Publisher FASB
-URI https://asc.fasb.org/1943274/2147479589/842-20-55-53
Reference 2: http://www.xbrl.org/2003/role/disclosureRef
-Topic 842
-SubTopic 20
-Name Accounting Standards Codification
-Section 50
-Paragraph 4
-Subparagraph (g)(4)
-Publisher FASB
-URI https://asc.fasb.org/1943274/2147478964/842-20-50-4
| Name: |
us-gaap_OperatingLeaseWeightedAverageDiscountRatePercent |
| Namespace Prefix: |
us-gaap_ |
| Data Type: |
dtr-types:percentItemType |
| Balance Type: |
na |
| Period Type: |
instant |
|
| X |
- DefinitionThe cash outflow for acquisition of or capital improvements to properties held for investment (operating, managed, leased) or for use. Reference 1: http://fasb.org/us-gaap/role/ref/legacyRef
-Topic 230
-SubTopic 10
-Name Accounting Standards Codification
-Section 45
-Paragraph 13
-Subparagraph (c)
-Publisher FASB
-URI https://asc.fasb.org/1943274/2147482740/230-10-45-13
| Name: |
us-gaap_PaymentsForCapitalImprovements |
| Namespace Prefix: |
us-gaap_ |
| Data Type: |
xbrli:monetaryItemType |
| Balance Type: |
credit |
| Period Type: |
duration |
|
| X |
- Details
| Name: |
us-gaap_AwardDateAxis=isdr_MarchTwentyNineteenMember |
| Namespace Prefix: |
|
| Data Type: |
na |
| Balance Type: |
|
| Period Type: |
|
|
v3.24.2.u1
Revenue (Details) - USD ($)
$ in Thousands |
3 Months Ended |
6 Months Ended |
Jun. 30, 2024 |
Jun. 30, 2023 |
Jun. 30, 2024 |
Jun. 30, 2023 |
| Revenues |
$ 7,687
|
$ 9,651
|
$ 14,649
|
$ 18,270
|
| Percentage Of Revenue From Revenue Streams |
100.00%
|
100.00%
|
100.00%
|
100.00%
|
| Communication [Member] |
|
|
|
|
| Revenues |
$ 5,944
|
$ 5,936
|
$ 11,403
|
$ 12,502
|
| Percentage Of Revenue From Revenue Streams |
77.30%
|
61.50%
|
77.80%
|
68.40%
|
| Compliance [Member] |
|
|
|
|
| Revenues |
$ 1,743
|
$ 3,715
|
$ 3,246
|
$ 5,768
|
| Percentage Of Revenue From Revenue Streams |
22.70%
|
38.50%
|
22.20%
|
31.60%
|
| X |
- References
+ Details
| Name: |
isdr_ConcentrationRisksPercentage1 |
| Namespace Prefix: |
isdr_ |
| Data Type: |
num:percentItemType |
| Balance Type: |
na |
| Period Type: |
duration |
|
| X |
- DefinitionAmount of revenue recognized from goods sold, services rendered, insurance premiums, or other activities that constitute an earning process. Includes, but is not limited to, investment and interest income before deduction of interest expense when recognized as a component of revenue, and sales and trading gain (loss). Reference 1: http://www.xbrl.org/2003/role/exampleRef
-Topic 280
-SubTopic 10
-Name Accounting Standards Codification
-Section 55
-Paragraph 48
-Publisher FASB
-URI https://asc.fasb.org/1943274/2147482785/280-10-55-48
Reference 2: http://www.xbrl.org/2003/role/disclosureRef
-Topic 280
-SubTopic 10
-Name Accounting Standards Codification
-Section 50
-Paragraph 41
-Subparagraph (a)
-Publisher FASB
-URI https://asc.fasb.org/1943274/2147482810/280-10-50-41
Reference 3: http://www.xbrl.org/2003/role/disclosureRef
-Topic 270
-SubTopic 10
-Name Accounting Standards Codification
-Section 50
-Paragraph 1
-Subparagraph (i)
-Publisher FASB
-URI https://asc.fasb.org/1943274/2147482964/270-10-50-1
Reference 4: http://www.xbrl.org/2003/role/disclosureRef
-Topic 280
-SubTopic 10
-Name Accounting Standards Codification
-Section 50
-Paragraph 32
-Subparagraph (ee)
-Publisher FASB
-URI https://asc.fasb.org/1943274/2147482810/280-10-50-32
Reference 5: http://fasb.org/us-gaap/role/ref/otherTransitionRef
-Topic 280
-SubTopic 10
-Name Accounting Standards Codification
-Section 50
-Paragraph 32
-Subparagraph (b)
-Publisher FASB
-URI https://asc.fasb.org/1943274/2147482810/280-10-50-32
Reference 6: http://fasb.org/us-gaap/role/ref/otherTransitionRef
-Topic 280
-SubTopic 10
-Name Accounting Standards Codification
-Section 50
-Paragraph 32
-Subparagraph (a)
-Publisher FASB
-URI https://asc.fasb.org/1943274/2147482810/280-10-50-32
Reference 7: http://www.xbrl.org/2003/role/disclosureRef
-Topic 235
-SubTopic 10
-Name Accounting Standards Codification
-Section S99
-Paragraph 1
-Subparagraph (SX 210.4-08(g)(1)(ii))
-Publisher FASB
-URI https://asc.fasb.org/1943274/2147480678/235-10-S99-1
Reference 8: http://www.xbrl.org/2003/role/disclosureRef
-Topic 323
-SubTopic 10
-Name Accounting Standards Codification
-Section 50
-Paragraph 3
-Subparagraph (c)
-Publisher FASB
-URI https://asc.fasb.org/1943274/2147481687/323-10-50-3
Reference 9: http://www.xbrl.org/2003/role/disclosureRef
-Topic 825
-SubTopic 10
-Name Accounting Standards Codification
-Section 50
-Paragraph 28
-Subparagraph (f)
-Publisher FASB
-URI https://asc.fasb.org/1943274/2147482907/825-10-50-28
Reference 10: http://www.xbrl.org/2003/role/disclosureRef
-Topic 470
-SubTopic 10
-Name Accounting Standards Codification
-Section S99
-Paragraph 1A
-Subparagraph (SX 210.13-01(a)(4)(i))
-Publisher FASB
-URI https://asc.fasb.org/1943274/2147480097/470-10-S99-1A
Reference 11: http://www.xbrl.org/2009/role/commonPracticeRef
-Topic 470
-SubTopic 10
-Name Accounting Standards Codification
-Section S99
-Paragraph 1A
-Subparagraph (SX 210.13-01(a)(4)(ii))
-Publisher FASB
-URI https://asc.fasb.org/1943274/2147480097/470-10-S99-1A
Reference 12: http://www.xbrl.org/2003/role/disclosureRef
-Topic 470
-SubTopic 10
-Name Accounting Standards Codification
-Section S99
-Paragraph 1A
-Subparagraph (SX 210.13-01(a)(4)(iii)(A))
-Publisher FASB
-URI https://asc.fasb.org/1943274/2147480097/470-10-S99-1A
Reference 13: http://www.xbrl.org/2003/role/disclosureRef
-Topic 470
-SubTopic 10
-Name Accounting Standards Codification
-Section S99
-Paragraph 1A
-Subparagraph (SX 210.13-01(a)(4)(iv))
-Publisher FASB
-URI https://asc.fasb.org/1943274/2147480097/470-10-S99-1A
Reference 14: http://www.xbrl.org/2003/role/disclosureRef
-Topic 470
-SubTopic 10
-Name Accounting Standards Codification
-Section S99
-Paragraph 1A
-Subparagraph (SX 210.13-01(a)(5))
-Publisher FASB
-URI https://asc.fasb.org/1943274/2147480097/470-10-S99-1A
Reference 15: http://www.xbrl.org/2003/role/disclosureRef
-Topic 470
-SubTopic 10
-Name Accounting Standards Codification
-Section S99
-Paragraph 1B
-Subparagraph (SX 210.13-02(a)(4)(i))
-Publisher FASB
-URI https://asc.fasb.org/1943274/2147480097/470-10-S99-1B
Reference 16: http://www.xbrl.org/2003/role/disclosureRef
-Topic 470
-SubTopic 10
-Name Accounting Standards Codification
-Section S99
-Paragraph 1B
-Subparagraph (SX 210.13-02(a)(4)(iii)(A))
-Publisher FASB
-URI https://asc.fasb.org/1943274/2147480097/470-10-S99-1B
Reference 17: http://www.xbrl.org/2003/role/disclosureRef
-Topic 470
-SubTopic 10
-Name Accounting Standards Codification
-Section S99
-Paragraph 1B
-Subparagraph (SX 210.13-02(a)(4)(iii)(B))
-Publisher FASB
-URI https://asc.fasb.org/1943274/2147480097/470-10-S99-1B
Reference 18: http://www.xbrl.org/2003/role/disclosureRef
-Topic 470
-SubTopic 10
-Name Accounting Standards Codification
-Section S99
-Paragraph 1B
-Subparagraph (SX 210.13-02(a)(4)(iv))
-Publisher FASB
-URI https://asc.fasb.org/1943274/2147480097/470-10-S99-1B
Reference 19: http://www.xbrl.org/2003/role/disclosureRef
-Topic 470
-SubTopic 10
-Name Accounting Standards Codification
-Section S99
-Paragraph 1B
-Subparagraph (SX 210.13-02(a)(5))
-Publisher FASB
-URI https://asc.fasb.org/1943274/2147480097/470-10-S99-1B
Reference 20: http://www.xbrl.org/2003/role/disclosureRef
-Topic 280
-SubTopic 10
-Name Accounting Standards Codification
-Section 50
-Paragraph 30
-Subparagraph (a)
-Publisher FASB
-URI https://asc.fasb.org/1943274/2147482810/280-10-50-30
Reference 21: http://www.xbrl.org/2003/role/disclosureRef
-Topic 280
-SubTopic 10
-Name Accounting Standards Codification
-Section 50
-Paragraph 42
-Publisher FASB
-URI https://asc.fasb.org/1943274/2147482810/280-10-50-42
Reference 22: http://www.xbrl.org/2003/role/disclosureRef
-Topic 280
-SubTopic 10
-Name Accounting Standards Codification
-Section 50
-Paragraph 22
-Subparagraph (b)
-Publisher FASB
-URI https://asc.fasb.org/1943274/2147482810/280-10-50-22
Reference 23: http://www.xbrl.org/2003/role/disclosureRef
-Topic 280
-SubTopic 10
-Name Accounting Standards Codification
-Section 50
-Paragraph 40
-Publisher FASB
-URI https://asc.fasb.org/1943274/2147482810/280-10-50-40
Reference 24: http://www.xbrl.org/2003/role/disclosureRef
-Topic 280
-SubTopic 10
-Name Accounting Standards Codification
-Section 50
-Paragraph 22
-Subparagraph (a)
-Publisher FASB
-URI https://asc.fasb.org/1943274/2147482810/280-10-50-22
Reference 25: http://www.xbrl.org/2003/role/disclosureRef
-Topic 942
-SubTopic 235
-Name Accounting Standards Codification
-Section S99
-Paragraph 1
-Subparagraph (SX 210.9-05(b)(2))
-Publisher FASB
-URI https://asc.fasb.org/1943274/2147477314/942-235-S99-1
Reference 26: http://www.xbrl.org/2003/role/disclosureRef
-Topic 220
-SubTopic 10
-Name Accounting Standards Codification
-Section S99
-Paragraph 2
-Subparagraph (SX 210.5-03(1))
-Publisher FASB
-URI https://asc.fasb.org/1943274/2147483621/220-10-S99-2
| Name: |
us-gaap_Revenues |
| Namespace Prefix: |
us-gaap_ |
| Data Type: |
xbrli:monetaryItemType |
| Balance Type: |
credit |
| Period Type: |
duration |
|
| X |
- Details
| Name: |
srt_ProductOrServiceAxis=isdr_CommunicationMember |
| Namespace Prefix: |
|
| Data Type: |
na |
| Balance Type: |
|
| Period Type: |
|
|
| X |
- Details
| Name: |
srt_ProductOrServiceAxis=isdr_ComplianceMember |
| Namespace Prefix: |
|
| Data Type: |
na |
| Balance Type: |
|
| Period Type: |
|
|
v3.24.2.u1
| X |
- References
+ Details
| Name: |
isdr_PercentageOfRevenues |
| Namespace Prefix: |
isdr_ |
| Data Type: |
num:percentItemType |
| Balance Type: |
na |
| Period Type: |
duration |
|
| X |
- Details
| Name: |
srt_MajorCustomersAxis=us-gaap_OtherCustomerMember |
| Namespace Prefix: |
|
| Data Type: |
na |
| Balance Type: |
|
| Period Type: |
|
|
v3.24.2.u1
Credit Agreement (Details narrative) - USD ($)
|
1 Months Ended |
6 Months Ended |
|
Mar. 20, 2023 |
Jun. 30, 2024 |
Jun. 01, 2024 |
| Credit Agreement |
|
|
|
| Description of credit agreement |
(i) term loan facility in an aggregate principal amount of $20 million (the “Term Loan”), and (ii) revolving line of credit in an up to aggregate principal amount of $5 million (the “Revolving LOC”), subject to an 85% limit based on the current eligible accounts receivable (as defined in the Credit Agreement)
|
the per annum interest rate of the Term Loan is variable based on the one-month secured overnight financing rate (“SOFR”) plus 2.35%, subject to a minimum SOFR of 2.00%. However, the Term Loan issued on the Closing Date has a per annum interest rate of 6.217%, which was fixed with respect to the entire principal amount as a result of an interest rate swap agreement entered into between the Company and Pinnacle on the Closing Date in accordance with the terms of the Credit Agreement
|
|
| Unrestricted liquidity |
|
|
$ 1,500,000
|
| Proceed from credit agreement |
$ 25,000,000
|
|
|
| Maturity date |
December 20, 2028
|
|
|
| Monthly principle payment |
$ 333,333
|
|
|
| Acquisition of iNewswire.com LLC |
|
$ 22,880,000
|
|
| Aggregate principal amount of the Revolving LOC |
|
1,500,000
|
|
| Payment to secured notes |
|
370,000
|
|
| Interest forgiveness |
|
440,000
|
|
| Payment for other expenss |
|
370,000
|
|
| Termination of unsecured line of credit |
|
$ 3,000,000
|
|
| X |
- References
+ Details
| Name: |
isdr_AggregatePrincipalAmountOfTheRevolvingLoc |
| Namespace Prefix: |
isdr_ |
| Data Type: |
xbrli:monetaryItemType |
| Balance Type: |
credit |
| Period Type: |
duration |
|
| X |
- References
+ Details
| Name: |
isdr_CreditAgreementAbstract |
| Namespace Prefix: |
isdr_ |
| Data Type: |
xbrli:stringItemType |
| Balance Type: |
na |
| Period Type: |
duration |
|
| X |
- References
+ Details
| Name: |
isdr_DescriptionOfCreditAgreement |
| Namespace Prefix: |
isdr_ |
| Data Type: |
xbrli:stringItemType |
| Balance Type: |
na |
| Period Type: |
duration |
|
| X |
- References
+ Details
| Name: |
isdr_MaturityDate |
| Namespace Prefix: |
isdr_ |
| Data Type: |
xbrli:stringItemType |
| Balance Type: |
na |
| Period Type: |
duration |
|
| X |
- References
+ Details
| Name: |
isdr_PaymentForOtherExpenss |
| Namespace Prefix: |
isdr_ |
| Data Type: |
xbrli:monetaryItemType |
| Balance Type: |
credit |
| Period Type: |
duration |
|
| X |
- References
+ Details
| Name: |
isdr_TerminationOfUnsecuredLineOfCredit |
| Namespace Prefix: |
isdr_ |
| Data Type: |
xbrli:monetaryItemType |
| Balance Type: |
debit |
| Period Type: |
duration |
|
| X |
- References
+ Details
| Name: |
isdr_UnrestrictedLiquidity |
| Namespace Prefix: |
isdr_ |
| Data Type: |
xbrli:monetaryItemType |
| Balance Type: |
credit |
| Period Type: |
instant |
|
| X |
- DefinitionDecrease for amounts of indebtedness forgiven by the holder of the debt instrument. Reference 1: http://www.xbrl.org/2009/role/commonPracticeRef
-Topic 235
-SubTopic 10
-Name Accounting Standards Codification
-Section S99
-Paragraph 1
-Subparagraph (SX 210.4-08(f))
-Publisher FASB
-URI https://asc.fasb.org/1943274/2147480678/235-10-S99-1
| Name: |
us-gaap_DebtInstrumentDecreaseForgiveness |
| Namespace Prefix: |
us-gaap_ |
| Data Type: |
xbrli:monetaryItemType |
| Balance Type: |
debit |
| Period Type: |
duration |
|
| X |
- DefinitionAmount of the required periodic payment applied to principal. Reference 1: http://fasb.org/us-gaap/role/ref/legacyRef
-Topic 210
-SubTopic 10
-Name Accounting Standards Codification
-Section S99
-Paragraph 1
-Subparagraph (SX 210.5-02(22)(b))
-Publisher FASB
-URI https://asc.fasb.org/1943274/2147480566/210-10-S99-1
Reference 2: http://fasb.org/us-gaap/role/ref/legacyRef
-Topic 210
-SubTopic 10
-Name Accounting Standards Codification
-Section S99
-Paragraph 1
-Subparagraph (SX 210.5-02(19)(b))
-Publisher FASB
-URI https://asc.fasb.org/1943274/2147480566/210-10-S99-1
| Name: |
us-gaap_LineOfCreditFacilityPeriodicPaymentPrincipal |
| Namespace Prefix: |
us-gaap_ |
| Data Type: |
xbrli:monetaryItemType |
| Balance Type: |
debit |
| Period Type: |
duration |
|
| X |
- DefinitionThe cash outflow to acquire asset without physical form usually arising from contractual or other legal rights, excluding goodwill. Reference 1: http://fasb.org/us-gaap/role/ref/legacyRef
-Topic 230
-SubTopic 10
-Name Accounting Standards Codification
-Section 45
-Paragraph 13
-Subparagraph (c)
-Publisher FASB
-URI https://asc.fasb.org/1943274/2147482740/230-10-45-13
| Name: |
us-gaap_PaymentsToAcquireIntangibleAssets |
| Namespace Prefix: |
us-gaap_ |
| Data Type: |
xbrli:monetaryItemType |
| Balance Type: |
credit |
| Period Type: |
duration |
|
| X |
- DefinitionAmount of cash inflow from contractual arrangement with the lender, including but not limited to, letter of credit, standby letter of credit and revolving credit arrangements. Reference 1: http://www.xbrl.org/2009/role/commonPracticeRef
-Topic 235
-SubTopic 10
-Name Accounting Standards Codification
-Section S99
-Paragraph 1
-Subparagraph (SX 210.4-08(f))
-Publisher FASB
-URI https://asc.fasb.org/1943274/2147480678/235-10-S99-1
Reference 2: http://fasb.org/us-gaap/role/ref/legacyRef
-Name Accounting Standards Codification
-Topic 230
-SubTopic 10
-Section 45
-Paragraph 14
-Subparagraph (b)
-Publisher FASB
-URI https://asc.fasb.org/1943274/2147482740/230-10-45-14
| Name: |
us-gaap_ProceedsFromLinesOfCredit |
| Namespace Prefix: |
us-gaap_ |
| Data Type: |
xbrli:monetaryItemType |
| Balance Type: |
debit |
| Period Type: |
duration |
|
| X |
- DefinitionThe cash outflow to repay long-term debt that is wholly or partially secured by collateral. Excludes repayments of tax exempt secured debt. Reference 1: http://fasb.org/us-gaap/role/ref/legacyRef
-Topic 230
-SubTopic 10
-Name Accounting Standards Codification
-Section 45
-Paragraph 15
-Subparagraph (b)
-Publisher FASB
-URI https://asc.fasb.org/1943274/2147482740/230-10-45-15
| Name: |
us-gaap_RepaymentsOfSecuredDebt |
| Namespace Prefix: |
us-gaap_ |
| Data Type: |
xbrli:monetaryItemType |
| Balance Type: |
credit |
| Period Type: |
duration |
|
v3.24.2.u1
Interest Rate Swap (Details Narrative) - USD ($)
|
3 Months Ended |
6 Months Ended |
|
Jun. 30, 2024 |
Jun. 30, 2023 |
Jun. 30, 2024 |
Jun. 30, 2023 |
Dec. 31, 2023 |
| Interest Rate Swap |
|
|
|
|
|
| Interest rate swap agreement |
|
|
$ 20,000,000
|
|
|
| Description of interest rate swap agreement |
|
|
the Company pays a fixed rate of interest at 6.217% and receives an average variable rate of SOFR + 2.35% adjusted monthly
|
|
|
| Weighted average rate |
|
|
7.69%
|
|
|
| Other long term assets |
$ 198,000
|
|
$ 198,000
|
|
$ 198,000
|
| Net liability |
21,000
|
|
21,000
|
|
$ 21,000
|
| Other income |
$ 14,000
|
$ 379,000
|
$ 219,000
|
$ 214,000
|
|
| X |
- References
+ Details
| Name: |
isdr_InterestRateSwapAbstract |
| Namespace Prefix: |
isdr_ |
| Data Type: |
xbrli:stringItemType |
| Balance Type: |
na |
| Period Type: |
duration |
|
| X |
- References
+ Details
| Name: |
isdr_InterestRateSwapAgreemenrdescription |
| Namespace Prefix: |
isdr_ |
| Data Type: |
xbrli:stringItemType |
| Balance Type: |
na |
| Period Type: |
duration |
|
| X |
- References
+ Details
| Name: |
isdr_InterestRateSwapAgreement |
| Namespace Prefix: |
isdr_ |
| Data Type: |
xbrli:monetaryItemType |
| Balance Type: |
credit |
| Period Type: |
duration |
|
| X |
- References
+ Details
| Name: |
isdr_OtherLongTermAssets |
| Namespace Prefix: |
isdr_ |
| Data Type: |
xbrli:monetaryItemType |
| Balance Type: |
debit |
| Period Type: |
instant |
|
| X |
- DefinitionFair value of asset after deduction of liability. Reference 1: http://www.xbrl.org/2009/role/commonPracticeRef
-Topic 820
-SubTopic 10
-Name Accounting Standards Codification
-Section 50
-Paragraph 2
-Subparagraph (b)
-Publisher FASB
-URI https://asc.fasb.org/1943274/2147482106/820-10-50-2
Reference 2: http://www.xbrl.org/2009/role/commonPracticeRef
-Topic 820
-SubTopic 10
-Name Accounting Standards Codification
-Section 50
-Paragraph 2
-Subparagraph (a)
-Publisher FASB
-URI https://asc.fasb.org/1943274/2147482106/820-10-50-2
| Name: |
us-gaap_FairValueNetAssetLiability |
| Namespace Prefix: |
us-gaap_ |
| Data Type: |
xbrli:monetaryItemType |
| Balance Type: |
debit |
| Period Type: |
instant |
|
| X |
- DefinitionWeighted average interest rate of long-term debt outstanding calculated over time.
| Name: |
us-gaap_LongTermDebtWeightedAverageInterestRateOverTime |
| Namespace Prefix: |
us-gaap_ |
| Data Type: |
dtr-types:percentItemType |
| Balance Type: |
na |
| Period Type: |
duration |
|
| X |
- DefinitionAmount of revenue and income classified as other. Reference 1: http://www.xbrl.org/2003/role/disclosureRef
-Topic 946
-SubTopic 320
-Name Accounting Standards Codification
-Section S99
-Paragraph 6
-Subparagraph (SX 210.12-14(Column E)(2))
-Publisher FASB
-URI https://asc.fasb.org/1943274/2147477271/946-320-S99-6
Reference 2: http://www.xbrl.org/2003/role/disclosureRef
-Topic 946
-SubTopic 320
-Name Accounting Standards Codification
-Section S99
-Paragraph 6
-Subparagraph (SX 210.12-14(Column E)(Footnote 4))
-Publisher FASB
-URI https://asc.fasb.org/1943274/2147477271/946-320-S99-6
Reference 3: http://www.xbrl.org/2003/role/disclosureRef
-Topic 946
-SubTopic 320
-Name Accounting Standards Codification
-Section S99
-Paragraph 6
-Subparagraph (SX 210.12-14(Column E)(Footnote 6)(b))
-Publisher FASB
-URI https://asc.fasb.org/1943274/2147477271/946-320-S99-6
Reference 4: http://www.xbrl.org/2003/role/disclosureRef
-Topic 944
-SubTopic 220
-Name Accounting Standards Codification
-Section S99
-Paragraph 1
-Subparagraph (SX 210.7-04(4))
-Publisher FASB
-URI https://asc.fasb.org/1943274/2147477250/944-220-S99-1
Reference 5: http://www.xbrl.org/2003/role/disclosureRef
-Topic 946
-SubTopic 220
-Name Accounting Standards Codification
-Section S99
-Paragraph 1
-Subparagraph (SX 210.6-07(1)(c))
-Publisher FASB
-URI https://asc.fasb.org/1943274/2147479134/946-220-S99-1
| Name: |
us-gaap_OtherIncome |
| Namespace Prefix: |
us-gaap_ |
| Data Type: |
xbrli:monetaryItemType |
| Balance Type: |
credit |
| Period Type: |
duration |
|
Grafico Azioni Issuer Direct (AMEX:ISDR)
Storico
Da Ago 2024 a Set 2024

Grafico Azioni Issuer Direct (AMEX:ISDR)
Storico
Da Set 2023 a Set 2024
