Pay vs Performance Disclosure - USD ($)
|
12 Months Ended |
Dec. 31, 2024 |
Dec. 31, 2023 |
Dec. 31, 2022 |
Dec. 31, 2021 |
Dec. 31, 2020 |
| Pay vs Performance Disclosure |
|
|
|
|
|
| Pay vs Performance Disclosure, Table |
|
|
|
|
|
|
|
|
|
|
|
|
|
|
|
|
|
|
|
|
|
|
|
|
|
|
|
|
|
|
|
|
|
|
|
|
|
Summary Compensation Table Total for PEO (2) |
|
|
Compensation Actually Paid to PEO (3) |
|
|
Average Summary Compensation Table Total for Non-PEO Named Executive Officers (2) |
|
|
Average Compensation Actually Paid to Non- PEO Named Executive Officers (4) |
|
|
Value of Initial Fixed $100 Investment Based On: (5) |
|
|
|
|
|
|
|
| |
|
|
|
Peer Group Total Shareholder Return (6) |
|
|
|
|
|
|
|
|
|
|
|
|
|
$8,635,625 |
|
|
|
$14,463,577 |
|
|
|
$3,650,119 |
|
|
|
$3,009,973 |
|
|
|
$230 |
|
|
|
$197 |
|
|
|
$369.9 |
|
|
|
$2,278.6 |
|
|
|
|
|
|
|
|
|
|
|
|
|
7,277,421 |
|
|
|
14,017,163 |
|
|
|
1,196,438 |
|
|
|
2,109,757 |
|
|
|
194 |
|
|
|
164 |
|
|
|
141.1 |
|
|
|
2,032.3 |
|
|
|
|
|
|
|
|
|
|
|
|
|
6,308,977 |
|
|
|
(3,290,220 |
) |
|
|
1,627,767 |
|
|
|
94,284 |
|
|
|
146 |
|
|
|
122 |
|
|
|
70.5 |
|
|
|
1,883.1 |
|
|
|
|
|
|
|
|
|
|
|
|
|
5,597,592 |
|
|
|
16,983,708 |
|
|
|
1,198,656 |
|
|
|
2,564,009 |
|
|
|
229 |
|
|
|
154 |
|
|
|
193.3 |
|
|
|
1,684.5 |
|
|
|
|
|
|
|
|
|
|
|
|
|
7,579,731 |
|
|
|
17,483,919 |
|
|
|
1,062,357 |
|
|
|
2,102,054 |
|
|
|
155 |
|
|
|
129 |
|
|
|
223.6 |
|
|
|
1,348.7 |
| (1) Kunal Kapoor served as the Company’s principal executive officer (PEO) and each of Jason Dubinsky, Bevin Desmond, Danny Dunn, a nd Joe Mansueto were the Company’s other NEOs for 2020, 2021, 2022 and 2023. Bevin resigned from her position with the Company effective January 31, 2023. Kunal served as the Company’s PEO and each of Jason Dubinsky, Danny Dunn, and Joe Mansueto were the Company’s other NEOs for 2024. (2) Amounts reported in this column represent (i) the total compensation reported in the Summary Compensation Table for the applicable year in the case of Kunal and (ii) the average of the total compensation reported in the Summary Compensation Table for the applicable year for the Company’s NEOs for the applicable year other than the PEO for such years. (3) Amounts reported in this column represent the compensation actually paid to Kunal as the PEO in the indicated fiscal years, based on his total compensation reported in the Summary Compensation Table for the indicated fiscal years and adjusted as shown in the table below:
|
|
|
|
|
|
|
|
|
|
|
|
|
|
|
|
|
|
|
|
|
| |
|
Principal Executive Officer |
|
|
|
|
|
|
|
| |
|
|
|
|
|
|
|
|
|
|
|
|
|
|
|
|
|
|
|
|
|
Summary Compensation Table — Total Compensation (a) |
|
$ |
8,635,625 |
|
|
$ |
7,277,421 |
|
|
$ |
6,308,977 |
|
|
$ |
5,597,592 |
|
|
$ |
7,579,731 |
|
|
|
|
|
|
|
- Grant Date Fair Value of Stock Awards Granted in Fiscal Year (b) |
|
|
6,197,274 |
|
|
|
5,199,571 |
|
|
|
4,499,252 |
|
|
|
3,594,637 |
|
|
|
6,235,742 |
|
|
|
|
|
|
|
+ Fair Value at Fiscal Year-End of Outstanding and Unvested Stock Awards Granted in Fiscal Year (c) |
|
|
6,413,419 |
|
|
|
8,503,605 |
|
|
|
4,075,140 |
|
|
|
5,103,683 |
|
|
|
10,296,721 |
|
|
|
|
|
|
|
+ Change in Fair Value of Outstanding and Unvested Stock Awards Granted in Prior Fiscal Years (d) |
|
|
4,882,210 |
|
|
|
4,435,258 |
|
|
|
(6,814,902 |
) |
|
|
8,792,335 |
|
|
|
5,441,145 |
|
|
|
|
|
|
|
+ Fair Value at Vesting of Stock Awards Granted in Fiscal Year That Vested During Fiscal Year (e) |
|
|
0 |
|
|
|
0 |
|
|
|
0 |
|
|
|
0 |
|
|
|
0 |
|
|
|
|
|
|
|
+ Change in Fair Value as of Vesting Date of Stock Awards Granted in Prior Fiscal Years For Which Applicable Vesting Conditions Were Satisfied During Fiscal Year (f) |
|
|
729,596 |
|
|
|
(999,550 |
) |
|
|
(2,360,183 |
) |
|
|
1,084,735 |
|
|
|
402,064 |
|
|
|
|
|
|
|
- Fair Value as of Prior Fiscal Year-End of Stock Awards Granted in Prior Fiscal Years That Failed to Meet Applicable Vesting Conditions During Fiscal Year (g) |
|
|
0 |
|
|
|
0 |
|
|
|
0 |
|
|
|
0 |
|
|
|
0 |
|
|
|
|
|
|
|
= Compensation Actually Paid |
|
|
14,463,577 |
|
|
|
14,017,163 |
|
|
|
(3,290,220 |
) |
|
|
16,983,708 |
|
|
|
17,483,919 |
| (a) Represents Total Compensation as reported in the Summary Compensation Table for the indicated fiscal year. (b) Represents the aggregate grant date fair value of the stock awards granted to Kunal during the indicated fiscal year, calculated using the same methodology as used in the Company’s financial statements under generally accepted accounting principles (GAAP). Amounts reported in this row include the portion of the annual incentive that are delivered in RSUs of $379,220 for 2024, $595,200 for 2021, and $232,275 for 2020, and which were reflected in the non-equity incentive compensation column of the Summary Compensation Table. (c) Represents the aggregate fair value as of the indicated fiscal year-end of Kunal’s outstanding and unvested stock awards granted during such fiscal year, calculated using the same methodology as used in the Company’s financial statements under GAAP, including the portion for the annual incentive that was delivered in RSUs for the applicable year. (d) Represents the aggregate change in fair value during the indicated fiscal year of the outstanding and unvested stock awards held by Kunal as of the last day of the indicated fiscal year, calculated using the same methodology as used in the Company’s financial statements under GAAP and, for awards subject to performance-based vesting conditions, based on the probable outcome of such performance-based vesting conditions as of the last day of the fiscal year. Amounts reported in this row in the 2024 proxy statement have been updated to correct an administrative error in which excluded $572,994 from the previously disclosed amounts for 2023. (e) Represents the aggregate fair value at vesting of the stock awards that were granted to Kunal and vested during the indicated fiscal year, calculated using the same methodology as used in the Company’s financial statements under GAAP. (f) Represents the aggregate change in fair value, measured from the prior fiscal year-end to the vesting date, of each stock award held by Kunal that was granted in a prior fiscal year and which vested during the indicated fiscal year, calculated using the same methodology as used in the Company’s financial statements under GAAP. Amounts reported in this row in the 2024 proxy statement have been updated to correct an administrative error in which excluded $644,223 from the previously disclosed amounts for 2020. (g) Represents the aggregate fair value as of the last day of the prior fiscal year of Kunal’s stock awards that were granted in a prior fiscal year and which failed to meet the applicable vesting conditions in the indicated fiscal year, calculated using the same methodology as used in the Company’s financial statements under GAAP. (4) Amounts reported in this column represent the compensation actually paid to the Company’s NEOs other than Kunal in the indicated fiscal year, based on the average total compensation for such NEOs reported in the Summary Compensation Table for the indicated fiscal year and adjusted as shown in the table below:
|
|
|
|
|
|
|
|
|
|
|
|
|
|
|
|
|
|
|
|
|
| |
|
Other Named Executive Officers Average (a) |
|
|
|
|
|
|
|
| |
|
|
|
|
|
|
|
|
|
|
|
|
|
|
|
|
|
|
|
|
|
Summary Compensation Table — Total Compensation (b) |
|
$ |
3,650,119 |
|
|
$ |
1,196,438 |
|
|
$ |
1,627,767 |
|
|
$ |
1,198,656 |
|
|
$ |
1,062,357 |
|
|
|
|
|
|
|
- Grant Date Fair Value of Stock Awards Granted in Fiscal Year (c) |
|
|
2,692,519 |
|
|
|
699,784 |
|
|
|
1,001,271 |
|
|
|
491,571 |
|
|
|
478,356 |
|
|
|
|
|
|
|
+ Fair Value at Fiscal Year-End of Outstanding and Unvested Stock Awards Granted in Fiscal Year (d) |
|
|
1,034,593 |
|
|
|
1,162,324 |
|
|
|
571,157 |
|
|
|
790,207 |
|
|
|
788,350 |
|
|
|
|
|
|
|
+ Change in Fair Value of Outstanding and Unvested Stock Awards Granted in Prior Fiscal Years (e) |
|
|
728,039 |
|
|
|
571,673 |
|
|
|
(780,841 |
) |
|
|
930,966 |
|
|
|
657,556 |
|
|
|
|
|
|
|
+ Fair Value at Vesting of Stock Awards Granted in Fiscal Year That Vested During Fiscal Year (f) |
|
|
155,695 |
|
|
|
0 |
|
|
|
0 |
|
|
|
0 |
|
|
|
0 |
|
|
|
|
|
|
|
+ Change in Fair Value as of Vesting Date of Stock Awards Granted in Prior Fiscal Years for Which Applicable Vesting Conditions Were Satisfied During Fiscal Year (g) |
|
|
134,046 |
|
|
|
(120,894 |
) |
|
|
(322,528 |
) |
|
|
135,751 |
|
|
|
72,147 |
|
|
|
|
|
|
|
- Fair Value as of Prior Fiscal Year-End of Stock Awards Granted in Prior Fiscal Years That Failed to Meet Applicable Vesting Conditions During Fiscal Year (h) |
|
|
0 |
|
|
|
0 |
|
|
|
0 |
|
|
|
0 |
|
|
|
0 |
|
|
|
|
|
|
|
= Compensation Actually Paid |
|
|
3,009,973 |
|
|
|
2,109,757 |
|
|
|
94,284 |
|
|
|
2,564,009 |
|
|
|
2,102,054 |
| (a) Please see footnote 1 for the NEOs included in the average for each indicated fiscal year. (b) Represents the average Total Compensation as reported in the Summary Compensation Table for the reported NEOs in the indicated fiscal year. (c) Represents the average aggregate grant date fair value of the stock awards granted to the reported NEOs during the indicated fiscal year, calculated using the same methodology as used in the Company’s financial statements under GAAP. Amounts reported in this row include the portion of the annual incentive that are delivered in RSUs of $12,945 for 2022, $16,740 for 2021, and $40,954 for 2020 and which were reflected in the non-equity incentive compensation column of the Summary Compensation Table. (d) Represents the average aggregate fair value as of the indicated fiscal year-end of the reported NEOs’ outstanding and unvested stock awards granted during such fiscal year, calculated using the same methodology as used in the Company’s financial statements under GAAP, including the portion for the annual incentive that was delivered in RSUs for the applicable year. Amounts reported in this row in the 2024 proxy statement have been updated to correct an administrative error in which excluded $17,819 from the previously disclosed amounts for 2023. (e) Represents the average aggregate change in fair value during the indicated fiscal year of the outstanding and unvested stock awards held by the reported NEOs as of the last day of the indicated fiscal year, calculated using the same methodology as used in the Company’s financial statements under GAAP and, for awards subject to performance-based vesting conditions, based on the probable outcome of such performance-based vesting conditions as of the last day of the fiscal year. Amounts reported in this row in the 2024 proxy statement have been updated to correct an administrative error in which excluded $123,306 from the previously disclosed amounts for 2023, $59,433 from the previously disclosed amounts for 2021, and $118,399 from the previously disclosed amounts for 2020. (f) Represents the average aggregate fair value at vesting of the stock awards that were granted to Mr. Dubinsky and vested during the indicated fiscal year in connection with his separation, calculated using the same methodology as used in the Company’s financial statements under GAAP. (g) Represents the average aggregate change in fair value, measured from the prior fiscal year-end to the vesting date, of each stock award held by the reported NEOs that was granted in a prior fiscal year and which vested during the indicated fiscal year, calculated using the same methodology as used in the Company’s financial statements under GAAP. Amounts reported in this row in the 2024 proxy statement have been updated to correct an administrative error in which excluded $2,082 from the previously disclosed amounts for 2023, $14,208 from the previously disclosed amounts for 2021, and $10,166 from the previously disclosed amounts for 2020. Included in this amount for 2024 is the change in value from December 31, 2023 through December 31, 2024 associated with awards previously granted to Mr. Dubinsky for which vesting was accelerated in connection with his separation. (h) Represents the average aggregate fair value as of the last day of the prior fiscal year of the reported NEOs’ stock awards that were granted in a prior fiscal year and which failed to meet the applicable vesting conditions in the indicated fiscal year, calculated using the same methodology as used in the Company’s financial statements under GAAP. (5) Pursuant to rules of the SEC, the comparison assumes $100 was invested on Dec e mber 31, 2019 in our common stock. Historic stock price performance is not necessarily indicative of future stock price performance. (6) The peer group TSR is based on the market cap weighted TSR performance of the respective compensation peer group disclosed in the Compensation Discussion and Analysis in 2024, which is the same peer group used in 2023. (7) As disclosed in the Compensation Discussion and Analysis, Adjusted Revenue is a non-GAAP financial measure and is adjusted to exclude the impact of certain items, such as foreign currency fluctuations. |
|
|
|
|
| Company Selected Measure Name |
Adjusted Revenue
|
|
|
|
|
| Named Executive Officers, Footnote |
(1) Kunal Kapoor served as the Company’s principal executive officer (PEO) and each of Jason Dubinsky, Bevin Desmond, Danny Dunn, a nd Joe Mansueto were the Company’s other NEOs for 2020, 2021, 2022 and 2023. Bevin resigned from her position with the Company effective January 31, 2023. Kunal served as the Company’s PEO and each of Jason Dubinsky, Danny Dunn, and Joe Mansueto were the Company’s other NEOs for 2024. |
|
|
|
|
| Peer Group Issuers, Footnote |
The peer group TSR is based on the market cap weighted TSR performance of the respective compensation peer group disclosed in the Compensation Discussion and Analysis in 2024, which is the same peer group used in 2023.
|
|
|
|
|
| PEO Total Compensation Amount |
$ 8,635,625
|
$ 7,277,421
|
$ 6,308,977
|
$ 5,597,592
|
$ 7,579,731
|
| PEO Actually Paid Compensation Amount |
$ 14,463,577
|
14,017,163
|
(3,290,220)
|
16,983,708
|
17,483,919
|
| Adjustment To PEO Compensation, Footnote |
(3) Amounts reported in this column represent the compensation actually paid to Kunal as the PEO in the indicated fiscal years, based on his total compensation reported in the Summary Compensation Table for the indicated fiscal years and adjusted as shown in the table below:
|
|
|
|
|
|
|
|
|
|
|
|
|
|
|
|
|
|
|
|
|
| |
|
Principal Executive Officer |
|
|
|
|
|
|
|
| |
|
|
|
|
|
|
|
|
|
|
|
|
|
|
|
|
|
|
|
|
|
Summary Compensation Table — Total Compensation (a) |
|
$ |
8,635,625 |
|
|
$ |
7,277,421 |
|
|
$ |
6,308,977 |
|
|
$ |
5,597,592 |
|
|
$ |
7,579,731 |
|
|
|
|
|
|
|
- Grant Date Fair Value of Stock Awards Granted in Fiscal Year (b) |
|
|
6,197,274 |
|
|
|
5,199,571 |
|
|
|
4,499,252 |
|
|
|
3,594,637 |
|
|
|
6,235,742 |
|
|
|
|
|
|
|
+ Fair Value at Fiscal Year-End of Outstanding and Unvested Stock Awards Granted in Fiscal Year (c) |
|
|
6,413,419 |
|
|
|
8,503,605 |
|
|
|
4,075,140 |
|
|
|
5,103,683 |
|
|
|
10,296,721 |
|
|
|
|
|
|
|
+ Change in Fair Value of Outstanding and Unvested Stock Awards Granted in Prior Fiscal Years (d) |
|
|
4,882,210 |
|
|
|
4,435,258 |
|
|
|
(6,814,902 |
) |
|
|
8,792,335 |
|
|
|
5,441,145 |
|
|
|
|
|
|
|
+ Fair Value at Vesting of Stock Awards Granted in Fiscal Year That Vested During Fiscal Year (e) |
|
|
0 |
|
|
|
0 |
|
|
|
0 |
|
|
|
0 |
|
|
|
0 |
|
|
|
|
|
|
|
+ Change in Fair Value as of Vesting Date of Stock Awards Granted in Prior Fiscal Years For Which Applicable Vesting Conditions Were Satisfied During Fiscal Year (f) |
|
|
729,596 |
|
|
|
(999,550 |
) |
|
|
(2,360,183 |
) |
|
|
1,084,735 |
|
|
|
402,064 |
|
|
|
|
|
|
|
- Fair Value as of Prior Fiscal Year-End of Stock Awards Granted in Prior Fiscal Years That Failed to Meet Applicable Vesting Conditions During Fiscal Year (g) |
|
|
0 |
|
|
|
0 |
|
|
|
0 |
|
|
|
0 |
|
|
|
0 |
|
|
|
|
|
|
|
= Compensation Actually Paid |
|
|
14,463,577 |
|
|
|
14,017,163 |
|
|
|
(3,290,220 |
) |
|
|
16,983,708 |
|
|
|
17,483,919 |
| (a) Represents Total Compensation as reported in the Summary Compensation Table for the indicated fiscal year. (b) Represents the aggregate grant date fair value of the stock awards granted to Kunal during the indicated fiscal year, calculated using the same methodology as used in the Company’s financial statements under generally accepted accounting principles (GAAP). Amounts reported in this row include the portion of the annual incentive that are delivered in RSUs of $379,220 for 2024, $595,200 for 2021, and $232,275 for 2020, and which were reflected in the non-equity incentive compensation column of the Summary Compensation Table. (c) Represents the aggregate fair value as of the indicated fiscal year-end of Kunal’s outstanding and unvested stock awards granted during such fiscal year, calculated using the same methodology as used in the Company’s financial statements under GAAP, including the portion for the annual incentive that was delivered in RSUs for the applicable year. (d) Represents the aggregate change in fair value during the indicated fiscal year of the outstanding and unvested stock awards held by Kunal as of the last day of the indicated fiscal year, calculated using the same methodology as used in the Company’s financial statements under GAAP and, for awards subject to performance-based vesting conditions, based on the probable outcome of such performance-based vesting conditions as of the last day of the fiscal year. Amounts reported in this row in the 2024 proxy statement have been updated to correct an administrative error in which excluded $572,994 from the previously disclosed amounts for 2023. (e) Represents the aggregate fair value at vesting of the stock awards that were granted to Kunal and vested during the indicated fiscal year, calculated using the same methodology as used in the Company’s financial statements under GAAP. (f) Represents the aggregate change in fair value, measured from the prior fiscal year-end to the vesting date, of each stock award held by Kunal that was granted in a prior fiscal year and which vested during the indicated fiscal year, calculated using the same methodology as used in the Company’s financial statements under GAAP. Amounts reported in this row in the 2024 proxy statement have been updated to correct an administrative error in which excluded $644,223 from the previously disclosed amounts for 2020. (g) Represents the aggregate fair value as of the last day of the prior fiscal year of Kunal’s stock awards that were granted in a prior fiscal year and which failed to meet the applicable vesting conditions in the indicated fiscal year, calculated using the same methodology as used in the Company’s financial statements under GAAP. |
|
|
|
|
| Non-PEO NEO Average Total Compensation Amount |
$ 3,650,119
|
1,196,438
|
1,627,767
|
1,198,656
|
1,062,357
|
| Non-PEO NEO Average Compensation Actually Paid Amount |
$ 3,009,973
|
2,109,757
|
94,284
|
2,564,009
|
2,102,054
|
| Adjustment to Non-PEO NEO Compensation Footnote |
(4) Amounts reported in this column represent the compensation actually paid to the Company’s NEOs other than Kunal in the indicated fiscal year, based on the average total compensation for such NEOs reported in the Summary Compensation Table for the indicated fiscal year and adjusted as shown in the table below:
|
|
|
|
|
|
|
|
|
|
|
|
|
|
|
|
|
|
|
|
|
| |
|
Other Named Executive Officers Average (a) |
|
|
|
|
|
|
|
| |
|
|
|
|
|
|
|
|
|
|
|
|
|
|
|
|
|
|
|
|
|
Summary Compensation Table — Total Compensation (b) |
|
$ |
3,650,119 |
|
|
$ |
1,196,438 |
|
|
$ |
1,627,767 |
|
|
$ |
1,198,656 |
|
|
$ |
1,062,357 |
|
|
|
|
|
|
|
- Grant Date Fair Value of Stock Awards Granted in Fiscal Year (c) |
|
|
2,692,519 |
|
|
|
699,784 |
|
|
|
1,001,271 |
|
|
|
491,571 |
|
|
|
478,356 |
|
|
|
|
|
|
|
+ Fair Value at Fiscal Year-End of Outstanding and Unvested Stock Awards Granted in Fiscal Year (d) |
|
|
1,034,593 |
|
|
|
1,162,324 |
|
|
|
571,157 |
|
|
|
790,207 |
|
|
|
788,350 |
|
|
|
|
|
|
|
+ Change in Fair Value of Outstanding and Unvested Stock Awards Granted in Prior Fiscal Years (e) |
|
|
728,039 |
|
|
|
571,673 |
|
|
|
(780,841 |
) |
|
|
930,966 |
|
|
|
657,556 |
|
|
|
|
|
|
|
+ Fair Value at Vesting of Stock Awards Granted in Fiscal Year That Vested During Fiscal Year (f) |
|
|
155,695 |
|
|
|
0 |
|
|
|
0 |
|
|
|
0 |
|
|
|
0 |
|
|
|
|
|
|
|
+ Change in Fair Value as of Vesting Date of Stock Awards Granted in Prior Fiscal Years for Which Applicable Vesting Conditions Were Satisfied During Fiscal Year (g) |
|
|
134,046 |
|
|
|
(120,894 |
) |
|
|
(322,528 |
) |
|
|
135,751 |
|
|
|
72,147 |
|
|
|
|
|
|
|
- Fair Value as of Prior Fiscal Year-End of Stock Awards Granted in Prior Fiscal Years That Failed to Meet Applicable Vesting Conditions During Fiscal Year (h) |
|
|
0 |
|
|
|
0 |
|
|
|
0 |
|
|
|
0 |
|
|
|
0 |
|
|
|
|
|
|
|
= Compensation Actually Paid |
|
|
3,009,973 |
|
|
|
2,109,757 |
|
|
|
94,284 |
|
|
|
2,564,009 |
|
|
|
2,102,054 |
| (a) Please see footnote 1 for the NEOs included in the average for each indicated fiscal year. (b) Represents the average Total Compensation as reported in the Summary Compensation Table for the reported NEOs in the indicated fiscal year. (c) Represents the average aggregate grant date fair value of the stock awards granted to the reported NEOs during the indicated fiscal year, calculated using the same methodology as used in the Company’s financial statements under GAAP. Amounts reported in this row include the portion of the annual incentive that are delivered in RSUs of $12,945 for 2022, $16,740 for 2021, and $40,954 for 2020 and which were reflected in the non-equity incentive compensation column of the Summary Compensation Table. (d) Represents the average aggregate fair value as of the indicated fiscal year-end of the reported NEOs’ outstanding and unvested stock awards granted during such fiscal year, calculated using the same methodology as used in the Company’s financial statements under GAAP, including the portion for the annual incentive that was delivered in RSUs for the applicable year. Amounts reported in this row in the 2024 proxy statement have been updated to correct an administrative error in which excluded $17,819 from the previously disclosed amounts for 2023. (e) Represents the average aggregate change in fair value during the indicated fiscal year of the outstanding and unvested stock awards held by the reported NEOs as of the last day of the indicated fiscal year, calculated using the same methodology as used in the Company’s financial statements under GAAP and, for awards subject to performance-based vesting conditions, based on the probable outcome of such performance-based vesting conditions as of the last day of the fiscal year. Amounts reported in this row in the 2024 proxy statement have been updated to correct an administrative error in which excluded $123,306 from the previously disclosed amounts for 2023, $59,433 from the previously disclosed amounts for 2021, and $118,399 from the previously disclosed amounts for 2020. (f) Represents the average aggregate fair value at vesting of the stock awards that were granted to Mr. Dubinsky and vested during the indicated fiscal year in connection with his separation, calculated using the same methodology as used in the Company’s financial statements under GAAP. (g) Represents the average aggregate change in fair value, measured from the prior fiscal year-end to the vesting date, of each stock award held by the reported NEOs that was granted in a prior fiscal year and which vested during the indicated fiscal year, calculated using the same methodology as used in the Company’s financial statements under GAAP. Amounts reported in this row in the 2024 proxy statement have been updated to correct an administrative error in which excluded $2,082 from the previously disclosed amounts for 2023, $14,208 from the previously disclosed amounts for 2021, and $10,166 from the previously disclosed amounts for 2020. Included in this amount for 2024 is the change in value from December 31, 2023 through December 31, 2024 associated with awards previously granted to Mr. Dubinsky for which vesting was accelerated in connection with his separation. (h) Represents the average aggregate fair value as of the last day of the prior fiscal year of the reported NEOs’ stock awards that were granted in a prior fiscal year and which failed to meet the applicable vesting conditions in the indicated fiscal year, calculated using the same methodology as used in the Company’s financial statements under GAAP. |
|
|
|
|
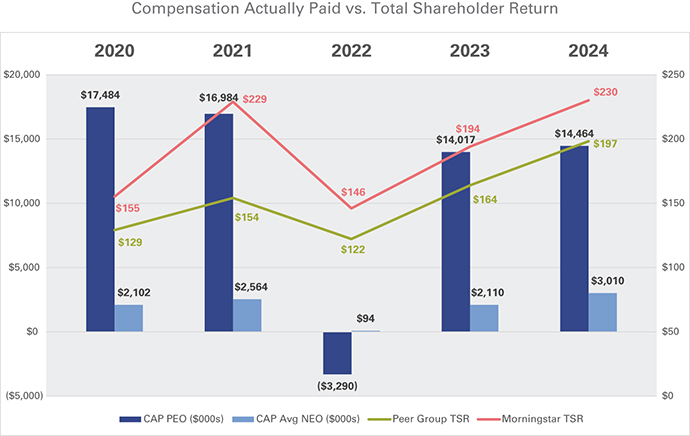
| Compensation Actually Paid vs. Total Shareholder Return |
|
|
|
|
|
| Compensation Actually Paid vs. Net Income |

|
|
|
|
|
| Compensation Actually Paid vs. Company Selected Measure |

|
|
|
|
|
| Total Shareholder Return Vs Peer Group |
|
|
|
|
|
| Tabular List, Table |
|
|
|
|
|
| Total Shareholder Return Amount |
$ 230
|
194
|
146
|
229
|
155
|
| Peer Group Total Shareholder Return Amount |
197
|
164
|
122
|
154
|
129
|
| Net Income (Loss) |
$ 369,900,000
|
$ 141,100,000
|
$ 70,500,000
|
$ 193,300,000
|
$ 223,600,000
|
| Company Selected Measure Amount |
2,278,600,000
|
2,032,300,000
|
1,883,100,000
|
1,684,500,000
|
1,348,700,000
|
| PEO Name |
Kunal Kapoor
|
|
|
|
|
| Measure:: 1 |
|
|
|
|
|
| Pay vs Performance Disclosure |
|
|
|
|
|
| Name |
Adjusted Revenue
|
|
|
|
|
| Non-GAAP Measure Description |
As disclosed in the Compensation Discussion and Analysis, Adjusted Revenue is a non-GAAP financial measure and is adjusted to exclude the impact of certain items, such as foreign currency fluctuations.
|
|
|
|
|
| Measure:: 2 |
|
|
|
|
|
| Pay vs Performance Disclosure |
|
|
|
|
|
| Name |
AOI
|
|
|
|
|
| Measure:: 3 |
|
|
|
|
|
| Pay vs Performance Disclosure |
|
|
|
|
|
| Name |
TSR
|
|
|
|
|
| PEO | Aggregate Grant Date Fair Value of Equity Award Amounts Reported in Summary Compensation Table |
|
|
|
|
|
| Pay vs Performance Disclosure |
|
|
|
|
|
| Adjustment to Compensation, Amount |
$ (6,197,274)
|
$ (5,199,571)
|
$ (4,499,252)
|
$ (3,594,637)
|
$ (6,235,742)
|
| PEO | Year-end Fair Value of Equity Awards Granted in Covered Year that are Outstanding and Unvested |
|
|
|
|
|
| Pay vs Performance Disclosure |
|
|
|
|
|
| Adjustment to Compensation, Amount |
6,413,419
|
8,503,605
|
4,075,140
|
5,103,683
|
10,296,721
|
| PEO | Year-over-Year Change in Fair Value of Equity Awards Granted in Prior Years That are Outstanding and Unvested |
|
|
|
|
|
| Pay vs Performance Disclosure |
|
|
|
|
|
| Adjustment to Compensation, Amount |
4,882,210
|
4,435,258
|
(6,814,902)
|
8,792,335
|
5,441,145
|
| PEO | Vesting Date Fair Value of Equity Awards Granted and Vested in Covered Year |
|
|
|
|
|
| Pay vs Performance Disclosure |
|
|
|
|
|
| Adjustment to Compensation, Amount |
0
|
0
|
0
|
0
|
0
|
| PEO | Change in Fair Value as of Vesting Date of Prior Year Equity Awards Vested in Covered Year |
|
|
|
|
|
| Pay vs Performance Disclosure |
|
|
|
|
|
| Adjustment to Compensation, Amount |
729,596
|
(999,550)
|
(2,360,183)
|
1,084,735
|
402,064
|
| PEO | Prior Year End Fair Value of Equity Awards Granted in Any Prior Year that Fail to Meet Applicable Vesting Conditions During Covered Year |
|
|
|
|
|
| Pay vs Performance Disclosure |
|
|
|
|
|
| Adjustment to Compensation, Amount |
0
|
0
|
0
|
0
|
0
|
| Non-PEO NEO | Aggregate Grant Date Fair Value of Equity Award Amounts Reported in Summary Compensation Table |
|
|
|
|
|
| Pay vs Performance Disclosure |
|
|
|
|
|
| Adjustment to Compensation, Amount |
(2,692,519)
|
(699,784)
|
(1,001,271)
|
(491,571)
|
(478,356)
|
| Non-PEO NEO | Year-end Fair Value of Equity Awards Granted in Covered Year that are Outstanding and Unvested |
|
|
|
|
|
| Pay vs Performance Disclosure |
|
|
|
|
|
| Adjustment to Compensation, Amount |
1,034,593
|
1,162,324
|
571,157
|
790,207
|
788,350
|
| Non-PEO NEO | Year-over-Year Change in Fair Value of Equity Awards Granted in Prior Years That are Outstanding and Unvested |
|
|
|
|
|
| Pay vs Performance Disclosure |
|
|
|
|
|
| Adjustment to Compensation, Amount |
728,039
|
571,673
|
(780,841)
|
930,966
|
657,556
|
| Non-PEO NEO | Vesting Date Fair Value of Equity Awards Granted and Vested in Covered Year |
|
|
|
|
|
| Pay vs Performance Disclosure |
|
|
|
|
|
| Adjustment to Compensation, Amount |
155,695
|
0
|
0
|
0
|
0
|
| Non-PEO NEO | Change in Fair Value as of Vesting Date of Prior Year Equity Awards Vested in Covered Year |
|
|
|
|
|
| Pay vs Performance Disclosure |
|
|
|
|
|
| Adjustment to Compensation, Amount |
134,046
|
(120,894)
|
(322,528)
|
135,751
|
72,147
|
| Non-PEO NEO | Prior Year End Fair Value of Equity Awards Granted in Any Prior Year that Fail to Meet Applicable Vesting Conditions During Covered Year |
|
|
|
|
|
| Pay vs Performance Disclosure |
|
|
|
|
|
| Adjustment to Compensation, Amount |
$ 0
|
$ 0
|
$ 0
|
$ 0
|
$ 0
|
