Pay vs Performance Disclosure - USD ($)
|
12 Months Ended |
Dec. 31, 2024 |
Dec. 31, 2023 |
Dec. 31, 2022 |
Dec. 31, 2021 |
Dec. 31, 2020 |
| Pay vs Performance Disclosure |
|
|
|
|
|
| Pay vs Performance Disclosure, Table |
| | | | | | | | | | | | | | | | | | | | | | | | | | | | | | | | | | | | | | | | | | Net Income | | | | | | | | | | | | | | | | Value of Initial Fixed | | | | Excluding | | | | | | | | | | | | | | | | $100 Investment Based | | | | Tax | | | | | | | | | | | | Average | | | | on: | | | | Adjustments | | | | Summary | | Summary | | Compensation | | Compensation | | Summary | | Average | | | | Peer Group | | | | and Other | | | | Compensation | | Compensation | | Actually Paid | | Actually Paid | | Compensation | | Compensation | | Total | | Total | | Net | | Items | | | | Table Total for | | Table Total for | | to PEO | | to PEO | | Table Total for | | Actually Paid | | Shareholder | | Shareholder | | Income | | (non-GAAP) | | | | PEO (Kenney) | | PEO (Lyons) | | (Kenney) | | (Lyons) | | Non-PEO | | to Non-PEO | | Return | | Return | | ($, in | | ($, in | | Year | | ($)(1) | | ($)(1) | | ($)(1) | | ($)(1) | | NEOs ($)(1) | | NEOs ($)(1) | | ($) | | ($)(2) | | millions) | | millions) | | 2024 | | | | 6,846,635 | | | | 7,553,607 | | 1,805,805 | | 2,165,676 | | 207.68 | | 163.30 | | 284.184 | | 288.079 | | 2023 | | | | 6,472,498 | | | | 5,092,187 | | 1,798,061 | | 1,543,434 | | 158.50 | | 143.34 | | 259.169 | | 257.602 | | 2022 | | 6,120,956 | | 4,559,380 | | (2,085,538) | | 4,463,028 | | 1,909,348 | | 1,434,592 | | 137.55 | | 123.10 | | 155.923 | | 217.694 | | 2021 | | 7,464,484 | | | | 8,822,603 | | | | 2,150,242 | | 2,418,007 | | 132.04 | | 141.70 | | 143.093 | | 182.186 | | 2020 | | 7,286,765 | | | | 6,085,390 | | | | 2,230,205 | | 1,665,757 | | 103.21 | | 113.61 | | 151.306 | | 162.515 | |
(1) | Amounts represent compensation actually paid to our PEOs and the average compensation actually paid to our remaining NEOs for the relevant fiscal year, as determined under SEC rules (and described below), which includes the individuals indicated in the table below for each fiscal year: |
Year | | PEO(s) | | Non-PEO NEOs | 2024 | | Robert C. Lyons | | Thomas A. Ellman, Brian L. Glassberg, Kim Nero, and Paul F. Titterton | 2023 | | Robert C. Lyons | | Thomas A. Ellman, Brian L. Glassberg, Kim Nero, and Paul F. Titterton | 2022 | | Robert C. Lyons;
Brian A. Kenney(a) | | Thomas A. Ellman, Deborah A. Golden, Kim Nero, N. Gokce Tezel, Paul F. Titterton, and Robert A. Zmudka | 2021 | | Brian A. Kenney | | Thomas A. Ellman, Deborah A. Golden, Robert C. Lyons, and N. Gokce Tezel | 2020 | | Brian A. Kenney | | Thomas A. Ellman, Deborah A. Golden, Robert C. Lyons, and N. Gokce Tezel |
(a) | Effective April 22, 2022, Mr. Lyons was appointed as our President and Chief Executive Officer upon the retirement of Mr. Kenney. |
Compensation actually paid to our NEOs represents the “Total” compensation reported in the Summary Compensation Table for the applicable fiscal year (“FY”), as adjusted as follows: | | | | | | | | | | | | | | | | | | | | | | | | | | | | | | | | | | | | | 2020 | | 2021 | | 2022 | | 2023 | | 2024 | | | | | | Average | | | | | Average | | | | | | | Average | | | | | Average | | | | | Average | | | | | | | Non-PEO | | | | | Non-PEO | | PEO | | PEO | | Non-PEO | | | | Non-PEO | | | | Non-PEO | | Adjustments (a) | | PEO | | NEOs | | PEO | | NEOs | | (Kenney) | | (Lyons) | | NEOs | | PEO | | NEOs | | PEO | | NEOs | | Deduction for Amounts Reported under the “Stock Awards” and “Option Awards” Columns in the Summary Compensation Table for Applicable FY | | $ | (3,711,680) | | $ | (672,742) | | $ | (4,732,100) | | $ | (819,143) | | $ | (5,119,282) | | $ | (3,096,428) | | $ | (802,187) | | $ | (3,603,404) | | $ | (738,939) | | $ | (4,080,362) | | $ | (883,331) | | Increase based on ASC 718 Fair Value of Awards Granted during Applicable FY that Remain Unvested as of Applicable FY End, determined as of Applicable FY End | | $ | 4,033,698 | | $ | 731,108 | | $ | 5,215,423 | | $ | 902,825 | | $ | 724,813 | | $ | 3,188,799 | | $ | 623,923 | | $ | 3,321,372 | | $ | 680,948 | | $ | 4,316,560 | | $ | 934,492 | | Increase based on ASC 718 Fair Value of Awards Granted during Applicable FY that Vested during Applicable FY, determined as of Vesting Date | | $ | — | | $ | — | | $ | — | | $ | — | | $ | 682,021 | | $ | — | | $ | 18,517 | | $ | — | | $ | — | | $ | — | | $ | — | | Increase/deduction for Awards Granted during Prior FY that were Outstanding and Unvested as of Applicable FY End, determined based on change in ASC 718 Fair Value from Prior FY End to Applicable FY End | | $ | (751,099) | | $ | (137,477) | | $ | (250,914) | | $ | (47,142) | | $ | (1,099,553) | | $ | (451,230) | | $ | (395,281) | | $ | (90,196) | | $ | 14,411 | | $ | 982,055 | | $ | 249,659 | | Increase/deduction for Awards Granted during Prior FY that Vested During Applicable FY, determined based on change in ASC 718 Fair Value from Prior FY End to Vesting Date | | $ | 558,613 | | $ | 98,045 | | $ | 1,142,195 | | $ | 230,193 | | $ | 319,898 | | $ | 77,046 | | $ | 139,484 | | $ | (131,861) | | $ | (46,859) | | $ | 79,514 | | $ | 27,885 | | Deduction of ASC 718 Fair Value of Awards Granted during Prior FY that were Forfeited during Applicable FY, determined as of Prior FY End | | $ | — | | $ | — | | $ | — | | $ | — | | $ | (3,603,913) | | $ | — | | $ | (97,972) | | $ | — | | $ | — | | $ | — | | $ | — | | Increase based on Dividends Paid to the Executive during Applicable FY on outstanding equity awards | | $ | — | | $ | — | | $ | — | | $ | — | | $ | — | | $ | — | | $ | — | | $ | — | | $ | — | | $ | — | | $ | — | | Increase based on Incremental Fair Value of Options Modified during Applicable FY | | $ | — | | $ | — | | $ | — | | $ | — | | $ | — | | $ | — | | $ | — | | $ | — | | $ | — | | $ | — | | $ | — | | Deduction for Change in the Actuarial Present Values reported under the “Change in Pension Value and Nonqualified Deferred Compensation Earnings” Column of the Summary Compensation Table for Applicable FY | | $ | (1,716,441) | | $ | (711,706) | | $ | (467,804) | | $ | (157,910) | | $ | (250,696) | | $ | — | | $ | (63,023) | | $ | (1,081,846) | | $ | (226,300) | | $ | (835,080) | | $ | (39,871) | | Increase for Service Cost and, if applicable, Prior Service Cost for Pension Plans | | $ | 385,534 | | $ | 128,325 | | $ | 451,318 | | $ | 158,942 | | $ | 140,217 | | $ | 185,460 | | $ | 101,783 | | $ | 205,624 | | $ | 62,112 | | $ | 244,285 | | $ | 71,037 | | TOTAL ADJUSTMENTS | | $ | (1,201,375) | | $ | (564,448) | | $ | 1,358,118 | | $ | 267,766 | | $ | (8,206,494) | | $ | (96,353) | | $ | (474,756) | | $ | (1,380,311) | | $ | (254,628) | | $ | 706,972 | | $ | 359,871 | |
(a) | Fair value or change in fair value, as applicable, of equity awards in the “Compensation Actually Paid” columns was determined by reference to (1) for performance stock units (and RSUs, if any), the average of the high and low values of our common stock on applicable year-end date(s) or, in the case of vesting dates, the closing price on the applicable vesting date(s) multiplied by the probability of achievement as of the applicable date, and (2) for stock options, a value derived using the Black-Scholes option pricing model and the present value of dividends we expect to pay over the expected term of the award as of the applicable year-end or vesting date(s), determined based on the same methodology as used to determine grant date fair value of such stock options for financial statement purposes modified to obtain the values as of the relevant valuation dates. The Black-Scholes option pricing model assumptions were determined as follows: a) the average of the high and low values of our common stock on the applicable valuation date as of the current market price, b) in the case of in the money options, an expected term equal to the original ratio of expected term relative to the seven-year contractual term multiplied times the remaining term as of the applicable valuation date, and in the case of underwater stock options, an expected term set equal to the remaining term of the award, c) volatility based on the historical volatility of our stock price over a period equal to the expected term, and d) risk-free interest rates based on the implied yield on recently-issued U.S. Treasury zero-coupon bonds with a term comparable to the expected term. In all cases, these amounts were calculated in accordance with ASC Topic No. 718, Compensation – Stock Compensation. For additional information on the assumptions used to calculate the valuation of the awards, see the Notes to the Company’s audited financial statements contained in the Company’s Annual Report on Form 10-K for the fiscal year ended December 31, 2024 and prior fiscal years. |
(2) | For the relevant fiscal year, represents the cumulative TSR (the “Peer Group TSR”) of the S&P MidCap 400 Index as of December 31 (the “Peer Group”). |
|
|
|
|
|
| Company Selected Measure Name |
Net income, excluding tax adjustments and other items (non-GAAP)
|
|
|
|
|
| Named Executive Officers, Footnote |
Year | | PEO(s) | | Non-PEO NEOs | 2024 | | Robert C. Lyons | | Thomas A. Ellman, Brian L. Glassberg, Kim Nero, and Paul F. Titterton | 2023 | | Robert C. Lyons | | Thomas A. Ellman, Brian L. Glassberg, Kim Nero, and Paul F. Titterton | 2022 | | Robert C. Lyons;
Brian A. Kenney(a) | | Thomas A. Ellman, Deborah A. Golden, Kim Nero, N. Gokce Tezel, Paul F. Titterton, and Robert A. Zmudka | 2021 | | Brian A. Kenney | | Thomas A. Ellman, Deborah A. Golden, Robert C. Lyons, and N. Gokce Tezel | 2020 | | Brian A. Kenney | | Thomas A. Ellman, Deborah A. Golden, Robert C. Lyons, and N. Gokce Tezel |
(a) | Effective April 22, 2022, Mr. Lyons was appointed as our President and Chief Executive Officer upon the retirement of Mr. Kenney. |
|
|
|
|
|
| Peer Group Issuers, Footnote |
(2) | For the relevant fiscal year, represents the cumulative TSR (the “Peer Group TSR”) of the S&P MidCap 400 Index as of December 31 (the “Peer Group”). |
|
|
|
|
|
| Adjustment To PEO Compensation, Footnote |
Compensation actually paid to our NEOs represents the “Total” compensation reported in the Summary Compensation Table for the applicable fiscal year (“FY”), as adjusted as follows: | | | | | | | | | | | | | | | | | | | | | | | | | | | | | | | | | | | | | 2020 | | 2021 | | 2022 | | 2023 | | 2024 | | | | | | Average | | | | | Average | | | | | | | Average | | | | | Average | | | | | Average | | | | | | | Non-PEO | | | | | Non-PEO | | PEO | | PEO | | Non-PEO | | | | Non-PEO | | | | Non-PEO | | Adjustments (a) | | PEO | | NEOs | | PEO | | NEOs | | (Kenney) | | (Lyons) | | NEOs | | PEO | | NEOs | | PEO | | NEOs | | Deduction for Amounts Reported under the “Stock Awards” and “Option Awards” Columns in the Summary Compensation Table for Applicable FY | | $ | (3,711,680) | | $ | (672,742) | | $ | (4,732,100) | | $ | (819,143) | | $ | (5,119,282) | | $ | (3,096,428) | | $ | (802,187) | | $ | (3,603,404) | | $ | (738,939) | | $ | (4,080,362) | | $ | (883,331) | | Increase based on ASC 718 Fair Value of Awards Granted during Applicable FY that Remain Unvested as of Applicable FY End, determined as of Applicable FY End | | $ | 4,033,698 | | $ | 731,108 | | $ | 5,215,423 | | $ | 902,825 | | $ | 724,813 | | $ | 3,188,799 | | $ | 623,923 | | $ | 3,321,372 | | $ | 680,948 | | $ | 4,316,560 | | $ | 934,492 | | Increase based on ASC 718 Fair Value of Awards Granted during Applicable FY that Vested during Applicable FY, determined as of Vesting Date | | $ | — | | $ | — | | $ | — | | $ | — | | $ | 682,021 | | $ | — | | $ | 18,517 | | $ | — | | $ | — | | $ | — | | $ | — | | Increase/deduction for Awards Granted during Prior FY that were Outstanding and Unvested as of Applicable FY End, determined based on change in ASC 718 Fair Value from Prior FY End to Applicable FY End | | $ | (751,099) | | $ | (137,477) | | $ | (250,914) | | $ | (47,142) | | $ | (1,099,553) | | $ | (451,230) | | $ | (395,281) | | $ | (90,196) | | $ | 14,411 | | $ | 982,055 | | $ | 249,659 | | Increase/deduction for Awards Granted during Prior FY that Vested During Applicable FY, determined based on change in ASC 718 Fair Value from Prior FY End to Vesting Date | | $ | 558,613 | | $ | 98,045 | | $ | 1,142,195 | | $ | 230,193 | | $ | 319,898 | | $ | 77,046 | | $ | 139,484 | | $ | (131,861) | | $ | (46,859) | | $ | 79,514 | | $ | 27,885 | | Deduction of ASC 718 Fair Value of Awards Granted during Prior FY that were Forfeited during Applicable FY, determined as of Prior FY End | | $ | — | | $ | — | | $ | — | | $ | — | | $ | (3,603,913) | | $ | — | | $ | (97,972) | | $ | — | | $ | — | | $ | — | | $ | — | | Increase based on Dividends Paid to the Executive during Applicable FY on outstanding equity awards | | $ | — | | $ | — | | $ | — | | $ | — | | $ | — | | $ | — | | $ | — | | $ | — | | $ | — | | $ | — | | $ | — | | Increase based on Incremental Fair Value of Options Modified during Applicable FY | | $ | — | | $ | — | | $ | — | | $ | — | | $ | — | | $ | — | | $ | — | | $ | — | | $ | — | | $ | — | | $ | — | | Deduction for Change in the Actuarial Present Values reported under the “Change in Pension Value and Nonqualified Deferred Compensation Earnings” Column of the Summary Compensation Table for Applicable FY | | $ | (1,716,441) | | $ | (711,706) | | $ | (467,804) | | $ | (157,910) | | $ | (250,696) | | $ | — | | $ | (63,023) | | $ | (1,081,846) | | $ | (226,300) | | $ | (835,080) | | $ | (39,871) | | Increase for Service Cost and, if applicable, Prior Service Cost for Pension Plans | | $ | 385,534 | | $ | 128,325 | | $ | 451,318 | | $ | 158,942 | | $ | 140,217 | | $ | 185,460 | | $ | 101,783 | | $ | 205,624 | | $ | 62,112 | | $ | 244,285 | | $ | 71,037 | | TOTAL ADJUSTMENTS | | $ | (1,201,375) | | $ | (564,448) | | $ | 1,358,118 | | $ | 267,766 | | $ | (8,206,494) | | $ | (96,353) | | $ | (474,756) | | $ | (1,380,311) | | $ | (254,628) | | $ | 706,972 | | $ | 359,871 | |
(a) | Fair value or change in fair value, as applicable, of equity awards in the “Compensation Actually Paid” columns was determined by reference to (1) for performance stock units (and RSUs, if any), the average of the high and low values of our common stock on applicable year-end date(s) or, in the case of vesting dates, the closing price on the applicable vesting date(s) multiplied by the probability of achievement as of the applicable date, and (2) for stock options, a value derived using the Black-Scholes option pricing model and the present value of dividends we expect to pay over the expected term of the award as of the applicable year-end or vesting date(s), determined based on the same methodology as used to determine grant date fair value of such stock options for financial statement purposes modified to obtain the values as of the relevant valuation dates. The Black-Scholes option pricing model assumptions were determined as follows: a) the average of the high and low values of our common stock on the applicable valuation date as of the current market price, b) in the case of in the money options, an expected term equal to the original ratio of expected term relative to the seven-year contractual term multiplied times the remaining term as of the applicable valuation date, and in the case of underwater stock options, an expected term set equal to the remaining term of the award, c) volatility based on the historical volatility of our stock price over a period equal to the expected term, and d) risk-free interest rates based on the implied yield on recently-issued U.S. Treasury zero-coupon bonds with a term comparable to the expected term. In all cases, these amounts were calculated in accordance with ASC Topic No. 718, Compensation – Stock Compensation. For additional information on the assumptions used to calculate the valuation of the awards, see the Notes to the Company’s audited financial statements contained in the Company’s Annual Report on Form 10-K for the fiscal year ended December 31, 2024 and prior fiscal years. |
|
|
|
|
|
| Non-PEO NEO Average Total Compensation Amount |
$ 1,805,805
|
$ 1,798,061
|
$ 1,909,348
|
$ 2,150,242
|
$ 2,230,205
|
| Non-PEO NEO Average Compensation Actually Paid Amount |
$ 2,165,676
|
1,543,434
|
1,434,592
|
2,418,007
|
1,665,757
|
| Adjustment to Non-PEO NEO Compensation Footnote |
Compensation actually paid to our NEOs represents the “Total” compensation reported in the Summary Compensation Table for the applicable fiscal year (“FY”), as adjusted as follows: | | | | | | | | | | | | | | | | | | | | | | | | | | | | | | | | | | | | | 2020 | | 2021 | | 2022 | | 2023 | | 2024 | | | | | | Average | | | | | Average | | | | | | | Average | | | | | Average | | | | | Average | | | | | | | Non-PEO | | | | | Non-PEO | | PEO | | PEO | | Non-PEO | | | | Non-PEO | | | | Non-PEO | | Adjustments (a) | | PEO | | NEOs | | PEO | | NEOs | | (Kenney) | | (Lyons) | | NEOs | | PEO | | NEOs | | PEO | | NEOs | | Deduction for Amounts Reported under the “Stock Awards” and “Option Awards” Columns in the Summary Compensation Table for Applicable FY | | $ | (3,711,680) | | $ | (672,742) | | $ | (4,732,100) | | $ | (819,143) | | $ | (5,119,282) | | $ | (3,096,428) | | $ | (802,187) | | $ | (3,603,404) | | $ | (738,939) | | $ | (4,080,362) | | $ | (883,331) | | Increase based on ASC 718 Fair Value of Awards Granted during Applicable FY that Remain Unvested as of Applicable FY End, determined as of Applicable FY End | | $ | 4,033,698 | | $ | 731,108 | | $ | 5,215,423 | | $ | 902,825 | | $ | 724,813 | | $ | 3,188,799 | | $ | 623,923 | | $ | 3,321,372 | | $ | 680,948 | | $ | 4,316,560 | | $ | 934,492 | | Increase based on ASC 718 Fair Value of Awards Granted during Applicable FY that Vested during Applicable FY, determined as of Vesting Date | | $ | — | | $ | — | | $ | — | | $ | — | | $ | 682,021 | | $ | — | | $ | 18,517 | | $ | — | | $ | — | | $ | — | | $ | — | | Increase/deduction for Awards Granted during Prior FY that were Outstanding and Unvested as of Applicable FY End, determined based on change in ASC 718 Fair Value from Prior FY End to Applicable FY End | | $ | (751,099) | | $ | (137,477) | | $ | (250,914) | | $ | (47,142) | | $ | (1,099,553) | | $ | (451,230) | | $ | (395,281) | | $ | (90,196) | | $ | 14,411 | | $ | 982,055 | | $ | 249,659 | | Increase/deduction for Awards Granted during Prior FY that Vested During Applicable FY, determined based on change in ASC 718 Fair Value from Prior FY End to Vesting Date | | $ | 558,613 | | $ | 98,045 | | $ | 1,142,195 | | $ | 230,193 | | $ | 319,898 | | $ | 77,046 | | $ | 139,484 | | $ | (131,861) | | $ | (46,859) | | $ | 79,514 | | $ | 27,885 | | Deduction of ASC 718 Fair Value of Awards Granted during Prior FY that were Forfeited during Applicable FY, determined as of Prior FY End | | $ | — | | $ | — | | $ | — | | $ | — | | $ | (3,603,913) | | $ | — | | $ | (97,972) | | $ | — | | $ | — | | $ | — | | $ | — | | Increase based on Dividends Paid to the Executive during Applicable FY on outstanding equity awards | | $ | — | | $ | — | | $ | — | | $ | — | | $ | — | | $ | — | | $ | — | | $ | — | | $ | — | | $ | — | | $ | — | | Increase based on Incremental Fair Value of Options Modified during Applicable FY | | $ | — | | $ | — | | $ | — | | $ | — | | $ | — | | $ | — | | $ | — | | $ | — | | $ | — | | $ | — | | $ | — | | Deduction for Change in the Actuarial Present Values reported under the “Change in Pension Value and Nonqualified Deferred Compensation Earnings” Column of the Summary Compensation Table for Applicable FY | | $ | (1,716,441) | | $ | (711,706) | | $ | (467,804) | | $ | (157,910) | | $ | (250,696) | | $ | — | | $ | (63,023) | | $ | (1,081,846) | | $ | (226,300) | | $ | (835,080) | | $ | (39,871) | | Increase for Service Cost and, if applicable, Prior Service Cost for Pension Plans | | $ | 385,534 | | $ | 128,325 | | $ | 451,318 | | $ | 158,942 | | $ | 140,217 | | $ | 185,460 | | $ | 101,783 | | $ | 205,624 | | $ | 62,112 | | $ | 244,285 | | $ | 71,037 | | TOTAL ADJUSTMENTS | | $ | (1,201,375) | | $ | (564,448) | | $ | 1,358,118 | | $ | 267,766 | | $ | (8,206,494) | | $ | (96,353) | | $ | (474,756) | | $ | (1,380,311) | | $ | (254,628) | | $ | 706,972 | | $ | 359,871 | |
(a) | Fair value or change in fair value, as applicable, of equity awards in the “Compensation Actually Paid” columns was determined by reference to (1) for performance stock units (and RSUs, if any), the average of the high and low values of our common stock on applicable year-end date(s) or, in the case of vesting dates, the closing price on the applicable vesting date(s) multiplied by the probability of achievement as of the applicable date, and (2) for stock options, a value derived using the Black-Scholes option pricing model and the present value of dividends we expect to pay over the expected term of the award as of the applicable year-end or vesting date(s), determined based on the same methodology as used to determine grant date fair value of such stock options for financial statement purposes modified to obtain the values as of the relevant valuation dates. The Black-Scholes option pricing model assumptions were determined as follows: a) the average of the high and low values of our common stock on the applicable valuation date as of the current market price, b) in the case of in the money options, an expected term equal to the original ratio of expected term relative to the seven-year contractual term multiplied times the remaining term as of the applicable valuation date, and in the case of underwater stock options, an expected term set equal to the remaining term of the award, c) volatility based on the historical volatility of our stock price over a period equal to the expected term, and d) risk-free interest rates based on the implied yield on recently-issued U.S. Treasury zero-coupon bonds with a term comparable to the expected term. In all cases, these amounts were calculated in accordance with ASC Topic No. 718, Compensation – Stock Compensation. For additional information on the assumptions used to calculate the valuation of the awards, see the Notes to the Company’s audited financial statements contained in the Company’s Annual Report on Form 10-K for the fiscal year ended December 31, 2024 and prior fiscal years. |
|
|
|
|
|
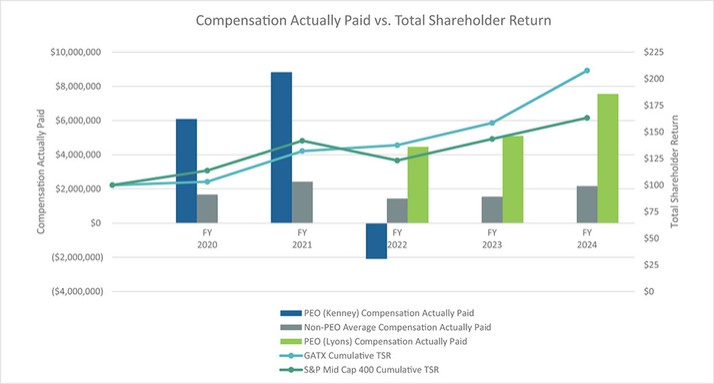
| Compensation Actually Paid vs. Total Shareholder Return |
|
|
|
|
|
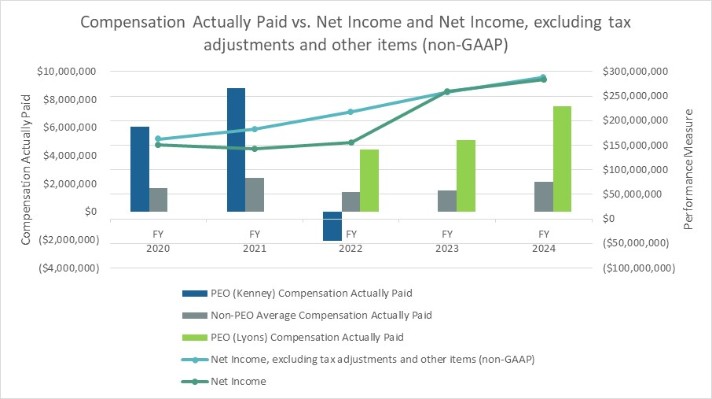
| Compensation Actually Paid vs. Net Income |
|
|
|
|
|
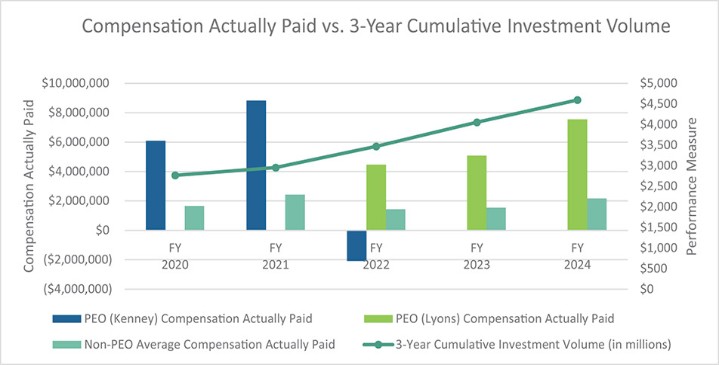
| Compensation Actually Paid vs. Company Selected Measure |
|
|
|
|
|
| Tabular List, Table |
Pay Versus Performance Tabular List We believe the following performance measures represent the most important financial performance measures used by us to link compensation actually paid to our NEOs for the fiscal year ended December 31, 2024: | ● | Net income, excluding tax adjustments and other items (non-GAAP) |
| ● | Three-year cumulative investment volume |
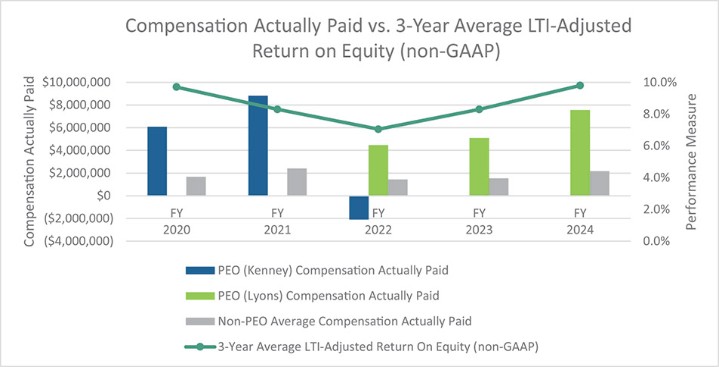
| ● | Three-year average LTI-adjusted return on equity (non-GAAP) |
|
|
|
|
|
| Total Shareholder Return Amount |
$ 207.68
|
158.5
|
137.55
|
132.04
|
103.21
|
| Peer Group Total Shareholder Return Amount |
163.3
|
143.34
|
123.1
|
141.7
|
113.61
|
| Net Income (Loss) |
$ 284,184,000
|
$ 259,169,000
|
$ 155,923,000
|
$ 143,093,000.000
|
$ 151,306,000
|
| Company Selected Measure Amount |
288,079,000.000
|
257,602,000
|
217,694,000
|
182,186,000
|
162,515,000
|
| Measure:: 1 |
|
|
|
|
|
| Pay vs Performance Disclosure |
|
|
|
|
|
| Name |
Net income, excluding tax adjustments and other items (non-GAAP)
|
|
|
|
|
| Non-GAAP Measure Description |
Net income, excluding tax adjustments and other items (non-GAAP), and three-year average LTI-adjusted return on equity are non-GAAP measures. For a reconciliation of these non-GAAP measures to the most comparable GAAP measures, please see Exhibit A to this Proxy Statement. Investment volume is a GAAP measure.
|
|
|
|
|
| Measure:: 2 |
|
|
|
|
|
| Pay vs Performance Disclosure |
|
|
|
|
|
| Compensation Actually Paid vs. Other Measure |
|
|
|
|
|
| Name |
Three-year cumulative investment volume
|
|
|
|
|
| Measure:: 3 |
|
|
|
|
|
| Pay vs Performance Disclosure |
|
|
|
|
|
| Compensation Actually Paid vs. Other Measure |
|
|
|
|
|
| Name |
Three-year average LTI-adjusted return on equity (non-GAAP)
|
|
|
|
|
| Brian A. Kenney |
|
|
|
|
|
| Pay vs Performance Disclosure |
|
|
|
|
|
| PEO Total Compensation Amount |
|
|
$ 6,120,956
|
$ 7,464,484
|
$ 7,286,765
|
| PEO Actually Paid Compensation Amount |
|
|
(2,085,538)
|
8,822,603
|
6,085,390
|
| Robert C. Lyons |
|
|
|
|
|
| Pay vs Performance Disclosure |
|
|
|
|
|
| PEO Total Compensation Amount |
$ 6,846,635
|
$ 6,472,498
|
4,559,380
|
|
|
| PEO Actually Paid Compensation Amount |
7,553,607
|
5,092,187
|
4,463,028
|
|
|
| PEO | Total Adjustments |
|
|
|
|
|
| Pay vs Performance Disclosure |
|
|
|
|
|
| Adjustment to Compensation, Amount |
706,972
|
(1,380,311)
|
|
1,358,118
|
(1,201,375)
|
| PEO | Increase for Service Cost and, if applicable, Prior Service Cost for Pension Plans |
|
|
|
|
|
| Pay vs Performance Disclosure |
|
|
|
|
|
| Adjustment to Compensation, Amount |
244,285
|
205,624
|
|
451,318
|
385,534
|
| PEO | Deduction for Change in the Actuarial Present values reported under the Change in Pension Value and Nonqualified Deferred Compensation Earnings Column of the Summary Compensation Table |
|
|
|
|
|
| Pay vs Performance Disclosure |
|
|
|
|
|
| Adjustment to Compensation, Amount |
(835,080)
|
(1,081,846)
|
|
(467,804)
|
(1,716,441)
|
| PEO | Increase/deduction based on ASC 718 Fair Value of Prior FY Awards that Vested During the Applicable FY, as of Vesting Date as of Compared to Valuation as of Prior FY End |
|
|
|
|
|
| Pay vs Performance Disclosure |
|
|
|
|
|
| Adjustment to Compensation, Amount |
79,514
|
(131,861)
|
|
1,142,195
|
558,613
|
| PEO | Increase/deduction based on ASC 718 Fair Value of Outstanding Unvested Prior FY Awards as of Applicable FY End as of Compared to Valuation as of Prior FY End |
|
|
|
|
|
| Pay vs Performance Disclosure |
|
|
|
|
|
| Adjustment to Compensation, Amount |
982,055
|
(90,196)
|
|
(250,914)
|
(751,099)
|
| PEO | Increase based on ASC 718 Fair Value of Awards Granted during Applicable FY that Remain Unvested as of Applicable FY End as of Applicable FY End |
|
|
|
|
|
| Pay vs Performance Disclosure |
|
|
|
|
|
| Adjustment to Compensation, Amount |
4,316,560
|
3,321,372
|
|
5,215,423
|
4,033,698
|
| PEO | Deduction for ASC 718 Fair Value as of Grant Date Reported under the Stock Awards and Option Awards Columns in the Summary Compensation Table |
|
|
|
|
|
| Pay vs Performance Disclosure |
|
|
|
|
|
| Adjustment to Compensation, Amount |
(4,080,362)
|
(3,603,404)
|
|
(4,732,100)
|
(3,711,680)
|
| PEO | Brian A. Kenney | Total Adjustments |
|
|
|
|
|
| Pay vs Performance Disclosure |
|
|
|
|
|
| Adjustment to Compensation, Amount |
|
|
(8,206,494)
|
|
|
| PEO | Brian A. Kenney | Increase for Service Cost and, if applicable, Prior Service Cost for Pension Plans |
|
|
|
|
|
| Pay vs Performance Disclosure |
|
|
|
|
|
| Adjustment to Compensation, Amount |
|
|
140,217
|
|
|
| PEO | Brian A. Kenney | Deduction for Change in the Actuarial Present values reported under the Change in Pension Value and Nonqualified Deferred Compensation Earnings Column of the Summary Compensation Table |
|
|
|
|
|
| Pay vs Performance Disclosure |
|
|
|
|
|
| Adjustment to Compensation, Amount |
|
|
(250,696)
|
|
|
| PEO | Brian A. Kenney | Deduction of ASC 718 Fair Value of Awards Granted during Prior FY that were Forfeited during Applicable FY, determined as of Prior FY End |
|
|
|
|
|
| Pay vs Performance Disclosure |
|
|
|
|
|
| Adjustment to Compensation, Amount |
|
|
(3,603,913)
|
|
|
| PEO | Brian A. Kenney | Increase/deduction based on ASC 718 Fair Value of Prior FY Awards that Vested During the Applicable FY, as of Vesting Date as of Compared to Valuation as of Prior FY End |
|
|
|
|
|
| Pay vs Performance Disclosure |
|
|
|
|
|
| Adjustment to Compensation, Amount |
|
|
319,898
|
|
|
| PEO | Brian A. Kenney | Increase/deduction based on ASC 718 Fair Value of Outstanding Unvested Prior FY Awards as of Applicable FY End as of Compared to Valuation as of Prior FY End |
|
|
|
|
|
| Pay vs Performance Disclosure |
|
|
|
|
|
| Adjustment to Compensation, Amount |
|
|
(1,099,553)
|
|
|
| PEO | Brian A. Kenney | Increase based on ASC 718 Fair Value of Awards Granted during Applicable FY that Vested during Applicable FY as of Vesting Date |
|
|
|
|
|
| Pay vs Performance Disclosure |
|
|
|
|
|
| Adjustment to Compensation, Amount |
|
|
682,021
|
|
|
| PEO | Brian A. Kenney | Increase based on ASC 718 Fair Value of Awards Granted during Applicable FY that Remain Unvested as of Applicable FY End as of Applicable FY End |
|
|
|
|
|
| Pay vs Performance Disclosure |
|
|
|
|
|
| Adjustment to Compensation, Amount |
|
|
724,813
|
|
|
| PEO | Brian A. Kenney | Deduction for ASC 718 Fair Value as of Grant Date Reported under the Stock Awards and Option Awards Columns in the Summary Compensation Table |
|
|
|
|
|
| Pay vs Performance Disclosure |
|
|
|
|
|
| Adjustment to Compensation, Amount |
|
|
(5,119,282)
|
|
|
| PEO | Robert C. Lyons | Total Adjustments |
|
|
|
|
|
| Pay vs Performance Disclosure |
|
|
|
|
|
| Adjustment to Compensation, Amount |
|
|
(96,353)
|
|
|
| PEO | Robert C. Lyons | Increase for Service Cost and, if applicable, Prior Service Cost for Pension Plans |
|
|
|
|
|
| Pay vs Performance Disclosure |
|
|
|
|
|
| Adjustment to Compensation, Amount |
|
|
185,460
|
|
|
| PEO | Robert C. Lyons | Increase/deduction based on ASC 718 Fair Value of Prior FY Awards that Vested During the Applicable FY, as of Vesting Date as of Compared to Valuation as of Prior FY End |
|
|
|
|
|
| Pay vs Performance Disclosure |
|
|
|
|
|
| Adjustment to Compensation, Amount |
|
|
77,046
|
|
|
| PEO | Robert C. Lyons | Increase/deduction based on ASC 718 Fair Value of Outstanding Unvested Prior FY Awards as of Applicable FY End as of Compared to Valuation as of Prior FY End |
|
|
|
|
|
| Pay vs Performance Disclosure |
|
|
|
|
|
| Adjustment to Compensation, Amount |
|
|
(451,230)
|
|
|
| PEO | Robert C. Lyons | Increase based on ASC 718 Fair Value of Awards Granted during Applicable FY that Remain Unvested as of Applicable FY End as of Applicable FY End |
|
|
|
|
|
| Pay vs Performance Disclosure |
|
|
|
|
|
| Adjustment to Compensation, Amount |
|
|
3,188,799
|
|
|
| PEO | Robert C. Lyons | Deduction for ASC 718 Fair Value as of Grant Date Reported under the Stock Awards and Option Awards Columns in the Summary Compensation Table |
|
|
|
|
|
| Pay vs Performance Disclosure |
|
|
|
|
|
| Adjustment to Compensation, Amount |
|
|
(3,096,428)
|
|
|
| Non-PEO NEO | Total Adjustments |
|
|
|
|
|
| Pay vs Performance Disclosure |
|
|
|
|
|
| Adjustment to Compensation, Amount |
359,871
|
(254,628)
|
(474,756)
|
267,766
|
(564,448)
|
| Non-PEO NEO | Increase for Service Cost and, if applicable, Prior Service Cost for Pension Plans |
|
|
|
|
|
| Pay vs Performance Disclosure |
|
|
|
|
|
| Adjustment to Compensation, Amount |
71,037
|
62,112
|
101,783
|
158,942
|
128,325
|
| Non-PEO NEO | Deduction for Change in the Actuarial Present values reported under the Change in Pension Value and Nonqualified Deferred Compensation Earnings Column of the Summary Compensation Table |
|
|
|
|
|
| Pay vs Performance Disclosure |
|
|
|
|
|
| Adjustment to Compensation, Amount |
(39,871)
|
(226,300)
|
(63,023)
|
(157,910)
|
(711,706)
|
| Non-PEO NEO | Deduction of ASC 718 Fair Value of Awards Granted during Prior FY that were Forfeited during Applicable FY, determined as of Prior FY End |
|
|
|
|
|
| Pay vs Performance Disclosure |
|
|
|
|
|
| Adjustment to Compensation, Amount |
|
|
(97,972)
|
|
|
| Non-PEO NEO | Increase/deduction based on ASC 718 Fair Value of Prior FY Awards that Vested During the Applicable FY, as of Vesting Date as of Compared to Valuation as of Prior FY End |
|
|
|
|
|
| Pay vs Performance Disclosure |
|
|
|
|
|
| Adjustment to Compensation, Amount |
27,885
|
(46,859)
|
139,484
|
230,193
|
98,045
|
| Non-PEO NEO | Increase/deduction based on ASC 718 Fair Value of Outstanding Unvested Prior FY Awards as of Applicable FY End as of Compared to Valuation as of Prior FY End |
|
|
|
|
|
| Pay vs Performance Disclosure |
|
|
|
|
|
| Adjustment to Compensation, Amount |
249,659
|
14,411
|
(395,281)
|
(47,142)
|
(137,477)
|
| Non-PEO NEO | Increase based on ASC 718 Fair Value of Awards Granted during Applicable FY that Vested during Applicable FY as of Vesting Date |
|
|
|
|
|
| Pay vs Performance Disclosure |
|
|
|
|
|
| Adjustment to Compensation, Amount |
|
|
18,517
|
|
|
| Non-PEO NEO | Increase based on ASC 718 Fair Value of Awards Granted during Applicable FY that Remain Unvested as of Applicable FY End as of Applicable FY End |
|
|
|
|
|
| Pay vs Performance Disclosure |
|
|
|
|
|
| Adjustment to Compensation, Amount |
934,492
|
680,948
|
623,923
|
902,825
|
731,108
|
| Non-PEO NEO | Deduction for ASC 718 Fair Value as of Grant Date Reported under the Stock Awards and Option Awards Columns in the Summary Compensation Table |
|
|
|
|
|
| Pay vs Performance Disclosure |
|
|
|
|
|
| Adjustment to Compensation, Amount |
$ (883,331)
|
$ (738,939)
|
$ (802,187)
|
$ (819,143)
|
$ (672,742)
|
