false
0001163739
0001163739
2024-02-06
2024-02-06
iso4217:USD
xbrli:shares
iso4217:USD
xbrli:shares
UNITED
STATES
SECURITIES
AND EXCHANGE COMMISSION
Washington,
D.C. 20549
Form 8-K
CURRENT
REPORT
PURSUANT
TO SECTION 13 OR 15(d) OF THE
SECURITIES
EXCHANGE ACT OF 1934
Date of Report (Date of earliest event reported):
February 6, 2024
NABORS INDUSTRIES LTD.
(Exact name of registrant as specified in
its charter)
| Bermuda |
|
001-32657 |
|
98-0363970 |
(State or Other Jurisdiction of
Incorporation or Organization) |
|
(Commission File Number) |
|
(I.R.S. Employer
Identification No.) |
Crown House
4 Par-la-Ville Road
Second Floor
Hamilton, HM08 Bermuda |
|
N/A |
| (Address of principal executive offices) |
|
(Zip Code) |
(441) 292-1510
(Registrant’s telephone number, including
area code)
N/A
(Former name or former address, if changed
since last report.)
Check the appropriate box below if the Form 8-K filing
is intended to simultaneously satisfy the filing obligation of the registrant under any of the following provisions:
| ¨ | Written
communications pursuant to Rule 425 under the Securities Act (17 CFR 230.425) |
| ¨ | Soliciting
material pursuant to Rule 14a-12 under the Exchange Act (17 CFR 240.14a-12) |
| ¨ | Pre-commencement
communications pursuant to Rule 14d-2(b) under the Exchange Act (17 CFR 240.14d-2(b)) |
| ¨ | Pre-commencement
communications pursuant to Rule 13e-4(c) under the Exchange Act (17 CFR 240.13e-4(c)) |
| Title of each class |
|
Trading Symbol(s) |
|
Name of exchange on which
registered |
| Common shares |
|
NBR |
|
NYSE |
Indicate by check mark whether the registrant is an emerging
growth company as defined in Rule 405 of the Securities Act of 1933 (§230.405 of this chapter) or Rule 12b-2 of
the Securities Exchange Act of 1934 (§240.12b-2 of this chapter).
Emerging growth
company ¨
If an emerging
growth company, indicate by check mark if the registrant has elected not to use the extended transition period for complying with
any new or revised financial accounting standards provided pursuant to Section 13(a) of the Exchange Act. ¨
Item 2.02 Results of Operations and
Financial Condition.
On February 6, 2023, Nabors
Industries Ltd. (“Nabors”) issued a press release announcing its results of operations for the three months ended December
31, 2023. A copy of that release is furnished herewith as Exhibit 99.1 and is incorporated herein by reference.
On February 7, 2023, Nabors
will hold a conference call at 10:00 a.m. Central Time, regarding the Company’s financial results for the quarter ended December
31, 2023. Information about the call including dial-in information, recording and replay of the call, and supplemental information is
available on the Investor Relations page of www.nabors.com.
The information in this Item
2.02, including Exhibits 99.1 and 99.2, shall not be deemed “filed” for purposes of Section 18 of the Securities Exchange
Act, of 1934 or otherwise subject to liabilities of that Section or Sections 11 and 12(a)(2) of the Securities Act of 1933.
Item
9.01 Financial Statements and Exhibits.
(d) Exhibits.
SIGNATURES
Pursuant to the requirements of the Securities
Exchange Act of 1934, the Registrant has duly caused this report to be signed on its behalf by the undersigned hereunto duly authorized.
| |
NABORS INDUSTRIES LTD. |
| |
|
| Date: February 6, 2024 |
By: |
/s/ Mark D. Andrews |
| |
|
Name: Mark D. Andrews |
| |
|
Title: Corporate Secretary |
Exhibit 99.1
 |
NEWS RELEASE |
Nabors Announces
Fourth Quarter 2023 Results
HAMILTON,
Bermuda, February 6, 2024 /PRNewswire/ - Nabors Industries Ltd. (“Nabors”
or the “Company”) (NYSE: NBR) today reported fourth quarter 2023 operating revenues of $726 million, compared to operating
revenues of $734 million in the third quarter. The net loss attributable to Nabors shareholders for the quarter was $17 million, compared
to a net loss of $49 million in the third quarter. This equates to a loss of $2.70 per diluted share, compared to a loss per diluted share
of $6.26 in the third quarter. The fourth quarter results included a gain, related to mark-to-market treatment of Nabors warrants, of
$10 million, or $1.14 per diluted share, compared to a charge of $8 million, or $0.86 per diluted share, in the third quarter. Fourth
quarter adjusted EBITDA was $230 million, compared to $210 million in the previous quarter.
Full-year
2023 operating revenues were $3.0 billion, compared to $2.7 billion in the prior year. This 13% overall increase was driven by growth
in all company segments. Nabors Drilling Solutions and Rig Technologies both expanded by 24%. U.S. Drilling revenue increased by 10%,
while International Drilling was 12% higher than in 2022.
For the
full year 2023, the net loss attributable to Nabors shareholders was $11.8 million, compared to a loss of $350.3 million in 2022. Adjusted
operating income improved to $269.9 million from $44.3 million. Adjusted EBITDA for 2023 was $915 million, compared to $709 million in
the prior year, which translates into 29% year-on-year growth.
Anthony G. Petrello, Nabors Chairman,
CEO and President, commented, “Our fourth quarter operating results exceeded our expectations across all of our segments. In the
U.S., daily rig margins in the Lower 48 increased sequentially, as daily revenue expanded and daily expenses were lower. Similarly, daily
margins in our International business widened.
Pricing in the Lower 48 market
held firm, as utilization of the highest specification rigs remained high. Average rig count was slightly below our estimates, as several
rigs started later in the quarter than anticipated. In our International segment, rig count increased as deployments in Saudi Arabia and
Colombia contributed. The International daily margin expanded, driven by better overall operating performance, and specifically by the
newbuild deployments in Saudi Arabia. The improvement in our Drilling Solutions segment largely reflected growth from the third party
and international markets. Rig Technologies benefitted from higher volumes in both capital equipment and the aftermarket.”
|
NEWS RELEASE |
Highlights
| o | Nabors Drilling Solutions was selected by a major operator in the Middle East to deploy NDS’s rig
automation technology. Initially, the award covers five working rigs, with the potential for significant expansion. |
| o | ExxonMobil has selected Nabors to support its lithium production project in Arkansas. Nabors has commenced
operations on this project with one of its high-specification PACE®-X rigs. |
| o | One of the largest Lower 48 operators named a Nabors PACE®-X rig its Rig of the Year, for the second
consecutive year, based on its performance against rigs from six other drilling contractors. This award recognizes the Nabors crew and
rig technology for their accomplishments. |
| o | Nabors was selected to provide technical and operational support to a local drilling contractor in Libya,
under a Technical Services Agreement. Earlier in the year, this same contractor purchased two rigs from Nabors, which are now being deployed
in Libya. |
| o | Nabors and SLB (NYSE: SLB) jointly announced a collaboration to scale automated drilling solutions for
operators and drilling contractors. This integration of both companies’ platforms expands the breadth of drilling automation technologies
available to customers, and increases their flexibility to utilize existing rig control systems from either Nabors or SLB. The announcement
follows technology agreements earlier in 2023 with Corva and with Halliburton (NYSE: HAL). |
| o | Nabors Energy Transition Corporation, the special purpose acquisition company sponsored by Nabors, and
Vast Renewables Limited completed their previously announced business combination. |
Segment Results
The U.S.
Drilling segment reported fourth quarter adjusted EBITDA of $118.4 million, compared to $117.4 million in the third quarter. Nabors exited
the year with 74 rigs on revenue in the Lower 48 market, while the fourth quarter average rig count totaled 70. Daily adjusted gross margin
in the Lower 48 market averaged $16,240, an increase of $385 sequentially. This improvement reflected slightly higher daily revenue and
reduced operating expenses. For the full year, EBITDA margins for U.S. Drilling increased by 600 basis points to 44.2%.
International
Drilling adjusted EBITDA totaled $105.5 million, compared to $96.2 million in the third quarter. The additional rigs in Saudi Arabia and
Colombia drove the increase. International rig count averaged 80, up from 77 in the previous quarter. Daily adjusted gross margin for
the fourth quarter averaged $16,651, up approximately 6% from the third quarter, on improved operational performance.
Drilling
Solutions adjusted EBITDA increased sequentially by approximately $4.1 million, to $34.5 million. Revenue growth of 6% was led by a 13%
expansion in international operations. Drilling Solutions gross margin increased by 120 basis points to 52.4%.
In Rig
Technologies, adjusted EBITDA reached $8.8 million, a 22% sequential improvement. Seasonal increases in third-party equipment revenue
and higher aftermarket sales led to wider margins.
|
NEWS RELEASE |
Adjusted Free Cash
Flow
Adjusted free cash flow was $52
million in the fourth quarter, a $57 million improvement versus the prior period. Capital expenditures totaled $124 million, which included
$43 million for the newbuilds in Saudi Arabia. This compares to $157 million in the third quarter, including $52 million supporting the
newbuilds.
William Restrepo,
Nabors CFO, stated, “Results across our operations were impressive. EBITDA rebounded close to the levels of the first half
and was significantly above our projections. In the Lower 48, we were able to add the expected number of
rigs, albeit later in the quarter than we originally envisioned. Our revenue per day and daily gross margin improved sequentially. Market
pricing for rigs was stable, and our efforts to reduce costs paid off. Looking ahead to the first quarter, we expect a high level of rig
churn to keep our average rig count essentially in line with the fourth quarter exit rate. As operating rigs continue to reprice to the
current market, we expect some erosion in daily margin.
“Internationally we deployed
rigs at attractive pricing. Reduced operating expenses and improved execution, particularly in Saudi Arabia, drove higher daily gross
margins. In the first quarter, we expect newbuilds in Saudi Arabia and the initial startups in Algeria to increase our rig count.
“Drilling Solutions and
Rig Technologies fourth quarter results benefitted from strong performance software and casing running revenue, as well as higher seasonal
capital equipment shipments.
“During the fourth quarter,
we completed a $650 million senior note offering due in 2030. With the proceeds, we have already retired both of our nearest pending maturities:
the convertibles due in January 2024 and the senior notes due in 2025. Our next maturity is in 2026.
“As we enter 2024, we expect
to build on our 2023 results. In the U.S., our annual average rig count for 2024 should approach the prior year’s level. We have
a robust international deployment schedule in 2024, and the number of incremental opportunities continues to grow. Adoption of the NDS
portfolio is still expanding, particularly on third party rigs and in international markets. Increased global drilling activity should
benefit Rig Technologies. Additionally, increasing client focus on improving their operating efficiencies should drive demand for our
automation solutions, while their goal to simultaneously reduce their environmental impact should drive demand for our energy transition
offering.
“We still have a number
of open international tenders and potential upside in activity level for the Lower 48. While it is still early in the year, we do expect
to deliver a significant improvement in adjusted free cash flow, compared to the level of 2023. We plan to allocate the 2024 cash flow
generation to reducing our net debt.”
|
NEWS RELEASE |
Outlook
Nabors
expects the following metrics for the first quarter of 2024:
U.S.
Drilling
| o | Lower 48 average rig count of 73 - 75 rigs |
| o | Lower 48 daily adjusted gross margin of approximately $15,300 |
| o | Alaska and Gulf of Mexico adjusted EBITDA up by $1.5 to $2.0 million |
International
| o | Average rig count up by approximately two rigs versus the fourth quarter average |
| o | Daily adjusted gross margin of approximately $16,100 - $16,300 |
Drilling
Solutions
| o | Adjusted EBITDA of $30 - $31 million |
Rig Technologies
| o | Adjusted EBITDA of $5 - $6 million |
Capital
Expenditures
| o | Capital expenditures of $170 - $180 million, with approximately $50 million for the newbuilds in Saudi
Arabia |
Mr. Petrello
concluded, “As we look to 2024, we expect our financial performance to accelerate. International rig awards already in hand should
drive growth this year. We are currently in negotiations and tendering for a significant number of additional international rigs. Assuming
we are successful, those would provide further growth into and through 2025. At the same time, demand for our advanced technology solutions
is expanding across the global customer set. With these drivers, I am optimistic we are on the right path.”
About Nabors Industries
Nabors Industries
(NYSE: NBR) is a leading provider of advanced technology for the energy industry. With presence in more than 20 countries, Nabors has
established a global network of people, technology and equipment to deploy solutions that deliver safe, efficient and responsible energy
production. By leveraging its core competencies, particularly in drilling, engineering, automation, data science and manufacturing, Nabors
aims to innovate the future of energy and enable the transition to a lower-carbon world. Learn more about Nabors and its energy technology
leadership: www.nabors.com.
Forward-looking Statements
The information included
in this press release includes forward-looking statements within the meaning of the Securities Act of 1933 and the Securities Exchange
Act of 1934. Such forward-looking statements are subject to a number of risks and uncertainties, as disclosed by Nabors from time to time
in its filings with the Securities and Exchange Commission. As a result of these factors, Nabors' actual results may differ materially
from those indicated or implied by such forward-looking statements. The forward-looking statements contained in this press release
reflect management's estimates and beliefs as of the date of this press release. Nabors does not undertake to update these forward-looking
statements.
|
NEWS RELEASE |
Non-GAAP Disclaimer
This press release presents certain “non-GAAP” financial
measures. The components of these non-GAAP measures are computed by using amounts that are determined in accordance with accounting
principles generally accepted in the United States of America (“GAAP”). Adjusted operating income (loss) represents income
(loss) from continuing operations before income taxes, interest expense, investment income (loss), and other, net. Adjusted EBITDA is
computed similarly, but also excludes depreciation and amortization expenses. In addition, adjusted EBITDA and adjusted operating income
(loss) exclude certain cash expenses that the Company is obligated to make. Net debt is calculated as total debt minus the sum of cash,
cash equivalents and short-term investments.
Adjusted free cash flow represents net cash provided by operating activities
less cash used for capital expenditures, net of proceeds from sales of assets. Management believes that adjusted free cash flow is
an important liquidity measure for the company and that it is useful to investors and management as a measure of the company’s ability
to generate cash flow, after reinvesting in the company for future growth, that could be available for paying down debt or other financing
cash flows, such as dividends to shareholders. Management believes that this non-GAAP measure is useful information to investors
when comparing our cash flows with the cash flows of other companies.
Each of these non-GAAP measures has limitations and therefore should
not be used in isolation or as a substitute for the amounts reported in accordance with GAAP. However, management evaluates the performance
of its operating segments and the consolidated Company based on several criteria, including Adjusted EBITDA, adjusted operating income
(loss), net debt, and adjusted free cash flow, because it believes that these financial measures accurately reflect the Company’s
ongoing profitability and performance. Securities analysts and investors also use these measures as some of the metrics on which
they analyze the Company’s performance. Other companies in this industry may compute these measures differently. Reconciliations
of consolidated adjusted EBITDA and adjusted operating income (loss) to income (loss) from continuing operations before income taxes,
net debt to total debt, and adjusted free cash flow to net cash provided by operations, which are their nearest comparable GAAP financial
measures, are included in the tables at the end of this press release. We do not provide a forward-looking reconciliation of our
outlook for Segment Adjusted EBITDA, Segment Gross Margin or Adjusted Free Cash Flow, as the amount and significance of items required
to develop meaningful comparable GAAP financial measures cannot be estimated at this time without unreasonable efforts. These special
items could be meaningful.
Investor Contacts: William C. Conroy, CFA,
Vice President of Corporate Development & Investor Relations, +1 281-775-2423 or via e-mail william.conroy@nabors.com,
or Kara Peak, Director of Corporate Development & Investor Relations, +1 281-775-4954 or via email kara.peak@nabors.com.
To request investor materials, contact Nabors' corporate headquarters in Hamilton, Bermuda at +441-292-1510 or via e-mail mark.andrews@nabors.com
NABORS
INDUSTRIES LTD. AND SUBSIDIARIES
CONDENSED
CONSOLIDATED STATEMENTS OF INCOME (LOSS)
(Unaudited)
| | |
Three
Months Ended | | |
Year Ended | |
| | |
December 31, | | |
September 30, | | |
December 31, | |
| (In thousands, except per share amounts) | |
2023 | | |
2022 | | |
2023 | | |
2023 | | |
2022 | |
| Revenues and other income: | |
| | | |
| | | |
| | | |
| | | |
| | |
| Operating revenues | |
$ | 725,801 | | |
$ | 760,148 | | |
$ | 733,974 | | |
$ | 3,005,981 | | |
$ | 2,653,766 | |
| Investment income
(loss) | |
| 12,042 | | |
| 9,194 | | |
| 10,169 | | |
| 43,820 | | |
| 14,992 | |
| Total revenues and
other income | |
| 737,843 | | |
| 769,342 | | |
| 744,143 | | |
| 3,049,801 | | |
| 2,668,758 | |
| | |
| | | |
| | | |
| | | |
| | | |
| | |
| Costs and other deductions: | |
| | | |
| | | |
| | | |
| | | |
| | |
| Direct costs | |
| 424,769 | | |
| 457,184 | | |
| 447,751 | | |
| 1,790,380 | | |
| 1,666,004 | |
| General and administrative expenses | |
| 57,003 | | |
| 59,031 | | |
| 62,182 | | |
| 244,147 | | |
| 228,431 | |
| Research and engineering | |
| 13,926 | | |
| 13,911 | | |
| 14,016 | | |
| 56,297 | | |
| 49,939 | |
| Depreciation and amortization | |
| 161,228 | | |
| 168,841 | | |
| 161,337 | | |
| 645,294 | | |
| 665,072 | |
| Interest expense | |
| 49,938 | | |
| 44,245 | | |
| 44,042 | | |
| 185,285 | | |
| 177,895 | |
| Other, net | |
| 7,878 | | |
| 58,124 | | |
| 35,546 | | |
| (726 | ) | |
| 127,099 | |
| Total costs and other
deductions | |
| 714,742 | | |
| 801,336 | | |
| 764,874 | | |
| 2,920,677 | | |
| 2,914,440 | |
| | |
| | | |
| | | |
| | | |
| | | |
| | |
| Income (loss) before income taxes | |
| 23,101 | | |
| (31,994 | ) | |
| (20,731 | ) | |
| 129,124 | | |
| (245,682 | ) |
| Income tax expense
(benefit) | |
| 19,244 | | |
| 26,161 | | |
| 10,513 | | |
| 79,220 | | |
| 61,536 | |
| | |
| | | |
| | | |
| | | |
| | | |
| | |
| Net income (loss) | |
| 3,857 | | |
| (58,155 | ) | |
| (31,244 | ) | |
| 49,904 | | |
| (307,218 | ) |
| Less: Net (income)
loss attributable to noncontrolling interest | |
| (20,560 | ) | |
| (10,911 | ) | |
| (17,672 | ) | |
| (61,688 | ) | |
| (43,043 | ) |
| Net income (loss) attributable to Nabors | |
$ | (16,703 | ) | |
$ | (69,066 | ) | |
$ | (48,916 | ) | |
$ | (11,784 | ) | |
$ | (350,261 | ) |
| | |
| | | |
| | | |
| | | |
| | | |
| | |
| Earnings (losses) per share: | |
| | | |
| | | |
| | | |
| | | |
| | |
| Basic | |
$ | (2.70 | ) | |
$ | (7.87 | ) | |
$ | (6.26 | ) | |
$ | (5.49 | ) | |
$ | (40.52 | ) |
| Diluted | |
$ | (2.70 | ) | |
$ | (7.87 | ) | |
$ | (6.26 | ) | |
$ | (5.49 | ) | |
$ | (40.52 | ) |
| | |
| | | |
| | | |
| | | |
| | | |
| | |
| Weighted-average number of common shares outstanding: | |
| | | |
| | | |
| | | |
| | | |
| | |
| Basic | |
| 9,133 | | |
| 9,101 | | |
| 9,148 | | |
| 9,159 | | |
| 8,898 | |
| Diluted | |
| 9,133 | | |
| 9,101 | | |
| 9,148 | | |
| 9,159 | | |
| 8,898 | |
| | |
| | | |
| | | |
| | | |
| | | |
| | |
| Adjusted EBITDA | |
$ | 230,103 | | |
$ | 230,022 | | |
$ | 210,025 | | |
$ | 915,157 | | |
$ | 709,392 | |
| | |
| | | |
| | | |
| | | |
| | | |
| | |
| Adjusted operating income (loss) | |
$ | 68,875 | | |
$ | 61,181 | | |
$ | 48,688 | | |
$ | 269,863 | | |
$ | 44,320 | |
NABORS
INDUSTRIES LTD. AND SUBSIDIARIES
CONDENSED
CONSOLIDATED BALANCE SHEETS
(Unaudited)
| | |
December 31, | | |
September 30, | | |
December 31, | |
| (In thousands) | |
2023 | | |
2023 | | |
2022 | |
| ASSETS | |
| | | |
| | | |
| | |
| Current assets: | |
| | | |
| | | |
| | |
| Cash and short-term investments | |
$ | 1,070,178 | | |
$ | 406,643 | | |
$ | 452,315 | |
| Accounts receivable, net | |
| 347,837 | | |
| 324,970 | | |
| 327,397 | |
| Other current assets | |
| 227,663 | | |
| 228,941 | | |
| 220,911 | |
| Total current assets | |
| 1,645,678 | | |
| 960,554 | | |
| 1,000,623 | |
| Property, plant and equipment, net | |
| 2,898,728 | | |
| 2,945,964 | | |
| 3,026,100 | |
| Other long-term assets | |
| 733,559 | | |
| 820,332 | | |
| 703,131 | |
| Total assets | |
$ | 5,277,965 | | |
$ | 4,726,850 | | |
$ | 4,729,854 | |
| | |
| | | |
| | | |
| | |
| LIABILITIES AND EQUITY | |
| | | |
| | | |
| | |
| Current liabilities: | |
| | | |
| | | |
| | |
| Current debt | |
$ | 629,621 | | |
$ | - | | |
$ | - | |
| Trade accounts payable | |
| 294,442 | | |
| 287,228 | | |
| 314,041 | |
| Other current liabilities | |
| 289,918 | | |
| 241,475 | | |
| 282,349 | |
| Total current liabilities | |
| 1,213,981 | | |
| 528,703 | | |
| 596,390 | |
| Long-term debt | |
| 2,511,519 | | |
| 2,501,339 | | |
| 2,537,540 | |
| Other long-term liabilities | |
| 271,380 | | |
| 314,441 | | |
| 380,529 | |
| Total liabilities | |
| 3,996,880 | | |
| 3,344,483 | | |
| 3,514,459 | |
| | |
| | | |
| | | |
| | |
| Redeemable noncontrolling interest in subsidiary | |
| 739,075 | | |
| 834,195 | | |
| 678,604 | |
| | |
| | | |
| | | |
| | |
| Equity: | |
| | | |
| | | |
| | |
| Shareholders' equity | |
| 326,614 | | |
| 348,234 | | |
| 368,956 | |
| Noncontrolling interest | |
| 215,396 | | |
| 199,938 | | |
| 167,835 | |
| Total equity | |
| 542,010 | | |
| 548,172 | | |
| 536,791 | |
| Total liabilities
and equity | |
$ | 5,277,965 | | |
$ | 4,726,850 | | |
$ | 4,729,854 | |
NABORS
INDUSTRIES LTD. AND SUBSIDIARIES
SEGMENT
REPORTING
(Unaudited)
The following tables set forth certain information
with respect to our reportable segments and rig activity:
| | |
Three
Months Ended | | |
Year Ended | |
| | |
December 31, | | |
September 30, | | |
December 31, | |
| (In thousands, except rig activity) | |
2023 | | |
2022 | | |
2023 | | |
2023 | | |
2022 | |
| Operating revenues: | |
| | | |
| | | |
| | | |
| | | |
| | |
| U.S. Drilling | |
$ | 265,762 | | |
$ | 332,845 | | |
$ | 276,385 | | |
$ | 1,207,629 | | |
$ | 1,100,614 | |
| International Drilling | |
| 342,771 | | |
| 317,577 | | |
| 344,780 | | |
| 1,345,249 | | |
| 1,199,282 | |
| Drilling Solutions | |
| 77,028 | | |
| 71,307 | | |
| 72,831 | | |
| 301,757 | | |
| 243,349 | |
| Rig Technologies (1) | |
| 59,287 | | |
| 62,803 | | |
| 61,437 | | |
| 242,768 | | |
| 195,129 | |
| Other reconciling
items (2) | |
| (19,047 | ) | |
| (24,384 | ) | |
| (21,459 | ) | |
| (91,422 | ) | |
| (84,608 | ) |
| Total
operating revenues | |
$ | 725,801 | | |
$ | 760,148 | | |
$ | 733,974 | | |
$ | 3,005,981 | | |
$ | 2,653,766 | |
| | |
| | | |
| | | |
| | | |
| | | |
| | |
| Adjusted EBITDA: (3) | |
| | | |
| | | |
| | | |
| | | |
| | |
| U.S. Drilling | |
$ | 118,371 | | |
$ | 144,142 | | |
$ | 117,357 | | |
$ | 533,663 | | |
$ | 420,264 | |
| International Drilling | |
| 105,540 | | |
| 88,838 | | |
| 96,175 | | |
| 388,654 | | |
| 328,454 | |
| Drilling Solutions | |
| 34,502 | | |
| 30,336 | | |
| 30,419 | | |
| 129,591 | | |
| 98,699 | |
| Rig Technologies (1) | |
| 8,811 | | |
| 7,561 | | |
| 7,221 | | |
| 27,394 | | |
| 14,699 | |
| Other reconciling
items (4) | |
| (37,121 | ) | |
| (40,855 | ) | |
| (41,147 | ) | |
| (164,145 | ) | |
| (152,724 | ) |
| Total
adjusted EBITDA | |
$ | 230,103 | | |
$ | 230,022 | | |
$ | 210,025 | | |
$ | 915,157 | | |
$ | 709,392 | |
| | |
| | | |
| | | |
| | | |
| | | |
| | |
| Adjusted operating income (loss): (5) | |
| | | |
| | | |
| | | |
| | | |
| | |
| U.S. Drilling | |
$ | 51,494 | | |
$ | 68,293 | | |
$ | 49,582 | | |
$ | 262,353 | | |
$ | 108,506 | |
| International Drilling | |
| 18,642 | | |
| 1,750 | | |
| 9,862 | | |
| 40,868 | | |
| (879 | ) |
| Drilling Solutions | |
| 30,127 | | |
| 24,800 | | |
| 25,341 | | |
| 110,957 | | |
| 77,868 | |
| Rig Technologies (1) | |
| 5,788 | | |
| 6,118 | | |
| 4,995 | | |
| 19,529 | | |
| 8,906 | |
| Other reconciling
items (4) | |
| (37,176 | ) | |
| (39,780 | ) | |
| (41,092 | ) | |
| (163,844 | ) | |
| (150,081 | ) |
| Total
adjusted operating income (loss) | |
$ | 68,875 | | |
$ | 61,181 | | |
$ | 48,688 | | |
$ | 269,863 | | |
$ | 44,320 | |
| | |
| | | |
| | | |
| | | |
| | | |
| | |
| Rig activity: | |
| | | |
| | | |
| | | |
| | | |
| | |
| Average Rigs Working: (7) | |
| | | |
| | | |
| | | |
| | | |
| | |
| Lower 48 | |
| 70.3 | | |
| 95.1 | | |
| 73.7 | | |
| 79.6 | | |
| 90.0 | |
| Other
US | |
| 6.0 | | |
| 7.0 | | |
| 6.7 | | |
| 6.7 | | |
| 7.2 | |
| U.S. Drilling | |
| 76.3 | | |
| 102.1 | | |
| 80.4 | | |
| 86.3 | | |
| 97.2 | |
| International
Drilling | |
| 79.6 | | |
| 75.7 | | |
| 77.2 | | |
| 77.6 | | |
| 74.2 | |
| Total average rigs
working | |
| 155.9 | | |
| 177.8 | | |
| 157.6 | | |
| 163.9 | | |
| 171.4 | |
| | |
| | | |
| | | |
| | | |
| | | |
| | |
| Daily Rig Revenue: (6),(8) | |
| | | |
| | | |
| | | |
| | | |
| | |
| Lower 48 | |
$ | 35,776 | | |
$ | 32,719 | | |
$ | 35,697 | | |
$ | 36,202 | | |
$ | 27,836 | |
| Other
US | |
| 62,346 | | |
| 72,497 | | |
| 56,163 | | |
| 63,866 | | |
| 71,333 | |
| U.S. Drilling (10) | |
| 37,865 | | |
| 35,447 | | |
| 37,397 | | |
| 38,338 | | |
| 31,037 | |
| International Drilling | |
| 46,782 | | |
| 45,616 | | |
| 48,528 | | |
| 47,484 | | |
| 44,311 | |
| | |
| | | |
| | | |
| | | |
| | | |
| | |
| Daily Adjusted Gross Margin: (6),(9) | |
| | | |
| | | |
| | | |
| | | |
| | |
| Lower 48 | |
$ | 16,240 | | |
$ | 14,599 | | |
$ | 15,855 | | |
$ | 16,446 | | |
$ | 10,678 | |
| Other
US | |
| 34,641 | | |
| 36,592 | | |
| 27,631 | | |
| 33,850 | | |
| 37,062 | |
| U.S. Drilling (10) | |
| 17,687 | | |
| 16,107 | | |
| 16,833 | | |
| 17,790 | | |
| 12,625 | |
| International Drilling | |
| 16,651 | | |
| 14,902 | | |
| 15,778 | | |
| 15,992 | | |
| 14,257 | |
| (1) |
Includes our oilfield
equipment manufacturing activities. |
| |
|
|
|
|
|
|
|
| (2) |
Represents the
elimination of inter-segment transactions related to our Rig Technologies operating segment. |
| |
|
|
|
|
|
|
|
| (3) |
Adjusted EBITDA
represents net income (loss) before income tax expense (benefit), investment income (loss), interest expense, other, net and depreciation
and amortization. Adjusted EBITDA is a non-GAAP financial measure and should not be used in isolation or as a substitute for the
amounts reported in accordance with GAAP. In addition, adjusted EBITDA excludes certain cash expenses that the Company is obligated
to make. However, management evaluates the performance of its operating segments and the consolidated Company based on several criteria,
including adjusted EBITDA and adjusted operating income (loss), because it believes that these financial measures accurately reflect
the Company’s ongoing profitability and performance. Securities analysts and investors use this measure as one of
the metrics on which they analyze the Company’s performance. Other companies in this industry may compute these
measures differently. A reconciliation of this non-GAAP measure to net income (loss), which is the most closely comparable
GAAP measure, is provided in the table set forth immediately following the heading "Reconciliation of Non-GAAP Financial Measures
to Net Income (Loss)". |
| |
|
|
|
|
|
|
|
| (4) |
Represents the
elimination of inter-segment transactions and unallocated corporate expenses. |
| |
|
|
|
|
|
|
|
| (5) |
Adjusted operating
income (loss) represents net income (loss) before income tax expense (benefit), investment income (loss), interest expense and
other, net. Adjusted operating income (loss) is a non-GAAP financial measure and should not be used in isolation or as a substitute
for the amounts reported in accordance with GAAP. In addition, adjusted operating income (loss) excludes certain cash expenses that
the Company is obligated to make. However, management evaluates the performance of its operating segments and the consolidated Company
based on several criteria, including adjusted EBITDA and adjusted operating income (loss), because it believes that these financial
measures accurately reflect the Company’s ongoing profitability and performance. Securities analysts and investors
use this measure as one of the metrics on which they analyze the Company’s performance. Other companies in this
industry may compute these measures differently. A reconciliation of this non-GAAP measure to net income (loss), which
is the most closely comparable GAAP measure, is provided in the table set forth immediately following the heading "Reconciliation
of Non-GAAP Financial Measures to Net Income (Loss)". |
| |
|
|
|
|
|
|
|
| (6) |
Rig revenue days
represents the number of days the Company's rigs are contracted and performing under a contract during the period. These
would typically include days in which operating, standby and move revenue is earned. |
| |
|
|
|
|
|
|
|
| (7) |
Average rigs working
represents a measure of the average number of rigs operating during a given period. For example, one rig operating 45
days during a quarter represents approximately 0.5 average rigs working for the quarter. On an annual period, one rig
operating 182.5 days represents approximately 0.5 average rigs working for the year. Average rigs working can also be
calculated as rig revenue days during the period divided by the number of calendar days in the period. |
| |
|
|
|
|
|
|
|
| (8) |
Daily rig revenue
represents operating revenue, divided by the total number of revenue days during the quarter. |
| |
|
|
|
|
|
|
|
| (9) |
Daily adjusted
gross margin represents operating revenue less direct costs, divided by the total number of rig revenue days during the quarter. |
| |
|
|
|
|
|
|
|
| (10) |
The U.S. Drilling
segment includes the Lower 48, Alaska, and Gulf of Mexico operating areas. |
NABORS
INDUSTRIES LTD. AND SUBSIDIARIES
Reconciliation
of Earnings per Share
(Unaudited)
| | |
Three
Months Ended | | |
Year Ended | |
| | |
December 31, | | |
September 30, | | |
December 31, | |
| (in thousands, except per share amounts) | |
2023 | | |
2022 | | |
2023 | | |
2023 | | |
2022 | |
| | |
| | |
| | |
| | |
| | |
| |
| BASIC EPS: | |
| | | |
| | | |
| | | |
| | | |
| | |
| Net income (loss) (numerator): | |
| | | |
| | | |
| | | |
| | | |
| | |
| Income (loss), net of tax | |
$ | 3,857 | | |
$ | (58,155 | ) | |
$ | (31,244 | ) | |
$ | 49,904 | | |
$ | (307,218 | ) |
| Less: net (income) loss attributable to
noncontrolling interest | |
| (20,560 | ) | |
| (10,911 | ) | |
| (17,672 | ) | |
| (61,688 | ) | |
| (43,043 | ) |
| Less: deemed dividends to SPAC public shareholders | |
| (458 | ) | |
| — | | |
| (823 | ) | |
| (8,638 | ) | |
| — | |
| Less: accrued distribution
on redeemable noncontrolling interest in subsidiary | |
| (7,517 | ) | |
| (2,602 | ) | |
| (7,517 | ) | |
| (29,824 | ) | |
| (10,324 | ) |
| Numerator for basic earnings per share: | |
| | | |
| | | |
| | | |
| | | |
| | |
| Adjusted income (loss),
net of tax - basic | |
$ | (24,678 | ) | |
$ | (71,668 | ) | |
$ | (57,256 | ) | |
$ | (50,246 | ) | |
$ | (360,585 | ) |
| | |
| | | |
| | | |
| | | |
| | | |
| | |
| Weighted-average number of shares outstanding - basic | |
| 9,133 | | |
| 9,101 | | |
| 9,148 | | |
| 9,159 | | |
| 8,898 | |
| Earnings (losses) per share: | |
| | | |
| | | |
| | | |
| | | |
| | |
| Total Basic | |
$ | (2.70 | ) | |
$ | (7.87 | ) | |
$ | (6.26 | ) | |
$ | (5.49 | ) | |
$ | (40.52 | ) |
| | |
| | | |
| | | |
| | | |
| | | |
| | |
| DILUTED EPS: | |
| | | |
| | | |
| | | |
| | | |
| | |
| Adjusted income (loss), net of tax -
diluted | |
$ | (24,678 | ) | |
$ | (71,668 | ) | |
$ | (57,256 | ) | |
$ | (50,246 | ) | |
$ | (360,585 | ) |
| | |
| | | |
| | | |
| | | |
| | | |
| | |
| Weighted-average number of shares outstanding - diluted | |
| 9,133 | | |
| 9,101 | | |
| 9,148 | | |
| 9,159 | | |
| 8,898 | |
| Earnings (losses) per share: | |
| | | |
| | | |
| | | |
| | | |
| | |
| Total Diluted | |
$ | (2.70 | ) | |
$ | (7.87 | ) | |
$ | (6.26 | ) | |
$ | (5.49 | ) | |
$ | (40.52 | ) |
NABORS
INDUSTRIES LTD. AND SUBSIDIARIES
NON-GAAP
FINANCIAL MEASURES
RECONCILIATION
OF ADJUSTED EBITDA BY SEGMENT TO ADJUSTED OPERATING INCOME (LOSS) BY SEGMENT
(Unaudited)
| | |
Three
Months Ended December 30, 2023 | |
| (In
thousands) | |
U.S.
Drilling | | |
International
Drilling | | |
Drilling
Solutions | | |
Rig
Technologies | | |
Other
reconciling
items | | |
Total | |
| Adjusted operating income (loss) | |
$ | 51,494 | | |
$ | 18,642 | | |
$ | 30,127 | | |
$ | 5,788 | | |
$ | (37,176 | ) | |
$ | 68,875 | |
| Depreciation and amortization | |
| 66,877 | | |
| 86,898 | | |
| 4,375 | | |
| 3,023 | | |
| 55 | | |
| 161,228 | |
| Adjusted EBITDA | |
$ | 118,371 | | |
$ | 105,540 | | |
$ | 34,502 | | |
$ | 8,811 | | |
$ | (37,121 | ) | |
$ | 230,103 | |
| | |
Three Months Ended December 30, 2022 | |
| | |
U.S.
Drilling | | |
International
Drilling | | |
Drilling
Solutions | | |
Rig
Technologies | | |
Other
reconciling
items | | |
Total | |
| Adjusted operating income (loss) | |
$ | 68,293 | | |
$ | 1,750 | | |
$ | 24,800 | | |
$ | 6,118 | | |
$ | (39,780 | ) | |
$ | 61,181 | |
| Depreciation and amortization | |
| 75,849 | | |
| 87,088 | | |
| 5,536 | | |
| 1,443 | | |
| (1,075 | ) | |
| 168,841 | |
| Adjusted EBITDA | |
$ | 144,142 | | |
$ | 88,838 | | |
$ | 30,336 | | |
$ | 7,561 | | |
$ | (40,855 | ) | |
$ | 230,022 | |
| | |
Three Months Ended September 30, 2023 | |
| | |
U.S.
Drilling | | |
International
Drilling | | |
Drilling
Solutions | | |
Rig
Technologies | | |
Other
reconciling
items | | |
Total | |
| Adjusted operating income (loss) | |
$ | 49,582 | | |
$ | 9,862 | | |
$ | 25,341 | | |
$ | 4,995 | | |
$ | (41,092 | ) | |
$ | 48,688 | |
| Depreciation and amortization | |
| 67,775 | | |
| 86,313 | | |
| 5,078 | | |
| 2,226 | | |
| (55 | ) | |
| 161,337 | |
| Adjusted EBITDA | |
$ | 117,357 | | |
$ | 96,175 | | |
$ | 30,419 | | |
$ | 7,221 | | |
$ | (41,147 | ) | |
$ | 210,025 | |
| | |
Year Ended December 31, 2023 | |
| | |
U.S.
Drilling | | |
International
Drilling | | |
Drilling
Solutions | | |
Rig
Technologies | | |
Other
reconciling
items | | |
Total | |
| Adjusted operating income (loss) | |
$ | 262,353 | | |
$ | 40,868 | | |
$ | 110,957 | | |
$ | 19,529 | | |
$ | (163,844 | ) | |
$ | 269,863 | |
| Depreciation and amortization | |
| 271,310 | | |
| 347,786 | | |
| 18,634 | | |
| 7,865 | | |
| (301 | ) | |
| 645,294 | |
| Adjusted EBITDA | |
$ | 533,663 | | |
$ | 388,654 | | |
$ | 129,591 | | |
$ | 27,394 | | |
$ | (164,145 | ) | |
$ | 915,157 | |
| | |
Year Ended December 31, 2022 | |
| | |
U.S.
Drilling | | |
International
Drilling | | |
Drilling
Solutions | | |
Rig
Technologies | | |
Other
reconciling
items | | |
Total | |
| Adjusted operating income (loss) | |
$ | 108,506 | | |
$ | (879 | ) | |
$ | 77,868 | | |
$ | 8,906 | | |
$ | (150,081 | ) | |
$ | 44,320 | |
| Depreciation and amortization | |
| 311,758 | | |
| 329,333 | | |
| 20,831 | | |
| 5,793 | | |
| (2,643 | ) | |
| 665,072 | |
| Adjusted EBITDA | |
$ | 420,264 | | |
$ | 328,454 | | |
$ | 98,699 | | |
$ | 14,699 | | |
$ | (152,724 | ) | |
$ | 709,392 | |
NABORS
INDUSTRIES LTD. AND SUBSIDIARIES
NON-GAAP
FINANCIAL MEASURES
RECONCILIATION
OF ADJUSTED GROSS MARGIN BY SEGMENT TO ADJUSTED OPERATING INCOME (LOSS) BY SEGMENT
(Unaudited)
| | |
Three
Months Ended | | |
Year Ended | |
| | |
December 31, | | |
September 30, | | |
December 31, | |
| (In thousands) | |
2023 | | |
2022 | | |
2023 | | |
2023 | | |
2022 | |
| Lower 48 - U.S. Drilling | |
| | | |
| | | |
| | | |
| | | |
| | |
| Adjusted operating income
(loss) | |
$ | 40,108 | | |
$ | 58,299 | | |
$ | 40,366 | | |
$ | 215,041 | | |
$ | 68,317 | |
| Plus: General and administrative costs | |
| 4,087 | | |
| 4,977 | | |
| 5,239 | | |
| 19,590 | | |
| 18,960 | |
| Plus: Research
and engineering | |
| 1,276 | | |
| 1,637 | | |
| 1,389 | | |
| 5,373 | | |
| 6,539 | |
| GAAP Gross Margin | |
| 45,471 | | |
| 64,913 | | |
| 46,994 | | |
| 240,004 | | |
| 93,816 | |
| Plus: Depreciation
and amortization | |
| 59,545 | | |
| 62,768 | | |
| 60,447 | | |
| 238,033 | | |
| 256,907 | |
| Adjusted
gross margin | |
$ | 105,016 | | |
$ | 127,681 | | |
$ | 107,441 | | |
$ | 478,037 | | |
$ | 350,723 | |
| | |
| | | |
| | | |
| | | |
| | | |
| | |
| Other - U.S. Drilling | |
| | | |
| | | |
| | | |
| | | |
| | |
| Adjusted operating income (loss) | |
$ | 11,386 | | |
$ | 9,994 | | |
$ | 9,216 | | |
$ | 47,312 | | |
$ | 40,189 | |
| Plus: General and administrative costs | |
| 315 | | |
| 324 | | |
| 331 | | |
| 1,314 | | |
| 1,357 | |
| Plus: Research
and engineering | |
| 89 | | |
| 166 | | |
| 90 | | |
| 438 | | |
| 594 | |
| GAAP Gross Margin | |
| 11,790 | | |
| 10,484 | | |
| 9,637 | | |
| 49,064 | | |
| 42,140 | |
| Plus: Depreciation
and amortization | |
| 7,332 | | |
| 13,081 | | |
| 7,329 | | |
| 33,277 | | |
| 54,852 | |
| Adjusted
gross margin | |
$ | 19,122 | | |
$ | 23,565 | | |
$ | 16,966 | | |
$ | 82,341 | | |
$ | 96,992 | |
| | |
| | | |
| | | |
| | | |
| | | |
| | |
| U.S. Drilling | |
| | | |
| | | |
| | | |
| | | |
| | |
| Adjusted operating income (loss) | |
$ | 51,494 | | |
$ | 68,293 | | |
$ | 49,582 | | |
$ | 262,353 | | |
$ | 108,506 | |
| Plus: General and administrative costs | |
| 4,402 | | |
| 5,301 | | |
| 5,570 | | |
| 20,904 | | |
| 20,317 | |
| Plus: Research
and engineering | |
| 1,365 | | |
| 1,803 | | |
| 1,479 | | |
| 5,811 | | |
| 7,133 | |
| GAAP Gross Margin | |
| 57,261 | | |
| 75,397 | | |
| 56,631 | | |
| 289,068 | | |
| 135,956 | |
| Plus: Depreciation
and amortization | |
| 66,877 | | |
| 75,849 | | |
| 67,776 | | |
| 271,310 | | |
| 311,759 | |
| Adjusted
gross margin | |
$ | 124,138 | | |
$ | 151,246 | | |
$ | 124,407 | | |
$ | 560,378 | | |
$ | 447,715 | |
| | |
| | | |
| | | |
| | | |
| | | |
| | |
| International Drilling | |
| | | |
| | | |
| | | |
| | | |
| | |
| Adjusted operating income (loss) | |
$ | 18,642 | | |
$ | 1,750 | | |
$ | 9,862 | | |
$ | 40,868 | | |
$ | (879 | ) |
| Plus: General and administrative costs | |
| 14,899 | | |
| 13,368 | | |
| 14,300 | | |
| 57,624 | | |
| 51,505 | |
| Plus: Research
and engineering | |
| 1,560 | | |
| 1,542 | | |
| 1,622 | | |
| 6,789 | | |
| 5,903 | |
| GAAP Gross Margin | |
| 35,101 | | |
| 16,660 | | |
| 25,784 | | |
| 105,281 | | |
| 56,529 | |
| Plus: Depreciation
and amortization | |
| 86,899 | | |
| 87,089 | | |
| 86,313 | | |
| 347,786 | | |
| 329,335 | |
| Adjusted
gross margin | |
$ | 122,000 | | |
$ | 103,749 | | |
$ | 112,097 | | |
$ | 453,067 | | |
$ | 385,864 | |
Adjusted
gross margin by segment represents adjusted operating income (loss) plus general and administrative costs,
research and engineering costs and depreciation and amortization.
NABORS
INDUSTRIES LTD. AND SUBSIDIARIES
RECONCILIATION
OF NON-GAAP FINANCIAL MEASURES TO NET INCOME (LOSS)
(Unaudited)
| | |
Three
Months Ended | | |
Year Ended | |
| | |
December 31, | | |
September 30, | | |
December 31, | |
| (In thousands) | |
2023 | | |
2022 | | |
2023 | | |
2023 | | |
2022 | |
| Net income (loss) | |
$ | 3,857 | | |
$ | (58,155 | ) | |
$ | (31,244 | ) | |
$ | 49,904 | | |
$ | (307,218 | ) |
| Income tax expense
(benefit) | |
| 19,244 | | |
| 26,161 | | |
| 10,513 | | |
| 79,220 | | |
| 61,536 | |
| Income (loss) from continuing operations before income taxes | |
| 23,101 | | |
| (31,994 | ) | |
| (20,731 | ) | |
| 129,124 | | |
| (245,682 | ) |
| Investment (income) loss | |
| (12,042 | ) | |
| (9,194 | ) | |
| (10,169 | ) | |
| (43,820 | ) | |
| (14,992 | ) |
| Interest expense | |
| 49,938 | | |
| 44,245 | | |
| 44,042 | | |
| 185,285 | | |
| 177,895 | |
| Other, net | |
| 7,878 | | |
| 58,124 | | |
| 35,546 | | |
| (726 | ) | |
| 127,099 | |
| Adjusted operating income (loss) (1) | |
| 68,875 | | |
| 61,181 | | |
| 48,688 | | |
| 269,863 | | |
| 44,320 | |
| Depreciation and amortization | |
| 161,228 | | |
| 168,841 | | |
| 161,337 | | |
| 645,294 | | |
| 665,072 | |
| Adjusted EBITDA (2) | |
$ | 230,103 | | |
$ | 230,022 | | |
$ | 210,025 | | |
$ | 915,157 | | |
$ | 709,392 | |
(1) Adjusted
operating income (loss) represents net income (loss) before income tax expense (benefit), investment income (loss), interest expense,
and other, net. Adjusted operating income (loss) is a non-GAAP financial measure and should not be used in isolation or as a substitute
for the amounts reported in accordance with GAAP. In addition, adjusted operating income (loss) excludes certain cash expenses that the
Company is obligated to make. However, management evaluates the performance of its operating segments and the consolidated Company based
on several criteria, including adjusted EBITDA and adjusted operating income (loss), because it believes that these financial measures
accurately reflect the Company’s ongoing profitability and performance. Securities analysts and investors use this measure
as one of the metrics on which they analyze the Company’s performance. Other companies in this industry may compute
these measures differently.
(2) Adjusted
EBITDA represents net income (loss) before income tax expense (benefit), investment income (loss), interest expense, other, net and depreciation
and amortization. Adjusted EBITDA is a non-GAAP financial measure and should not be used in isolation or as a substitute for the amounts
reported in accordance with GAAP. In addition, adjusted EBITDA excludes certain cash expenses that the Company is obligated to make.
However, management evaluates the performance of its operating segments and the consolidated Company based on several criteria, including
adjusted EBITDA and adjusted operating income (loss), because it believes that these financial measures accurately reflect the Company’s
ongoing profitability and performance. Securities analysts and investors use this measure as one of the metrics on which they
analyze the Company’s performance. Other companies in this industry may compute these measures differently.
NABORS
INDUSTRIES LTD. AND SUBSIDIARIES
RECONCILIATION
OF NET DEBT TO TOTAL DEBT
(Unaudited)
| | |
December 31, | | |
September 30, | | |
December 31, | |
| (In thousands) | |
2023 | | |
2023 | | |
2022 | |
| Current debt | |
$ | 629,621 | | |
$ | - | | |
$ | - | |
| Long-term debt | |
| 2,511,519 | | |
| 2,501,339 | | |
| 2,537,540 | |
| Total Debt | |
| 3,141,140 | | |
| 2,501,339 | | |
| 2,537,540 | |
| Less: Cash and short-term investments | |
| 1,070,178 | | |
| 406,643 | | |
| 452,315 | |
| Net Debt | |
$ | 2,070,962 | | |
$ | 2,094,696 | | |
$ | 2,085,225 | |
NABORS
INDUSTRIES LTD. AND SUBSIDIARIES
RECONCILIATION
OF ADJUSTED FREE CASH FLOW TO
NET
CASH PROVIDED BY OPERATING ACTIVITIES
(Unaudited)
| | |
Three Months
Ended | | |
Year Ended | |
| | |
December 31, | | |
September 30, | | |
December 31, | |
| (In thousands) | |
2023 | | |
2023 | | |
2023 | |
| Net cash provided by operating activities | |
$ | 181,921 | | |
$ | 133,425 | | |
$ | 637,862 | |
| Add: Capital expenditures, net of proceeds
from sales of assets | |
| (129,700 | ) | |
| (138,583 | ) | |
| (526,718 | ) |
| Adjusted free cash
flow | |
$ | 52,221 | | |
$ | (5,158 | ) | |
$ | 111,144 | |
Adjusted
free cash flow represents net cash provided by operating activities less cash used for capital expenditures, net of proceeds from sales
of assets. Management believes that adjusted free cash flow is an important liquidity measure for the company and that it
is useful to investors and management as a measure of the company’s ability to generate cash flow, after reinvesting in the company
for future growth, that could be available for paying down debt or other financing cash flows, such as dividends to shareholders. Adjusted
free cash flow does not represent the residual cash flow available for discretionary expenditures. Adjusted free cash flow
is a non-GAAP financial measure that should be considered in addition to, not as a substitute for or superior to, cash flow from operations
reported in accordance with GAAP.
Exhibit 99.2

| NABORS INDUSTRIES LTD. February 7, 2024
4Q 2023 Earnings
Presentation |
| N A B O R S . C O M
We often discuss expectations regarding our future markets, demand for our products and services, and
our performance in our annual, quarterly, and current reports, press releases, and other written and oral
statements. Such statements, including statements in this document that relate to matters that are not
historical facts, are “forward-looking statements” within the meaning of the safe harbor provisions of
Section 27A of the U.S. Securities Act of 1933 and Section 21E of the U.S. Securities Exchange Act of
1934. These “forward-looking statements” are based on our analysis of currently available competitive,
financial and economic data and our operating plans. They are inherently uncertain, and investors
should recognize that events and actual results could turn out to be significantly different from our
expectations.
Factors to consider when evaluating these forward-looking statements include, but are not limited to: • geopolitical events, pandemics (including COVID-19) and other macro-events and their
respective and collective impact on our operations as well as oil and gas markets and prices; • fluctuations and volatility in worldwide prices of and demand for oil and natural gas; • fluctuations in levels of oil and natural gas exploration and development activities; • fluctuations in the demand for our services; • competitive and technological changes and other developments in the oil and gas and oilfield
services industries; • our ability to renew customer contracts in order to maintain competitiveness; • the existence of operating risks inherent in the oil and gas and oilfield services industries; • the possibility of the loss of one or a number of our large customers; • the amount and nature of our future capital expenditures and how we expect to fund our capital
expenditures; • The occurrence of cybersecurity incidents, attacks and other breaches to our information technology
systems; • the impact of long-term indebtedness and other financial commitments on our financial and
operating flexibility; • our access to and the cost of capital, including the impact of a further downgrade in our credit
rating, covenant restrictions, availability under our revolving credit facility, and future issuances of
debt or equity securities and the global interest rate environment; • our dependence on our operating subsidiaries and investments to meet our financial obligations;
Forward Looking Statements
NABORS INDUSTRIES
2
• our ability to retain skilled employees; • our ability to complete, and realize the expected benefits of, strategic transactions; • changes in tax laws and the possibility of changes in other laws and regulation; • the possibility of changes to U.S. trade policies and regulations including the imposition of trade
embargoes or sanctions; and • global views on and the regulatory environment related to energy transition and our ability to
implement our energy transition initiatives; • potential long-lived asset impairments • the possibility of changes to U.S. trade policies and regulations including the imposition of trade
embargoes, sanctions or tariffs; and • general economic conditions, including the capital and credit markets.
Our businesses depend, to a large degree, on the level of spending by oil and gas companies for
exploration, development and production activities. Therefore, sustained lower oil or natural gas prices
that have a material impact on exploration, development or production activities could also materially
affect our financial position, results of operations and cash flows.
The above description of risks and uncertainties is by no means all-inclusive but is designed to highlight
what we believe are important factors to consider. For a discussion of these factors and other risks and
uncertainties, please refer to our filings with the Securities and Exchange Commission ("SEC"), including
those contained in our Annual Reports on Form 10-K and Quarterly Reports on Form 10-Q, which are
available at the SEC's website at www.sec.gov. We undertake no obligation to publicly update or revise
any forward-looking statement as a result of new information, future events or otherwise, except as
otherwise required by law.
Non-GAAP Financial Measures
This presentation refers to certain “non-GAAP” financial measures, such as adjusted EBITDA, net debt,
adjusted gross margin and adjusted free cash flow. The components of these non-GAAP measures are
computed by using amounts that are determined in accordance with accounting principles generally
accepted in the United States of America (“GAAP”). Reconciliations of non-GAAP measures to the most
comparable GAAP measures are provided in the Appendix at the end of this presentation. |
| N A B O R S . C O M
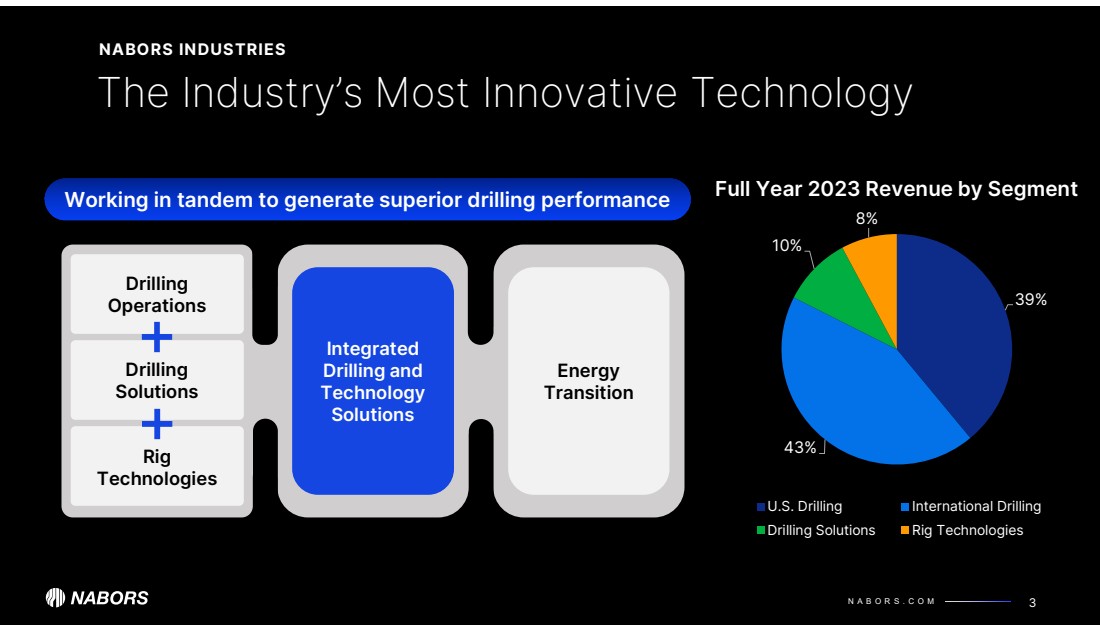
39%
43%
10%
8%
Full Year 2023 Revenue by Segment
U.S. Drilling International Drilling
Drilling Solutions Rig Technologies
3
The Industry’s Most Innovative Technology
NABORS INDUSTRIES
Integrated
Drilling and
Technology
Solutions
Drilling
Operations
Drilling
Solutions
Rig
Technologies
Energy
Transition
Working in tandem to generate superior drilling performance |
| N A B O R S . C O M
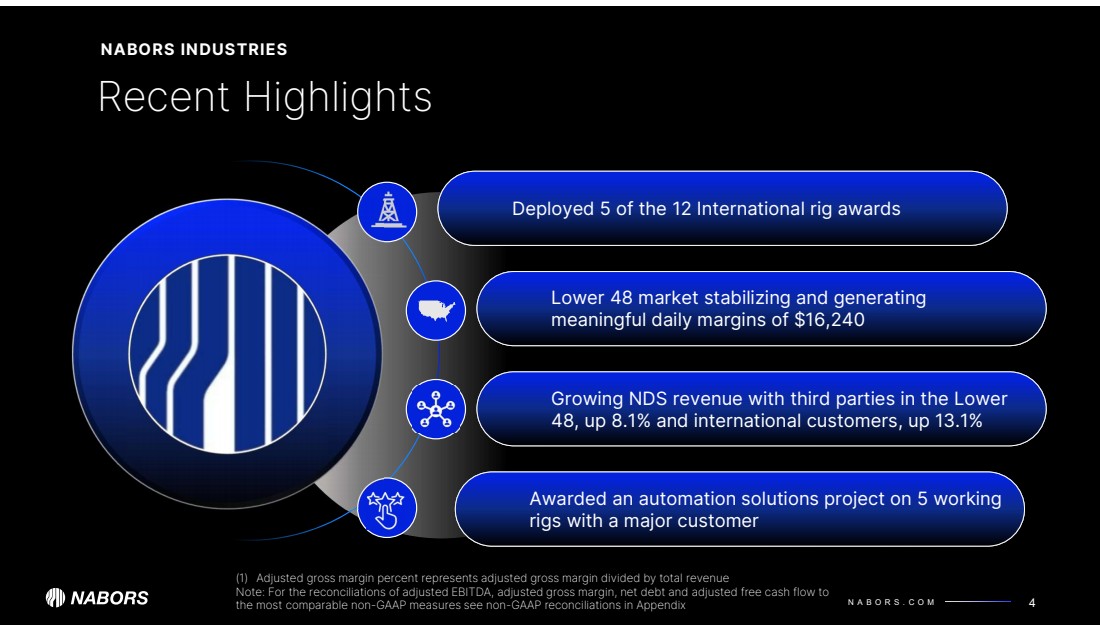
Recent Highlights
NABORS INDUSTRIES
4
Growing NDS revenue with third parties in the Lower
48, up 8.1% and international customers, up 13.1%
Deployed 5 of the 12 International rig awards
Lower 48 market stabilizing and generating
meaningful daily margins of $16,240
Nabors
Awarded an automation solutions project on 5 working
rigs with a major customer
(1) Adjusted gross margin percent represents adjusted gross margin divided by total revenue
Note: For the reconciliations of adjusted EBITDA, adjusted gross margin, net debt and adjusted free cash flow to
the most comparable non-GAAP measures see non-GAAP reconciliations in Appendix |
| N A B O R S . C O M
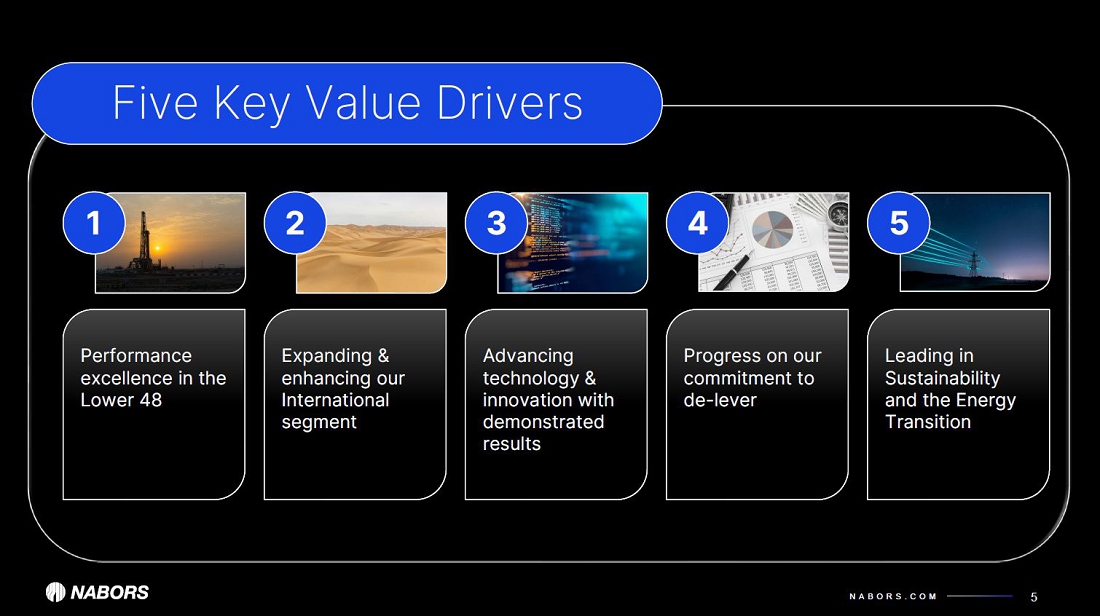
Expanding &
enhancing our
International
segment
5
Performance
excellence in the
Lower 48
Five Keys to Excellence
1
Advancing
technology &
innovation with
demonstrated
results
Progress on our
commitment to
de-lever
2 3
Leading in
Sustainability
and the Energy
Transition
4 5 |
| N A B O R S . C O M
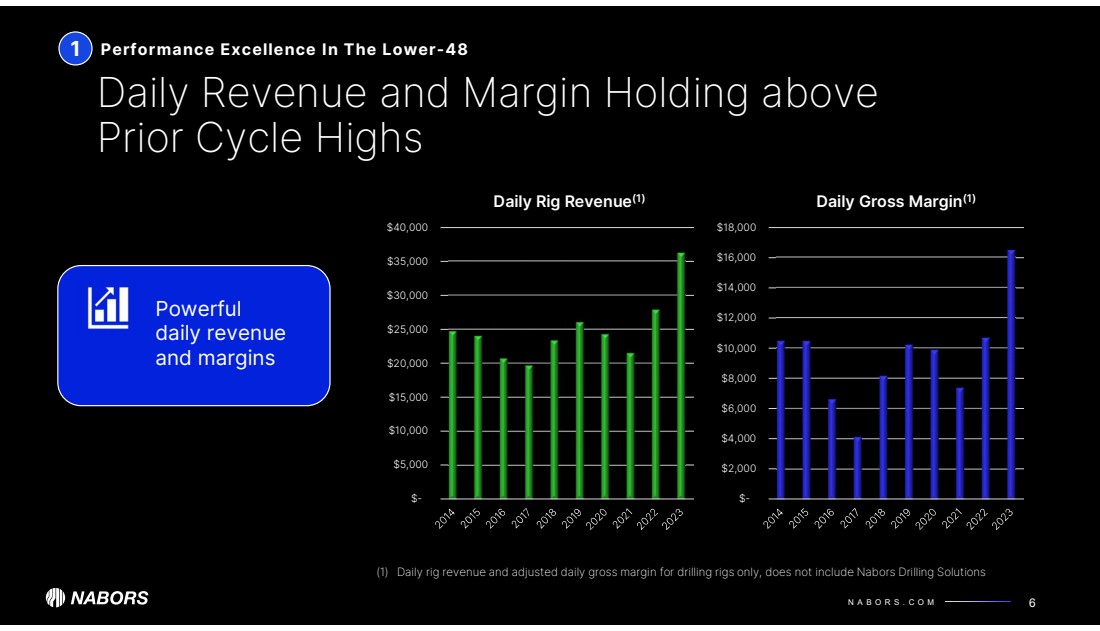
1
$-
$2,000
$4,000
$6,000
$8,000
$10,000
$12,000
$14,000
$16,000
$18,000
Daily Gross Margin(1)
$-
$5,000
$10,000
$15,000
$20,000
$25,000
$30,000
$35,000
$40,000
Daily Rig Revenue(1)
Daily Revenue and Margin Holding above
Prior Cycle Highs
Performance Excellence In The Lower-48
6
Powerful
daily revenue
and margins
(1) Daily rig revenue and adjusted daily gross margin for drilling rigs only, does not include Nabors Drilling Solutions |
| N A B O R S . C O M
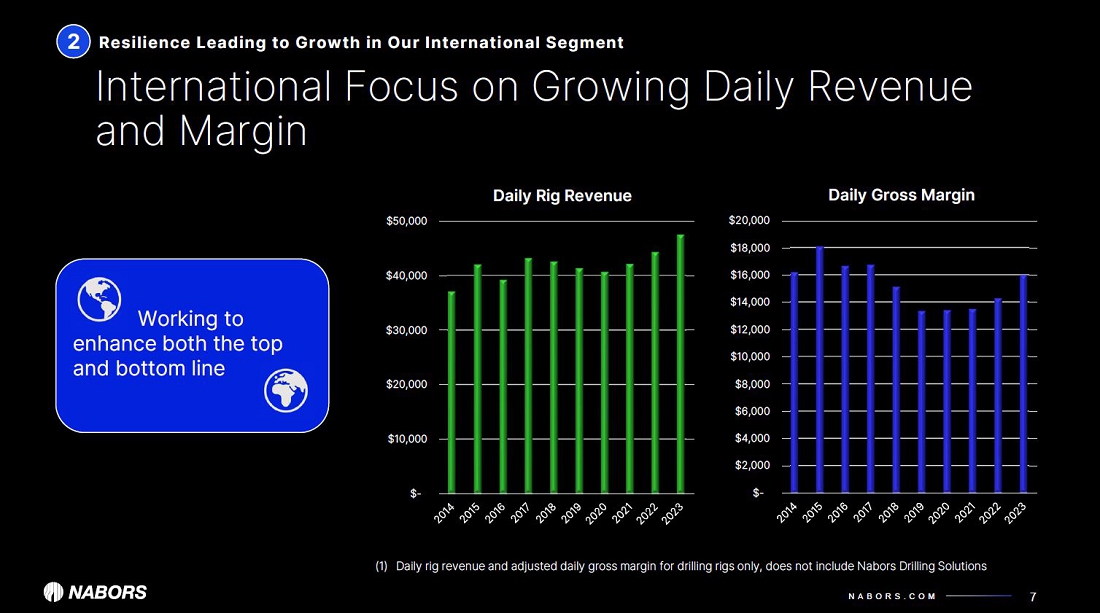
2
$-
$2,000
$4,000
$6,000
$8,000
$10,000
$12,000
$14,000
$16,000
$18,000
$20,000
Daily Gross Margin
$-
$10,000
$20,000
$30,000
$40,000
$50,000
Daily Rig Revenue
Working to
enhance both the top
and bottom line
International Focus Growing Dayrates and Margin
Resilience Leading to Growth in Our International Segment
7
(1) Daily rig revenue and adjusted daily gross margin for drilling rigs only, does not include Nabors Drilling Solutions |
| N A B O R S . C O M
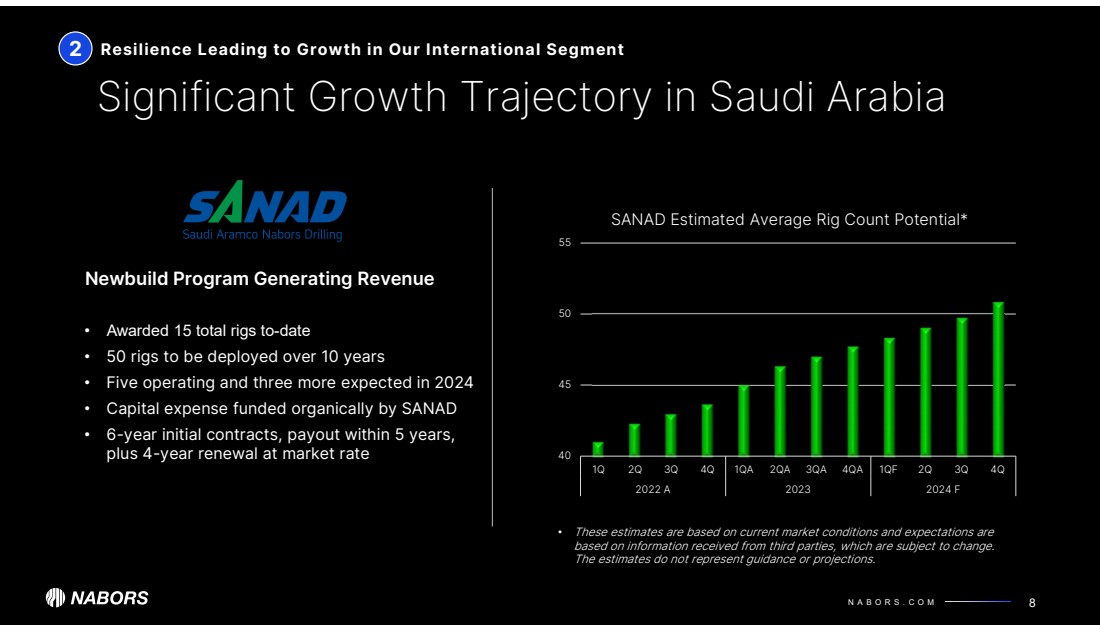
Significant Growth Trajectory in Saudi Arabia
Resilience Leading to Growth in Our International Segment
8
40
45
50
55
1Q 2Q 3Q 4Q 1QA 2QA 3QA 4QA 1QF 2Q 3Q 4Q
2022 A 2023 2024 F
SANAD Estimated Average Rig Count Potential*
• Awarded 15 total rigs to-date
• 50 rigs to be deployed over 10 years
• Five operating and three more expected in 2024
• Capital expense funded organically by SANAD
• 6-year initial contracts, payout within 5 years,
plus 4-year renewal at market rate
Newbuild Program Generating Revenue
• These estimates are based on current market conditions and expectations are
based on information received from third parties, which are subject to change.
The estimates do not represent guidance or projections.
2 |
| N A B O R S . C O M
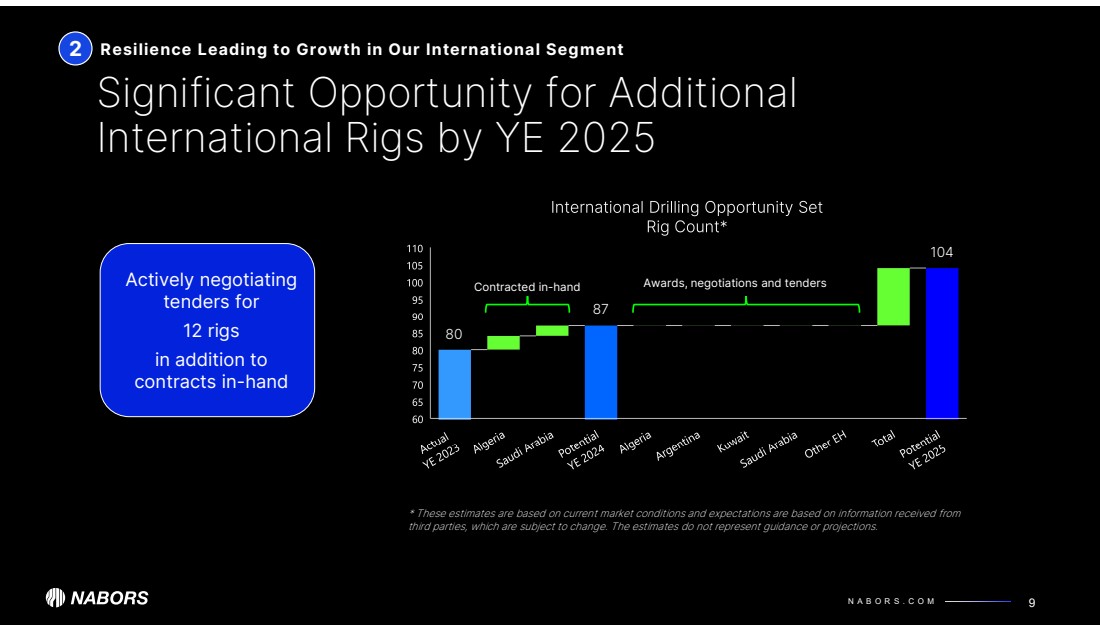
Significant Opportunity for Additional
International Rigs by YE 2025
9
80
104
Actively negotiating
tenders for
12 rigs
in addition to
contracts in-hand
87
* These estimates are based on current market conditions and expectations are based on information received from
third parties, which are subject to change. The estimates do not represent guidance or projections.
Resilience Leading to Growth in Our International Segment
Contracted in-hand Awards, negotiations and tenders
2 |
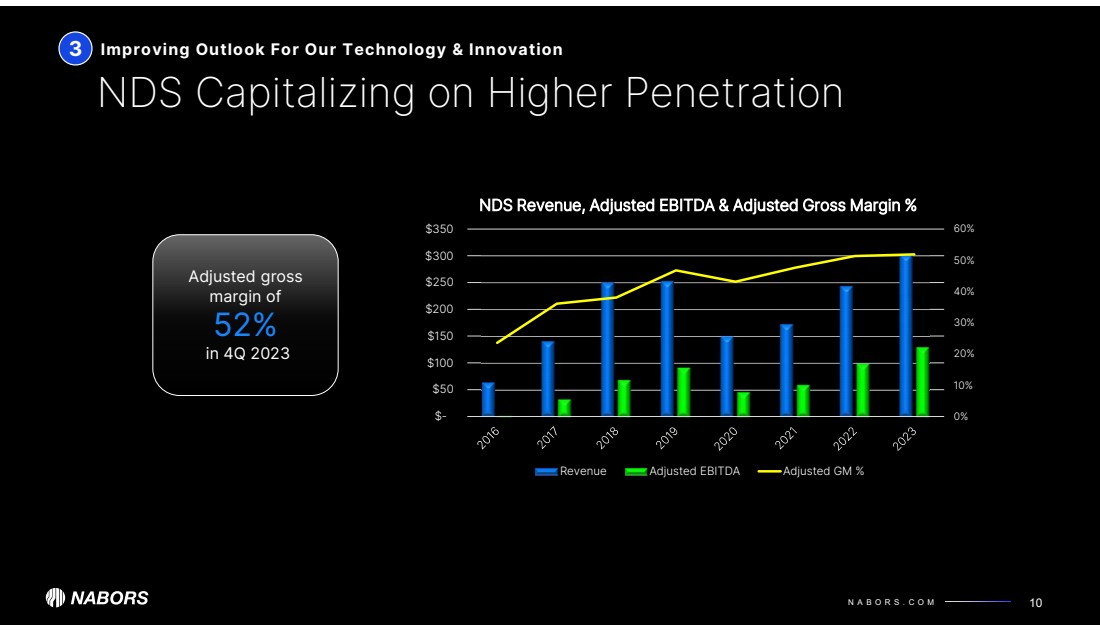
| N A B O R S . C O M 0%
10%
20%
30%
40%
50%
60%
$-
$50
$100
$150
$200
$250
$300
$350
NDS Revenue, Adjusted EBITDA & Adjusted Gross Margin %
Revenue Adjusted EBITDA Adjusted GM %
NDS Capitalizing on Higher Penetration
Improving Outlook For Our Technology & Innovation
10
Adjusted gross
margin of
52%
in 4Q 2023
3 |
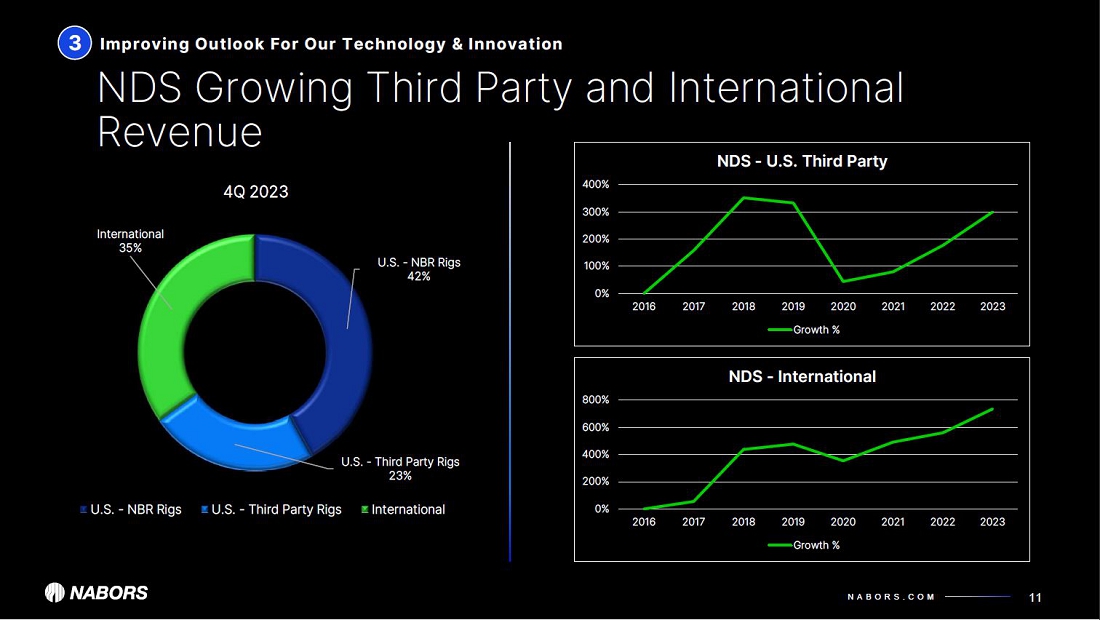
| N A B O R S . C O M
NDS Growing Third Party and International
Revenue
Improving Outlook For Our Technology & Innovation
11
0%
133%
267%
400%
0
200
400
600
2016 2017 2018 2019 2020 2021 2022 2023
NDS - U.S Third Party
Indexed Growth %
0%
200%
400%
600%
800%
0
200
400
600
800
1000
2016 2017 2018 2019 2020 2021 2022 2023
NDS - International
Indexed Growth %
U.S. - NBR Rigs
42%
U.S. - Third Party Rigs
23%
International
35%
4Q 2023
U.S. - NBR Rigs U.S. - Third Party Rigs International
3 |
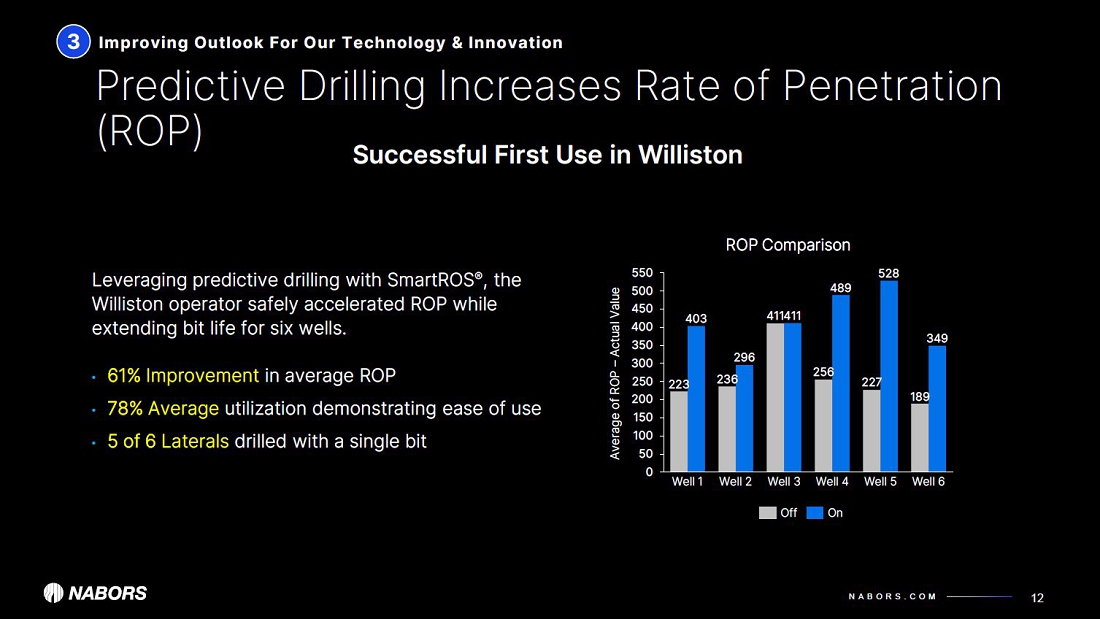
| N A B O R S . C O M
Predictive Drilling Increases Rate of Penetration (ROP)
Improving Outlook For Our Technology & Innovation
12
Leveraging Predictive Drilling with
SmartROS®, the Williston
Operator safely accelerated ROP
while extending bit life for six
wells. • 61% Improvement in Average
ROP
• 78% Average Utilization
• 5 of 6 Laterals Drilled with a
Single Bit
Successful First Use in Williston
223 236
411
256
227
189
403
296
411
489
528
349
0
50
100
150
200
250
300
350
400
450
500
550
Well 1 Well 2 Well 3 Well 4 Well 5 Well 6
Off On
ROP Comparison Average of ROP – Actual Value Footage
1,087
3,008
3,939
1,436 801 1,438
7,456
4,784
5,788
7,839 8,592 7,596
0
1,000
2,000
3,000
4,000
5,000
6,000
7,000
8,000
9,000
10,000
Well 1 Well 2 Well 3 Well 4 Well 5 Well 6
8,543
7,792
9,727
9,275 9,393
9,034
Off On
Footage Comparison
3 |
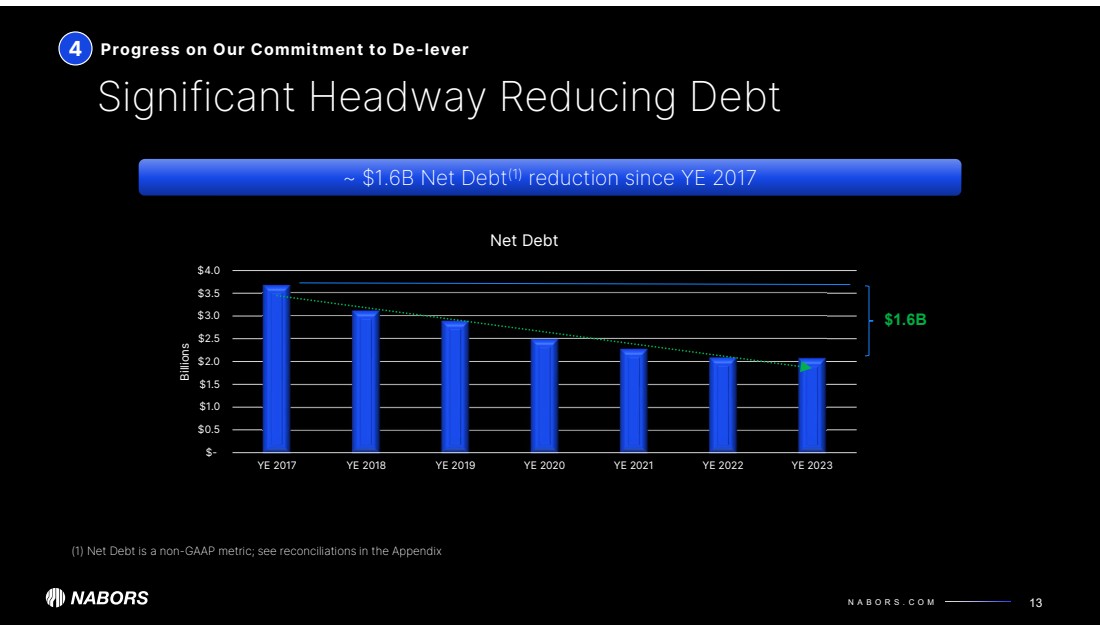
| N A B O R S . C O M
$-
$0.5
$1.0
$1.5
$2.0
$2.5
$3.0
$3.5
$4.0
YE 2017 YE 2018 YE 2019 YE 2020 YE 2021 YE 2022 YE 2023 Billions
Net Debt
Significant Headway Reducing Debt
Progress on Our Commitment to De-lever
13
~ $1.6B Net Debt(1) reduction since YE 2017
$1.6B
(1) Net Debt is a non-GAAP metric; see reconciliations in the Appendix
4 |
| N A B O R S . C O M
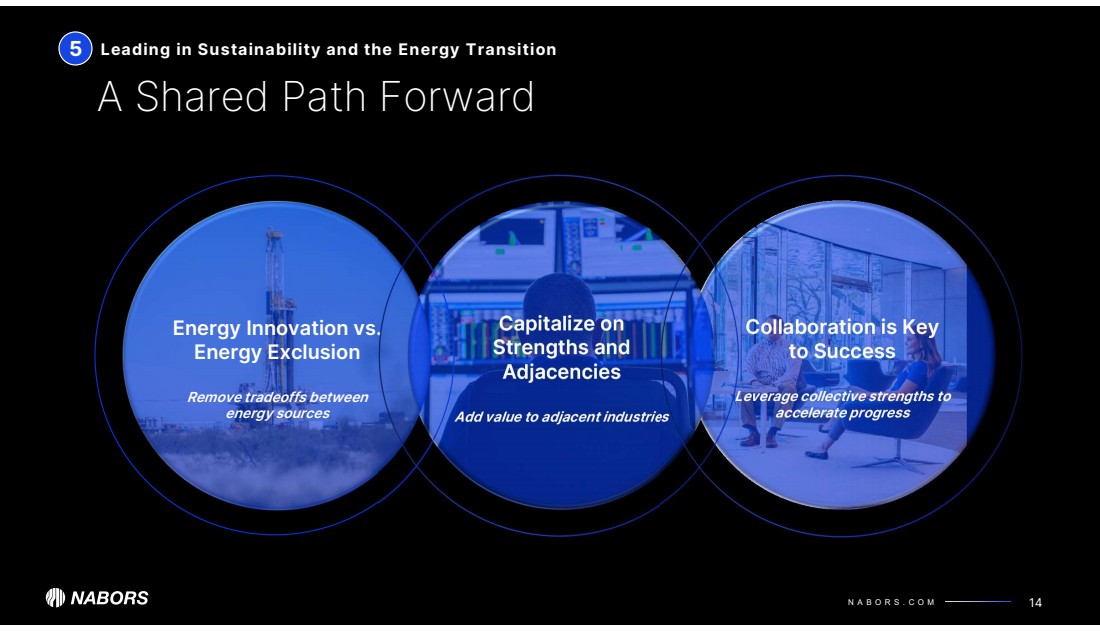
Leading in Sustainability and the Energy Transition
Energy Innovation vs.
Energy Exclusion
Remove tradeoffs between
energy sources
A Shared Path Forward
Leading in Sustainability and the Energy Transition
14
Capitalize on
Strengths and
Adjacencies
Add value to adjacent industries
Collaboration is Key
to Success
Leverage collective strengths to
accelerate progress
5 |
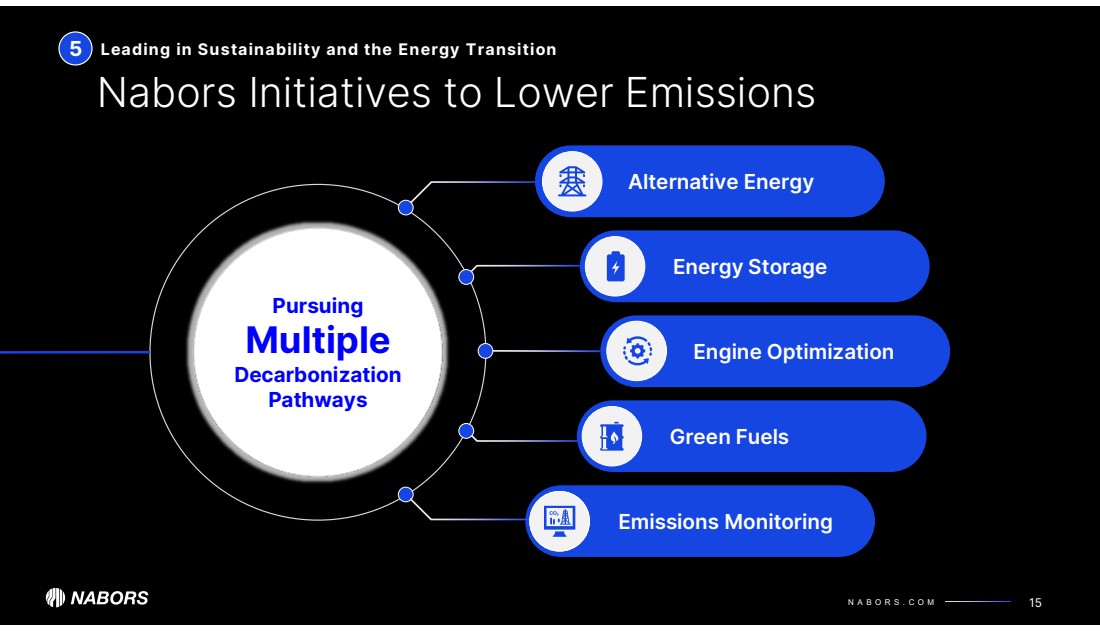
| N A B O R S . C O M
Alternative Energy
Emissions Monitoring
Pursuing
Multiple
Decarbonization
Pathways
Green Fuels
Energy Storage
Leading in Sustainability and the Energy Transition
Nabors Initiatives to Lower Emissions
15
Engine Optimization
5 |
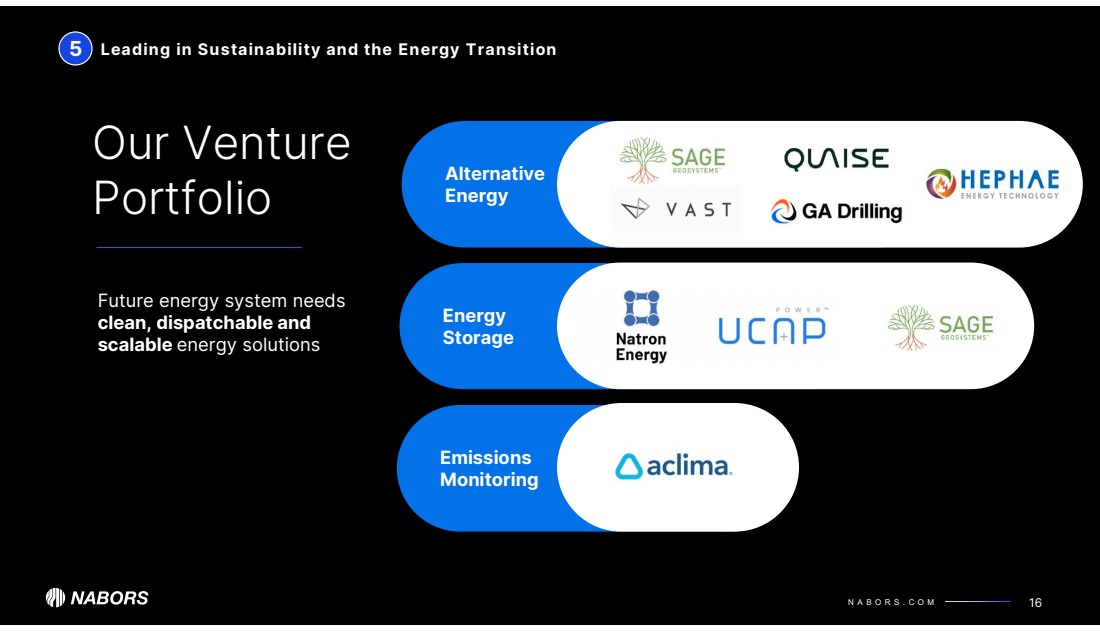
| N A B O R S . C O M
Leading in Sustainability and the Energy Transition
Emissions
Monitoring
Energy
Storage
Alternative
Energy
Our Venture
Portfolio
Future energy system needs
clean, dispatchable and
scalable energy solutions
16
5 Leading in Sustainability and the Energy Transition |
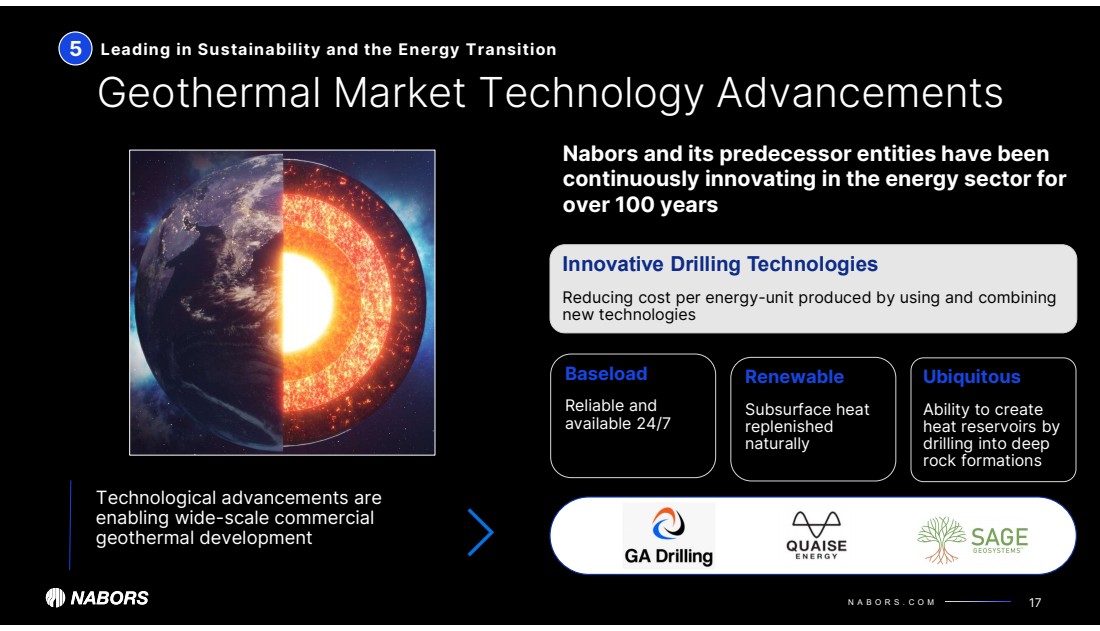
| N A B O R S . C O M 17
Ubiquitous
Ability to create
heat reservoirs by
drilling into deep
rock formations
Innovative Drilling Technologies
Reducing cost per energy-unit produced by using and combining
new technologies
Baseload
Reliable and
available 24/7
Renewable
Subsurface heat
replenished
naturally
Nabors and its predecessor entities have been
continuously innovating in the energy sector for
over 100 years
Technological advancements are
enabling wide-scale commercial
geothermal development
Leading in Sustainability and the Energy Transition
Geothermal Market Technology Advancements
5 |
| Appendix
18 |
| N A B O R S . C O M
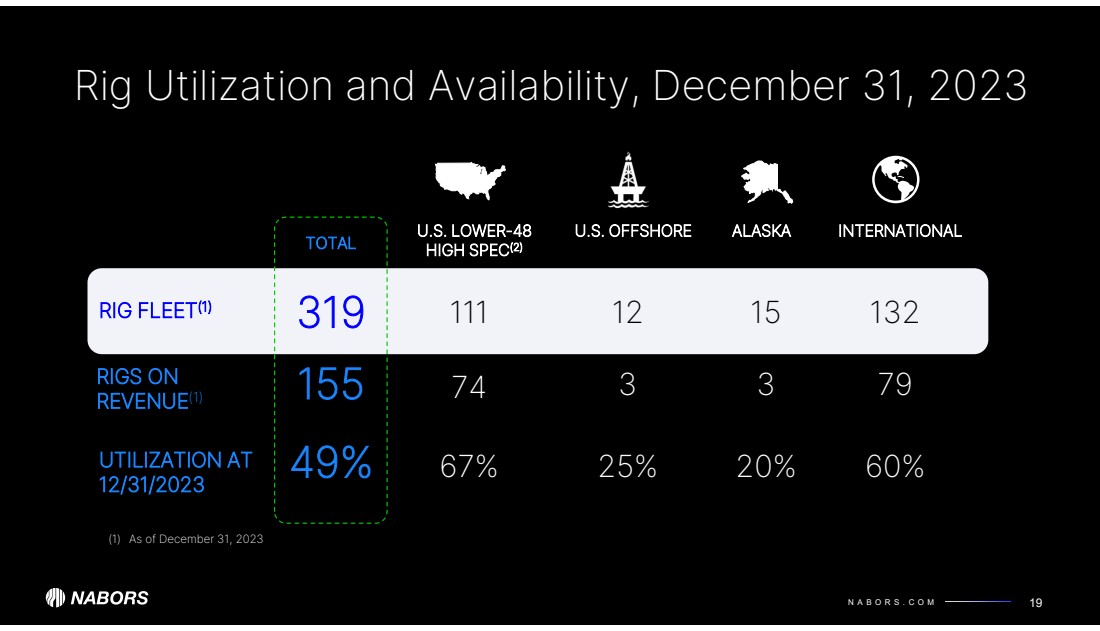
Rig Utilization and Availability, December 31, 2023
19
RIG FLEET(1) 319
RIGS ON
REVENUE(1) 155
UTILIZATION AT
12/31/2023 49%
TOTAL U.S. OFFSHORE
12
3
25%
15
3
20%
ALASKA INTERNATIONAL
132
79
60%
111
74
67%
U.S. LOWER-48
HIGH SPEC(2)
(1) As of December 31, 2023 |
| N A B O R S . C O M
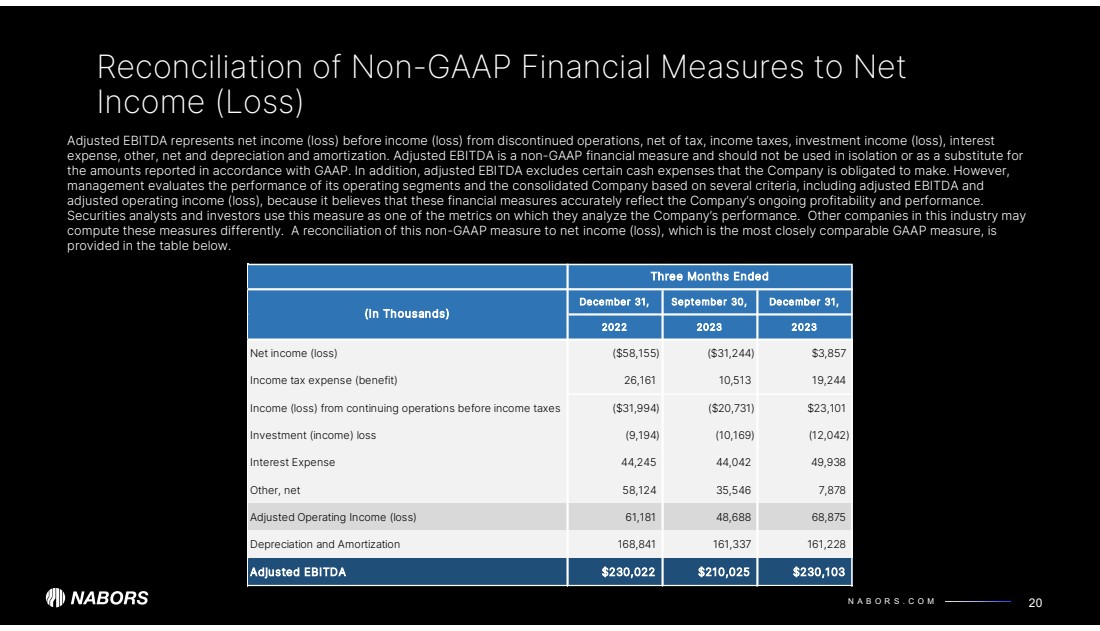
December 31, September 30, December 31,
2022 2023 2023
Net income (loss) ($58,155) ($31,244) $3,857
Income tax expense (benefit) 26,161 10,513 19,244
Income (loss) from continuing operations before income taxes ($31,994) ($20,731) $23,101
Investment (income) loss (9,194) (10,169) (12,042)
Interest Expense 44,245 44,042 49,938
Other, net 58,124 35,546 7,878
Adjusted Operating Income (loss) 61,181 48,688 68,875
Depreciation and Amortization 168,841 161,337 161,228
Adjusted EBITDA $230,022 $210,025 $230,103
(In Thousands)
Three Months Ended
Reconciliation of Non-GAAP Financial Measures to Net
Income (Loss)
20
Adjusted EBITDA represents net income (loss) before income (loss) from discontinued operations, net of tax, income taxes, investment income (loss), interest
expense, other, net and depreciation and amortization. Adjusted EBITDA is a non-GAAP financial measure and should not be used in isolation or as a substitute for
the amounts reported in accordance with GAAP. In addition, adjusted EBITDA excludes certain cash expenses that the Company is obligated to make. However,
management evaluates the performance of its operating segments and the consolidated Company based on several criteria, including adjusted EBITDA and
adjusted operating income (loss), because it believes that these financial measures accurately reflect the Company’s ongoing profitability and performance.
Securities analysts and investors use this measure as one of the metrics on which they analyze the Company’s performance. Other companies in this industry may
compute these measures differently. A reconciliation of this non-GAAP measure to net income (loss), which is the most closely comparable GAAP measure, is
provided in the table below. |
| N A B O R S . C O M
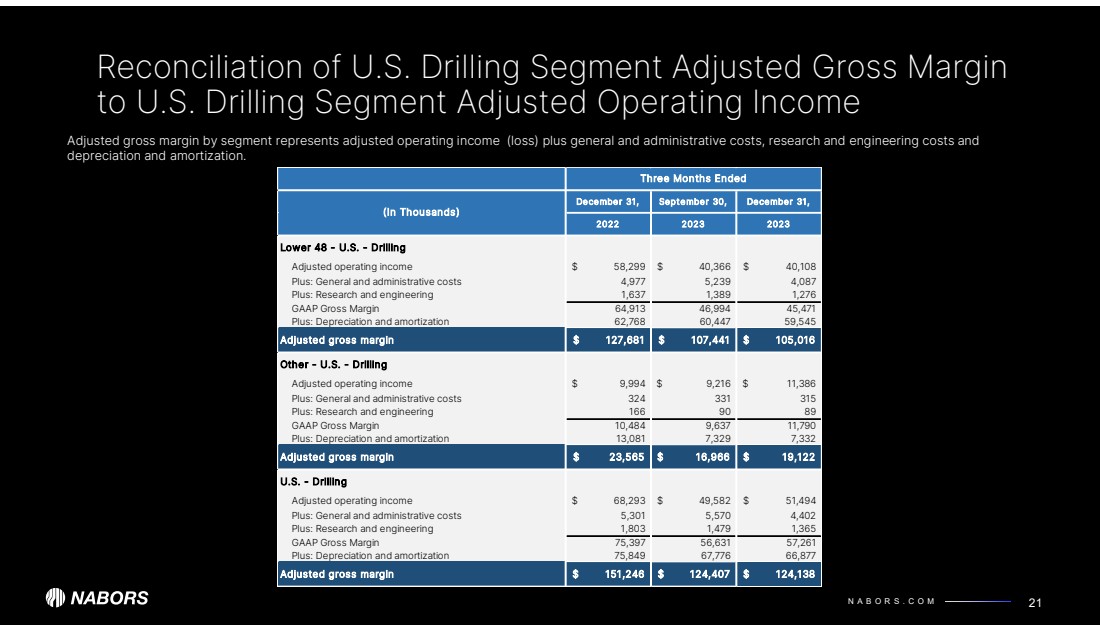
December 31, September 30, December 31,
2022 2023 2023
Lower 48 - U.S. - Drilling
Adjusted operating income 58,299 $ 40,366 $ 40,108 $
Plus: General and administrative costs 4,977 5,239 4,087 Plus: Research and engineering 1,637 1,389 1,276 GAAP Gross Margin 64,913 46,994 45,471 Plus: Depreciation and amortization 62,768 60,447 59,545 Adjusted gross margin 127,681 $ 107,441 $ 105,016 $
Other - U.S. - Drilling
Adjusted operating income 9,994 $ 9,216 $ 11,386 $
Plus: General and administrative costs 324 331 315 Plus: Research and engineering 166 90 89 GAAP Gross Margin 10,484 9,637 11,790 Plus: Depreciation and amortization 13,081 7,329 7,332 Adjusted gross margin 23,565 $ 16,966 $ 19,122 $
U.S. - Drilling
Adjusted operating income 68,293 $ 49,582 $ 51,494 $
Plus: General and administrative costs 5,301 5,570 4,402 Plus: Research and engineering 1,803 1,479 1,365 GAAP Gross Margin 75,397 56,631 57,261 Plus: Depreciation and amortization 75,849 67,776 66,877 Adjusted gross margin 151,246 $ 124,407 $ 124,138 $
(In Thousands)
Three Months Ended
Reconciliation of U.S. Drilling Segment Adjusted Gross Margin
to U.S. Drilling Segment Adjusted Operating Income
21
Adjusted gross margin by segment represents adjusted operating income (loss) plus general and administrative costs, research and engineering costs and
depreciation and amortization. |
| N A B O R S . C O M
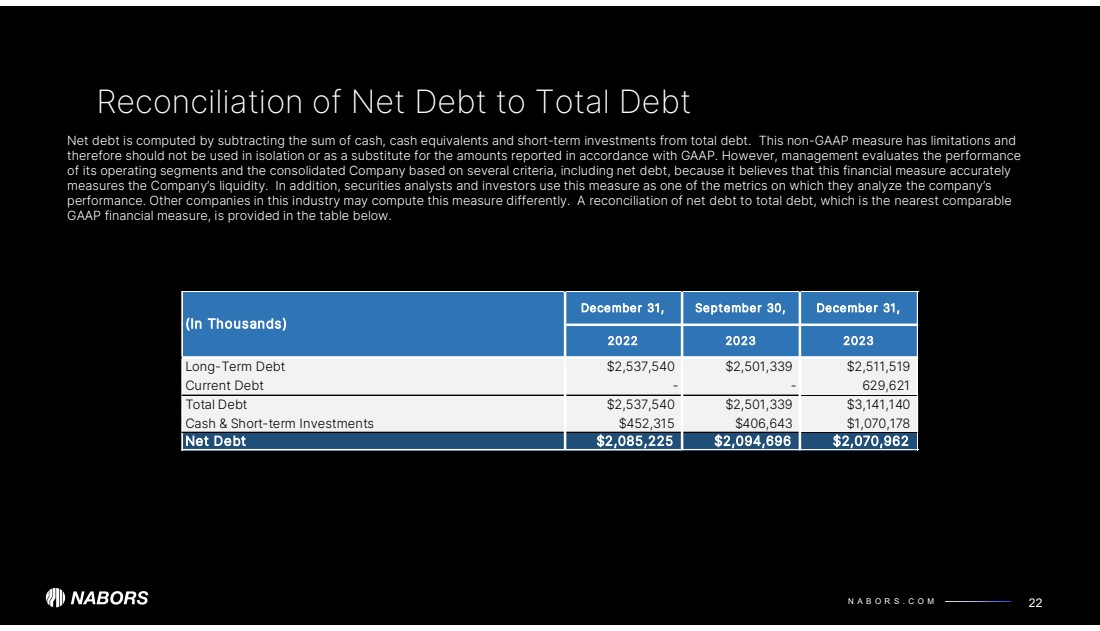
Reconciliation of Net Debt to Total Debt
22
Net debt is computed by subtracting the sum of cash, cash equivalents and short-term investments from total debt. This non-GAAP measure has limitations and
therefore should not be used in isolation or as a substitute for the amounts reported in accordance with GAAP. However, management evaluates the performance
of its operating segments and the consolidated Company based on several criteria, including net debt, because it believes that this financial measure accurately
measures the Company’s liquidity. In addition, securities analysts and investors use this measure as one of the metrics on which they analyze the company’s
performance. Other companies in this industry may compute this measure differently. A reconciliation of net debt to total debt, which is the nearest comparable
GAAP financial measure, is provided in the table below.
December 31, September 30, December 31,
2022 2023 2023
Long-Term Debt $2,537,540 $2,501,339 $2,511,519
Current Debt - - 629,621
Total Debt $2,537,540 $2,501,339 $3,141,140
Cash & Short-term Investments $452,315 $406,643 $1,070,178
Net Debt $2,085,225 $2,094,696 $2,070,962
(In Thousands) |
| N A B O R S . C O M
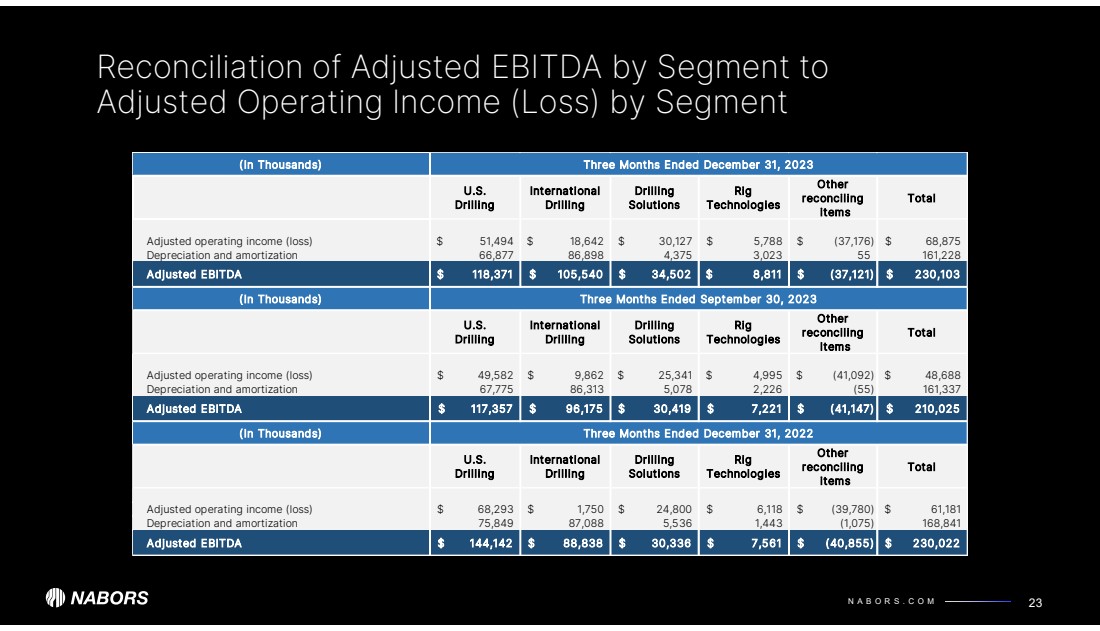
(In Thousands) Three Months Ended December 31, 2023
U.S. Drilling
International Drilling Drilling Solutions Rig Technologies
Other reconciling
items Total
Adjusted operating income (loss) 51,494 $ 18,642 $ 30,127 $ 5,788 $ (37,176) $ 68,875 $
Depreciation and amortization 66,877 86,898 4,375 3,023 55 161,228
Adjusted EBITDA 118,371 $ 105,540 $ 34,502 $ 8,811 $ (37,121) $ 230,103 $
(In Thousands) Three Months Ended September 30, 2023
U.S. Drilling
International Drilling Drilling Solutions Rig Technologies
Other reconciling
items Total
Adjusted operating income (loss) 49,582 $ 9,862 $ 25,341 $ 4,995 $ (41,092) $ 48,688 $
Depreciation and amortization 67,775 86,313 5,078 2,226 (55) 161,337
Adjusted EBITDA 117,357 $ 96,175 $ 30,419 $ 7,221 $ (41,147) $ 210,025 $
(In Thousands) Three Months Ended December 31, 2022
U.S. Drilling
International Drilling Drilling Solutions Rig Technologies
Other reconciling
items Total
Adjusted operating income (loss) 68,293 $ 1,750 $ 24,800 $ 6,118 $ (39,780) $ 61,181 $
Depreciation and amortization 75,849 87,088 5,536 1,443 (1,075) 168,841
Adjusted EBITDA 144,142 $ 88,838 $ 30,336 $ 7,561 $ (40,855) $ 230,022 $
Reconciliation of Adjusted EBITDA by Segment to
Adjusted Operating Income (Loss) by Segment
23
Adjusted EBITDA by segment represents adjusted income (loss) plus depreciation and amortization. |
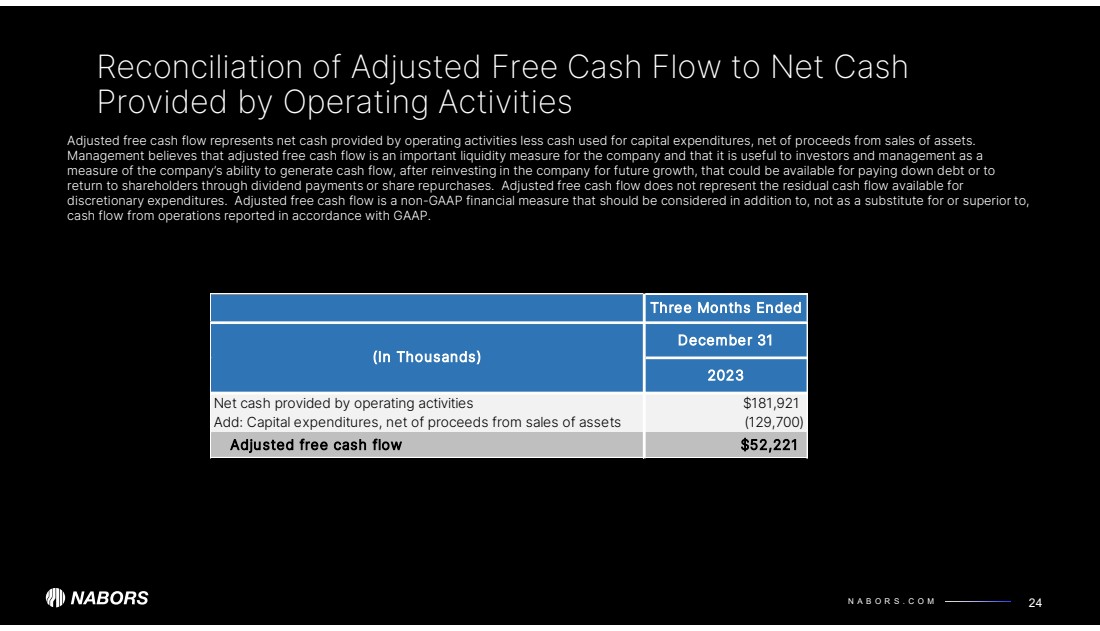
| N A B O R S . C O M
Three Months Ended
December 31
2023
Net cash provided by operating activities $181,921
Add: Capital expenditures, net of proceeds from sales of assets (129,700)
Adjusted free cash flow $52,221
(In Thousands)
Reconciliation of Adjusted Free Cash Flow to Net Cash
Provided by Operating Activities
24
Adjusted free cash flow represents net cash provided by operating activities less cash used for capital expenditures, net of proceeds from sales of assets.
Management believes that adjusted free cash flow is an important liquidity measure for the company and that it is useful to investors and management as a
measure of the company’s ability to generate cash flow, after reinvesting in the company for future growth, that could be available for paying down debt or to
return to shareholders through dividend payments or share repurchases. Adjusted free cash flow does not represent the residual cash flow available for
discretionary expenditures. Adjusted free cash flow is a non-GAAP financial measure that should be considered in addition to, not as a substitute for or superior to,
cash flow from operations reported in accordance with GAAP. |
| NABORS INDUSTRIES LTD.
NABORS.COM
NABORS CORPORATE SERVICES
515 W. Greens Road
Suite 1200
Houston, TX 77067-4525
@ n a b o r s g l o b a l
Contact Us:
William C. Conroy, CFA
VP - Corporate Development and
Investor Relations
William.Conroy@nabors.com
Kara K. Peak
Director - Corporate Development
and Investor Relations
Kara.Peak@nabors.com |
| X |
- DefinitionBoolean flag that is true when the XBRL content amends previously-filed or accepted submission.
| Name: |
dei_AmendmentFlag |
| Namespace Prefix: |
dei_ |
| Data Type: |
xbrli:booleanItemType |
| Balance Type: |
na |
| Period Type: |
duration |
|
| X |
- DefinitionFor the EDGAR submission types of Form 8-K: the date of the report, the date of the earliest event reported; for the EDGAR submission types of Form N-1A: the filing date; for all other submission types: the end of the reporting or transition period. The format of the date is YYYY-MM-DD.
| Name: |
dei_DocumentPeriodEndDate |
| Namespace Prefix: |
dei_ |
| Data Type: |
xbrli:dateItemType |
| Balance Type: |
na |
| Period Type: |
duration |
|
| X |
- DefinitionThe type of document being provided (such as 10-K, 10-Q, 485BPOS, etc). The document type is limited to the same value as the supporting SEC submission type, or the word 'Other'.
| Name: |
dei_DocumentType |
| Namespace Prefix: |
dei_ |
| Data Type: |
dei:submissionTypeItemType |
| Balance Type: |
na |
| Period Type: |
duration |
|
| X |
- DefinitionAddress Line 1 such as Attn, Building Name, Street Name
| Name: |
dei_EntityAddressAddressLine1 |
| Namespace Prefix: |
dei_ |
| Data Type: |
xbrli:normalizedStringItemType |
| Balance Type: |
na |
| Period Type: |
duration |
|
| X |
- DefinitionAddress Line 2 such as Street or Suite number
| Name: |
dei_EntityAddressAddressLine2 |
| Namespace Prefix: |
dei_ |
| Data Type: |
xbrli:normalizedStringItemType |
| Balance Type: |
na |
| Period Type: |
duration |
|
| X |
- DefinitionAddress Line 3 such as an Office Park
| Name: |
dei_EntityAddressAddressLine3 |
| Namespace Prefix: |
dei_ |
| Data Type: |
xbrli:normalizedStringItemType |
| Balance Type: |
na |
| Period Type: |
duration |
|
| X |
- Definition
+ References
+ Details
| Name: |
dei_EntityAddressCityOrTown |
| Namespace Prefix: |
dei_ |
| Data Type: |
xbrli:normalizedStringItemType |
| Balance Type: |
na |
| Period Type: |
duration |
|
| X |
- DefinitionISO 3166-1 alpha-2 country code.
| Name: |
dei_EntityAddressCountry |
| Namespace Prefix: |
dei_ |
| Data Type: |
dei:countryCodeItemType |
| Balance Type: |
na |
| Period Type: |
duration |
|
| X |
- DefinitionCode for the postal or zip code
| Name: |
dei_EntityAddressPostalZipCode |
| Namespace Prefix: |
dei_ |
| Data Type: |
xbrli:normalizedStringItemType |
| Balance Type: |
na |
| Period Type: |
duration |
|
| X |
- DefinitionA unique 10-digit SEC-issued value to identify entities that have filed disclosures with the SEC. It is commonly abbreviated as CIK. Reference 1: http://www.xbrl.org/2003/role/presentationRef
-Publisher SEC
-Name Exchange Act
-Number 240
-Section 12
-Subsection b-2
| Name: |
dei_EntityCentralIndexKey |
| Namespace Prefix: |
dei_ |
| Data Type: |
dei:centralIndexKeyItemType |
| Balance Type: |
na |
| Period Type: |
duration |
|
| X |
- DefinitionIndicate if registrant meets the emerging growth company criteria. Reference 1: http://www.xbrl.org/2003/role/presentationRef
-Publisher SEC
-Name Exchange Act
-Number 240
-Section 12
-Subsection b-2
| Name: |
dei_EntityEmergingGrowthCompany |
| Namespace Prefix: |
dei_ |
| Data Type: |
xbrli:booleanItemType |
| Balance Type: |
na |
| Period Type: |
duration |
|
| X |
- DefinitionCommission file number. The field allows up to 17 characters. The prefix may contain 1-3 digits, the sequence number may contain 1-8 digits, the optional suffix may contain 1-4 characters, and the fields are separated with a hyphen.
| Name: |
dei_EntityFileNumber |
| Namespace Prefix: |
dei_ |
| Data Type: |
dei:fileNumberItemType |
| Balance Type: |
na |
| Period Type: |
duration |
|
| X |
- DefinitionTwo-character EDGAR code representing the state or country of incorporation.
| Name: |
dei_EntityIncorporationStateCountryCode |
| Namespace Prefix: |
dei_ |
| Data Type: |
dei:edgarStateCountryItemType |
| Balance Type: |
na |
| Period Type: |
duration |
|
| X |
- DefinitionThe exact name of the entity filing the report as specified in its charter, which is required by forms filed with the SEC. Reference 1: http://www.xbrl.org/2003/role/presentationRef
-Publisher SEC
-Name Exchange Act
-Number 240
-Section 12
-Subsection b-2
| Name: |
dei_EntityRegistrantName |
| Namespace Prefix: |
dei_ |
| Data Type: |
xbrli:normalizedStringItemType |
| Balance Type: |
na |
| Period Type: |
duration |
|
| X |
- DefinitionThe Tax Identification Number (TIN), also known as an Employer Identification Number (EIN), is a unique 9-digit value assigned by the IRS. Reference 1: http://www.xbrl.org/2003/role/presentationRef
-Publisher SEC
-Name Exchange Act
-Number 240
-Section 12
-Subsection b-2
| Name: |
dei_EntityTaxIdentificationNumber |
| Namespace Prefix: |
dei_ |
| Data Type: |
dei:employerIdItemType |
| Balance Type: |
na |
| Period Type: |
duration |
|
| X |
- DefinitionLocal phone number for entity.
| Name: |
dei_LocalPhoneNumber |
| Namespace Prefix: |
dei_ |
| Data Type: |
xbrli:normalizedStringItemType |
| Balance Type: |
na |
| Period Type: |
duration |
|
| X |
- DefinitionBoolean flag that is true when the Form 8-K filing is intended to satisfy the filing obligation of the registrant as pre-commencement communications pursuant to Rule 13e-4(c) under the Exchange Act. Reference 1: http://www.xbrl.org/2003/role/presentationRef
-Publisher SEC
-Name Exchange Act
-Number 240
-Section 13e
-Subsection 4c
| Name: |
dei_PreCommencementIssuerTenderOffer |
| Namespace Prefix: |
dei_ |
| Data Type: |
xbrli:booleanItemType |
| Balance Type: |
na |
| Period Type: |
duration |
|
| X |
- DefinitionBoolean flag that is true when the Form 8-K filing is intended to satisfy the filing obligation of the registrant as pre-commencement communications pursuant to Rule 14d-2(b) under the Exchange Act. Reference 1: http://www.xbrl.org/2003/role/presentationRef
-Publisher SEC
-Name Exchange Act
-Number 240
-Section 14d
-Subsection 2b
| Name: |
dei_PreCommencementTenderOffer |
| Namespace Prefix: |
dei_ |
| Data Type: |
xbrli:booleanItemType |
| Balance Type: |
na |
| Period Type: |
duration |
|
| X |
- DefinitionTitle of a 12(b) registered security. Reference 1: http://www.xbrl.org/2003/role/presentationRef
-Publisher SEC
-Name Exchange Act
-Number 240
-Section 12
-Subsection b
| Name: |
dei_Security12bTitle |
| Namespace Prefix: |
dei_ |
| Data Type: |
dei:securityTitleItemType |
| Balance Type: |
na |
| Period Type: |
duration |
|
| X |
- DefinitionName of the Exchange on which a security is registered. Reference 1: http://www.xbrl.org/2003/role/presentationRef
-Publisher SEC
-Name Exchange Act
-Number 240
-Section 12
-Subsection d1-1
| Name: |
dei_SecurityExchangeName |
| Namespace Prefix: |
dei_ |
| Data Type: |
dei:edgarExchangeCodeItemType |
| Balance Type: |
na |
| Period Type: |
duration |
|
| X |
- DefinitionBoolean flag that is true when the Form 8-K filing is intended to satisfy the filing obligation of the registrant as soliciting material pursuant to Rule 14a-12 under the Exchange Act. Reference 1: http://www.xbrl.org/2003/role/presentationRef
-Publisher SEC
-Name Exchange Act
-Section 14a
-Number 240
-Subsection 12
| Name: |
dei_SolicitingMaterial |
| Namespace Prefix: |
dei_ |
| Data Type: |
xbrli:booleanItemType |
| Balance Type: |
na |
| Period Type: |
duration |
|
| X |
- DefinitionTrading symbol of an instrument as listed on an exchange.
| Name: |
dei_TradingSymbol |
| Namespace Prefix: |
dei_ |
| Data Type: |
dei:tradingSymbolItemType |
| Balance Type: |
na |
| Period Type: |
duration |
|
| X |
- DefinitionBoolean flag that is true when the Form 8-K filing is intended to satisfy the filing obligation of the registrant as written communications pursuant to Rule 425 under the Securities Act. Reference 1: http://www.xbrl.org/2003/role/presentationRef
-Publisher SEC
-Name Securities Act
-Number 230
-Section 425
| Name: |
dei_WrittenCommunications |
| Namespace Prefix: |
dei_ |
| Data Type: |
xbrli:booleanItemType |
| Balance Type: |
na |
| Period Type: |
duration |
|
Grafico Azioni Nabors Industries (NYSE:NBR)
Storico
Da Mar 2025 a Mar 2025

Grafico Azioni Nabors Industries (NYSE:NBR)
Storico
Da Mar 2024 a Mar 2025

