Pay vs Performance Disclosure - USD ($)
|
4 Months Ended |
8 Months Ended |
12 Months Ended |
May 15, 2024 |
Dec. 31, 2024 |
Dec. 31, 2024 |
Dec. 31, 2023 |
Dec. 31, 2022 |
Dec. 31, 2021 |
Dec. 31, 2020 |
| Pay vs Performance Disclosure |
|
|
|
|
|
|
|
| Pay vs Performance Disclosure, Table |
|
|
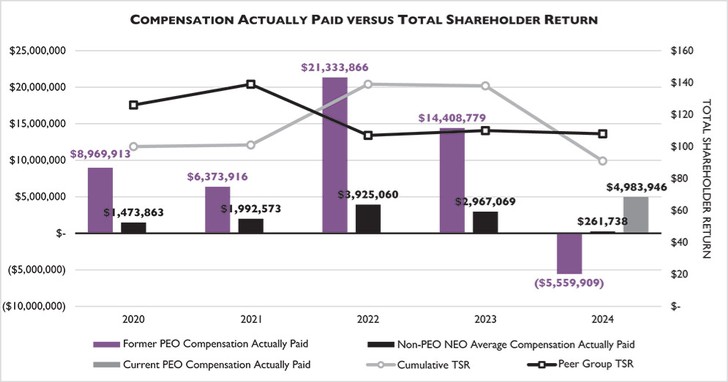
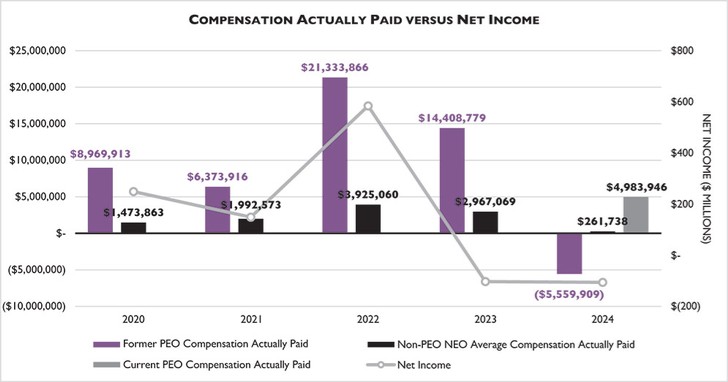
| | | | | | | | | | | | | | | | | | | | | | | | | | | | | | | | | Value Initial Fixed $100 | | | | | | | | | | | | | | | | | | Investment Based on: | | | | | | | Summary | | | | Summary | | | Average Summary | | Average | | | | Peer Group | | | | | | | Compensation | | Compensation | | Compensation | | Compensation | Compensation | | Compensation | | Total | | Total | | | | | | | Table Total for | | Actually Paid to | | Table Total for | | Actually Paid to | Table Total for | | Actually Paid to | | Shareholder | | Shareholder | | Net | | | | | Former PEO | | Former PEO | | Current PEO | | Current PEO | non-PEO NEOs | | non-PEO NEOs | | Return | | Return | | Income (Loss) | | EBIT | Year | | ($) | | ($)(1) | | ($) | | ($)(1) | ($) | | ($)(1) | | ($)(2) | | ($)(2) | | ($ millions) | | ($ millions)(3) | | | | | | | | | | | | | | | | | | | | | 2024 | | 4,055,300 | | (5,559,909) | | 7,466,597 | | 4,983,946 | 2,049,313 | | 261,738 | | 91.20 | | 108.19 | | (106) | | 643 | 2023 | | 11,779,768 | | 14,408,779 | | - | | - | 2,842,148 | | 2,967,069 | | 137.84 | | 109.91 | | (103) | | 943 | 2022 | | 12,244,474 | | 21,333,867 | | - | | - | 2,793,575 | | 3,925,060 | | 139.47 | | 106.60 | | 584 | | 753 | 2021 | | 10,794,495 | | 6,373,916 | | - | | - | 2,480,792 | | 1,992,573 | | 101.26 | | 139.20 | | 149 | | 680 | 2020 | | 8,783,162 | | 8,969,913 | | - | | - | 1,846,407 | | 1,473,863 | | 100.18 | | 125.67 | | 249 | | 579 |
| (1) | Amounts represent compensation actually paid to the Company’s 2024 Chief Executive Officers (referred to in this section as the Former PEO (Mr. Lopez) and Current PEO (Mr. Hardie)) and the average compensation actually paid to the remaining NEOs for the relevant fiscal year, as determined under SEC rules (and described below), which includes the individuals indicated in the table below for each fiscal year: |
| | | | | | | | | | Year | | Current PEO | Former PEO | Non-PEO NEOs | | | | | | 2024 | | Gordon J. Hardie | Andres A. Lopez | John A. Haudrich, Darrow A. Abrahams, Arnaud Aujouannet, Giancarlo Currarino, Vitaliano Torno | 2023 | | -- | Andres A. Lopez | John A. Haudrich, Darrow A. Abrahams, Arnaud Aujouannet, Vitaliano Torno | 2022 | | -- | Andres A. Lopez | John A. Haudrich, Darrow A. Abrahams, Arnaud Aujouannet, Vitaliano Torno | 2021 | | -- | Andres A. Lopez | John A. Haudrich, Darrow A. Abrahams, Arnaud Aujouannet, Vitaliano Torno, Giancarlo Currarino | 2020 | | -- | Andres A. Lopez | John A. Haudrich, Arnaud Aujouannet, Vitaliano Torno, Giancarlo Currarino, Miguel I. Alvarez, Mary Beth Wilkinson |
Compensation actually paid to the NEOs represents the “Total” compensation reported in the 2024 Summary Compensation Table for the applicable fiscal year, as adjusted as follows: | | | | | | | | | | | | | | | | | | | | | | | | | | | | Subtract amounts reported in the “Stock Awards” and “Option Awards” columns in the SCT for applicable FY | | YE Value of Current Year Award Outstanding as of YE | | Change in Value as of YE for Prior Year Awards Outstanding as of YE | | Change in Value as of Vesting Date for Prior Year Awards That Vested During the Year | | Value as of Prior YE for Prior Year Award Forfeited During the Year | | Change in Actuarial Value of Pension Benefits During Year | | Increase for Service Cost and, if applicable, Prior Service Cost for pension plans | | Total Adjustments | | Former PEO | | | | | | | | | | | | | | | | | | | | | | | | | | 2024 | | $ | - | | $ | - | | $ | (3,211,791) | | $ | (5,816,115) | | $ | - | | $ | (587,303) | | $ | - | | $ | (9,615,209) | | Current PEO | | | | | | | | | | | | | | | | | | | | | | | | | | 2024 | | | (6,479,626) | | | 4,013,282 | | | - | | | (16,307) | | | - | | | - | | | - | | | (2,482,651) | | Avg. Non-PEO NEOs | | | | | | | | | | | | | | | | | | | | | | | 2024 | | | (1,048,317) | | | 494,991 | | | (440,721) | | | (772,445) | | | - | | | (91,699) | | | 70,617 | | | (1,787,574) | | | | | | | | | | | | | | | | | | | | | | | | | | | |
| (2) | For the relevant year, represents the cumulative TSR (the “Peer Group TSR”) of the following peer companies (which comprise a packaging group consisting of companies with lines of business or product end uses comparable to those of the Company for which market quotations are available): AptarGroup, Inc., Ardagh Group S.A., Ball Corp., Crown Holdings, Inc., O-I Glass, Inc., Sealed Air Corp., Silgan Holdings Inc., and Sonoco Products Co. TSR amounts reported in the graph (both for O-I’s TSR and for the Peer Group TSR) assume an initial fixed investment of $100 in the Company’s common stock or in the peer group, as applicable, for the period beginning on December 31, 2019 through the end of the relevant fiscal year, and that all dividends, if any, were reinvested.I |
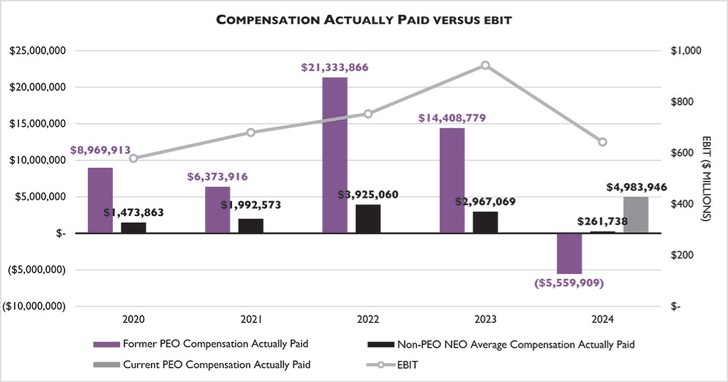
| (3) | EBIT is a non-GAAP measure. See Appendix A for a calculation of this measure. |
|
|
|
|
|
| Company Selected Measure Name |
|
|
EBIT
|
|
|
|
|
| Named Executive Officers, Footnote |
|
|
| (1) | Amounts represent compensation actually paid to the Company’s 2024 Chief Executive Officers (referred to in this section as the Former PEO (Mr. Lopez) and Current PEO (Mr. Hardie)) and the average compensation actually paid to the remaining NEOs for the relevant fiscal year, as determined under SEC rules (and described below), which includes the individuals indicated in the table below for each fiscal year: |
| | | | | | | | | | Year | | Current PEO | Former PEO | Non-PEO NEOs | | | | | | 2024 | | Gordon J. Hardie | Andres A. Lopez | John A. Haudrich, Darrow A. Abrahams, Arnaud Aujouannet, Giancarlo Currarino, Vitaliano Torno | 2023 | | -- | Andres A. Lopez | John A. Haudrich, Darrow A. Abrahams, Arnaud Aujouannet, Vitaliano Torno | 2022 | | -- | Andres A. Lopez | John A. Haudrich, Darrow A. Abrahams, Arnaud Aujouannet, Vitaliano Torno | 2021 | | -- | Andres A. Lopez | John A. Haudrich, Darrow A. Abrahams, Arnaud Aujouannet, Vitaliano Torno, Giancarlo Currarino | 2020 | | -- | Andres A. Lopez | John A. Haudrich, Arnaud Aujouannet, Vitaliano Torno, Giancarlo Currarino, Miguel I. Alvarez, Mary Beth Wilkinson |
|
|
|
|
|
| Peer Group Issuers, Footnote |
|
|
| (2) | For the relevant year, represents the cumulative TSR (the “Peer Group TSR”) of the following peer companies (which comprise a packaging group consisting of companies with lines of business or product end uses comparable to those of the Company for which market quotations are available): AptarGroup, Inc., Ardagh Group S.A., Ball Corp., Crown Holdings, Inc., O-I Glass, Inc., Sealed Air Corp., Silgan Holdings Inc., and Sonoco Products Co. TSR amounts reported in the graph (both for O-I’s TSR and for the Peer Group TSR) assume an initial fixed investment of $100 in the Company’s common stock or in the peer group, as applicable, for the period beginning on December 31, 2019 through the end of the relevant fiscal year, and that all dividends, if any, were reinvested.I |
|
|
|
|
|
| Adjustment To PEO Compensation, Footnote |
|
|
Compensation actually paid to the NEOs represents the “Total” compensation reported in the 2024 Summary Compensation Table for the applicable fiscal year, as adjusted as follows: | | | | | | | | | | | | | | | | | | | | | | | | | | | | Subtract amounts reported in the “Stock Awards” and “Option Awards” columns in the SCT for applicable FY | | YE Value of Current Year Award Outstanding as of YE | | Change in Value as of YE for Prior Year Awards Outstanding as of YE | | Change in Value as of Vesting Date for Prior Year Awards That Vested During the Year | | Value as of Prior YE for Prior Year Award Forfeited During the Year | | Change in Actuarial Value of Pension Benefits During Year | | Increase for Service Cost and, if applicable, Prior Service Cost for pension plans | | Total Adjustments | | Former PEO | | | | | | | | | | | | | | | | | | | | | | | | | | 2024 | | $ | - | | $ | - | | $ | (3,211,791) | | $ | (5,816,115) | | $ | - | | $ | (587,303) | | $ | - | | $ | (9,615,209) | | Current PEO | | | | | | | | | | | | | | | | | | | | | | | | | | 2024 | | | (6,479,626) | | | 4,013,282 | | | - | | | (16,307) | | | - | | | - | | | - | | | (2,482,651) | | Avg. Non-PEO NEOs | | | | | | | | | | | | | | | | | | | | | | | 2024 | | | (1,048,317) | | | 494,991 | | | (440,721) | | | (772,445) | | | - | | | (91,699) | | | 70,617 | | | (1,787,574) | | | | | | | | | | | | | | | | | | | | | | | | | | | |
|
|
|
|
|
| Non-PEO NEO Average Total Compensation Amount |
|
|
$ 2,049,313
|
$ 2,842,148
|
$ 2,793,575
|
$ 2,480,792
|
$ 1,846,407
|
| Non-PEO NEO Average Compensation Actually Paid Amount |
|
|
$ 261,738
|
2,967,069
|
3,925,060
|
1,992,573
|
1,473,863
|
| Adjustment to Non-PEO NEO Compensation Footnote |
|
|
Compensation actually paid to the NEOs represents the “Total” compensation reported in the 2024 Summary Compensation Table for the applicable fiscal year, as adjusted as follows: | | | | | | | | | | | | | | | | | | | | | | | | | | | | Subtract amounts reported in the “Stock Awards” and “Option Awards” columns in the SCT for applicable FY | | YE Value of Current Year Award Outstanding as of YE | | Change in Value as of YE for Prior Year Awards Outstanding as of YE | | Change in Value as of Vesting Date for Prior Year Awards That Vested During the Year | | Value as of Prior YE for Prior Year Award Forfeited During the Year | | Change in Actuarial Value of Pension Benefits During Year | | Increase for Service Cost and, if applicable, Prior Service Cost for pension plans | | Total Adjustments | | Former PEO | | | | | | | | | | | | | | | | | | | | | | | | | | 2024 | | $ | - | | $ | - | | $ | (3,211,791) | | $ | (5,816,115) | | $ | - | | $ | (587,303) | | $ | - | | $ | (9,615,209) | | Current PEO | | | | | | | | | | | | | | | | | | | | | | | | | | 2024 | | | (6,479,626) | | | 4,013,282 | | | - | | | (16,307) | | | - | | | - | | | - | | | (2,482,651) | | Avg. Non-PEO NEOs | | | | | | | | | | | | | | | | | | | | | | | 2024 | | | (1,048,317) | | | 494,991 | | | (440,721) | | | (772,445) | | | - | | | (91,699) | | | 70,617 | | | (1,787,574) | | | | | | | | | | | | | | | | | | | | | | | | | | | |
|
|
|
|
|
| Compensation Actually Paid vs. Total Shareholder Return |
|
|
|
|
|
|
|
| Compensation Actually Paid vs. Net Income |
|
|
|
|
|
|
|
| Compensation Actually Paid vs. Company Selected Measure |
|
|
|
|
|
|
|
| Total Shareholder Return Vs Peer Group |
|
|
|
|
|
|
|
| Tabular List, Table |
|
|
Management believes the following performance measures represent the most important financial performance measures used by the Company to link compensation actually paid to its NEOs for the fiscal year ended December 31, 2024:
|
|
|
|
|
| Total Shareholder Return Amount |
|
|
$ 91.2
|
137.84
|
139.47
|
101.26
|
100.18
|
| Peer Group Total Shareholder Return Amount |
|
|
108.19
|
109.91
|
106.6
|
139.2
|
125.67
|
| Net Income (Loss) |
|
|
$ (106,000,000)
|
$ (103,000,000)
|
$ 584,000,000
|
$ 149,000,000
|
$ 249,000,000
|
| Company Selected Measure Amount |
|
|
643,000,000
|
943,000,000
|
753,000,000
|
680,000,000
|
579,000,000
|
| PEO Name |
Andres A. Lopez
|
Gordon J. Hardie
|
|
|
|
|
|
| Measure:: 1 |
|
|
|
|
|
|
|
| Pay vs Performance Disclosure |
|
|
|
|
|
|
|
| Name |
|
|
EBIT
|
|
|
|
|
| Non-GAAP Measure Description |
|
|
| (3) | EBIT is a non-GAAP measure. See Appendix A for a calculation of this measure. |
|
|
|
|
|
| Measure:: 2 |
|
|
|
|
|
|
|
| Pay vs Performance Disclosure |
|
|
|
|
|
|
|
| Name |
|
|
FCF
|
|
|
|
|
| Measure:: 3 |
|
|
|
|
|
|
|
| Pay vs Performance Disclosure |
|
|
|
|
|
|
|
| Name |
|
|
ROIC
|
|
|
|
|
| Measure:: 4 |
|
|
|
|
|
|
|
| Pay vs Performance Disclosure |
|
|
|
|
|
|
|
| Name |
|
|
EPS
|
|
|
|
|
| Measure:: 5 |
|
|
|
|
|
|
|
| Pay vs Performance Disclosure |
|
|
|
|
|
|
|
| Name |
|
|
TSR
|
|
|
|
|
| Measure:: 6 |
|
|
|
|
|
|
|
| Pay vs Performance Disclosure |
|
|
|
|
|
|
|
| Name |
|
|
r-TSR
|
|
|
|
|
| Gordon J. Hardie |
|
|
|
|
|
|
|
| Pay vs Performance Disclosure |
|
|
|
|
|
|
|
| PEO Total Compensation Amount |
|
|
$ 7,466,597
|
|
|
|
|
| PEO Actually Paid Compensation Amount |
|
|
4,983,946
|
|
|
|
|
| Andres A. Lopez |
|
|
|
|
|
|
|
| Pay vs Performance Disclosure |
|
|
|
|
|
|
|
| PEO Total Compensation Amount |
|
|
4,055,300
|
$ 11,779,768
|
$ 12,244,474
|
$ 10,794,495
|
$ 8,783,162
|
| PEO Actually Paid Compensation Amount |
|
|
(5,559,909)
|
$ 14,408,779
|
$ 21,333,867
|
$ 6,373,916
|
$ 8,969,913
|
| PEO | Gordon J. Hardie |
|
|
|
|
|
|
|
| Pay vs Performance Disclosure |
|
|
|
|
|
|
|
| Adjustment to Compensation, Amount |
|
|
(2,482,651)
|
|
|
|
|
| PEO | Gordon J. Hardie | Aggregate Grant Date Fair Value of Equity Award Amounts Reported in Summary Compensation Table |
|
|
|
|
|
|
|
| Pay vs Performance Disclosure |
|
|
|
|
|
|
|
| Adjustment to Compensation, Amount |
|
|
(6,479,626)
|
|
|
|
|
| PEO | Gordon J. Hardie | Year-end Fair Value of Equity Awards Granted in Covered Year that are Outstanding and Unvested |
|
|
|
|
|
|
|
| Pay vs Performance Disclosure |
|
|
|
|
|
|
|
| Adjustment to Compensation, Amount |
|
|
4,013,282
|
|
|
|
|
| PEO | Gordon J. Hardie | Change in Fair Value as of Vesting Date of Prior Year Equity Awards Vested in Covered Year |
|
|
|
|
|
|
|
| Pay vs Performance Disclosure |
|
|
|
|
|
|
|
| Adjustment to Compensation, Amount |
|
|
(16,307)
|
|
|
|
|
| PEO | Andres A. Lopez |
|
|
|
|
|
|
|
| Pay vs Performance Disclosure |
|
|
|
|
|
|
|
| Adjustment to Compensation, Amount |
|
|
(9,615,209)
|
|
|
|
|
| PEO | Andres A. Lopez | Aggregate Change in Present Value of Accumulated Benefit for All Pension Plans Reported in Summary Compensation Table |
|
|
|
|
|
|
|
| Pay vs Performance Disclosure |
|
|
|
|
|
|
|
| Adjustment to Compensation, Amount |
|
|
(587,303)
|
|
|
|
|
| PEO | Andres A. Lopez | Year-over-Year Change in Fair Value of Equity Awards Granted in Prior Years That are Outstanding and Unvested |
|
|
|
|
|
|
|
| Pay vs Performance Disclosure |
|
|
|
|
|
|
|
| Adjustment to Compensation, Amount |
|
|
(3,211,791)
|
|
|
|
|
| PEO | Andres A. Lopez | Change in Fair Value as of Vesting Date of Prior Year Equity Awards Vested in Covered Year |
|
|
|
|
|
|
|
| Pay vs Performance Disclosure |
|
|
|
|
|
|
|
| Adjustment to Compensation, Amount |
|
|
(5,816,115)
|
|
|
|
|
| Non-PEO NEO |
|
|
|
|
|
|
|
| Pay vs Performance Disclosure |
|
|
|
|
|
|
|
| Adjustment to Compensation, Amount |
|
|
(1,787,574)
|
|
|
|
|
| Non-PEO NEO | Aggregate Change in Present Value of Accumulated Benefit for All Pension Plans Reported in Summary Compensation Table |
|
|
|
|
|
|
|
| Pay vs Performance Disclosure |
|
|
|
|
|
|
|
| Adjustment to Compensation, Amount |
|
|
(91,699)
|
|
|
|
|
| Non-PEO NEO | Aggregate Pension Adjustments Service Cost |
|
|
|
|
|
|
|
| Pay vs Performance Disclosure |
|
|
|
|
|
|
|
| Adjustment to Compensation, Amount |
|
|
70,617
|
|
|
|
|
| Non-PEO NEO | Aggregate Grant Date Fair Value of Equity Award Amounts Reported in Summary Compensation Table |
|
|
|
|
|
|
|
| Pay vs Performance Disclosure |
|
|
|
|
|
|
|
| Adjustment to Compensation, Amount |
|
|
(1,048,317)
|
|
|
|
|
| Non-PEO NEO | Year-end Fair Value of Equity Awards Granted in Covered Year that are Outstanding and Unvested |
|
|
|
|
|
|
|
| Pay vs Performance Disclosure |
|
|
|
|
|
|
|
| Adjustment to Compensation, Amount |
|
|
494,991
|
|
|
|
|
| Non-PEO NEO | Year-over-Year Change in Fair Value of Equity Awards Granted in Prior Years That are Outstanding and Unvested |
|
|
|
|
|
|
|
| Pay vs Performance Disclosure |
|
|
|
|
|
|
|
| Adjustment to Compensation, Amount |
|
|
(440,721)
|
|
|
|
|
| Non-PEO NEO | Change in Fair Value as of Vesting Date of Prior Year Equity Awards Vested in Covered Year |
|
|
|
|
|
|
|
| Pay vs Performance Disclosure |
|
|
|
|
|
|
|
| Adjustment to Compensation, Amount |
|
|
$ (772,445)
|
|
|
|
|
