FET Bearish Descent Targets Key $0.966 Level, More Dips Ahead?
03 Luglio 2024 - 2:30PM
NEWSBTC
Artificial Superintelligence Alliance (FET) is experiencing a
prolonged bearish trend, pushing its price closer to the critical
$0.966 support level. This sustained downward pressure has raised
concerns among investors, as the cryptocurrency continues to extend
its bearish momentum. The $0.966 resistance mark now serves
as a significant point of interest, determining whether FET can
reverse its current trajectory or continue its descent. Market
participants are closely monitoring these developments, analyzing
technical indicators and market sentiment to gauge the potential
for a rebound or further decline. This article aims to analyze the
extended bearish trend affecting the digital asset and its impact
on the cryptocurrency’s price as it approaches the $0.966
resistance level. FET’s price was trading at around $1.30 and was
down by 3.10% with a market capitalization of over $3 billion and a
trading volume of over $99 million as of the time of writing. There
has been a 24-hour decrease of 3.28% and 29.79% in FET’s market
capitalization and trading volume respectively. FET Price Under
Bearish Pressure Currently, FET on the 4-hour chart is actively
bearish trading below the 100-day Simple Moving Average (SMA) and
the bearish trend line, dropping toward the crucial $0.966
resistance mark. The 4-hour Composite Trend Oscillator also
confirms more bearishness for FET as both the signal line and the
SMA of the indicator continue to trend inside the oversold zone. On
the 1-day chart, it can be observed that FET is very bearish
trading below the 100-day SMA and the trend line. Following a
rejection at $1.862, the price of FET has been on an extended
bearish move heading toward the $0.966 support level. Lastly, the
1-day composite trend oscillator signals that FET may extend its
bearish trend toward the $0.966 support level as the signal line
and the SMA are still trending in the oversold zone. Will FET’s
Price Breakthrough Or Face A Rejection Conclusively, it can be
noted that as the price of FET continues to move toward the $0.966
resistance mark, it may break through its bearishness or face
rejection and begin to rise. Therefore, exploring the possible
outcomes of the coin, it was discovered that if FET’s price reaches
the $0.966 support level and breaks below, it may continue to
decline to test the $0.459 level and potentially move on to
challenge other lower levels if it breaches the $0.459 level.
However, if the crypto asset faces rejection at the $0.966 support
level, it will begin to ascend toward the $1.862 resistance level.
When this level is breached, it may continue to climb to test the
$2.564 resistance level and may move on to test other higher levels
if it breaches the $2.564 level. Featured image from Medium, chart
from Tradingview.com
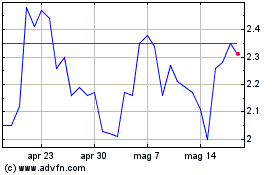
Grafico Azioni Fetch (COIN:FETUSD)
Storico
Da Ott 2024 a Nov 2024

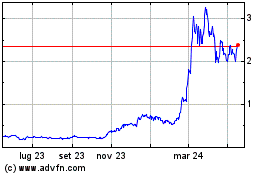
Grafico Azioni Fetch (COIN:FETUSD)
Storico
Da Nov 2023 a Nov 2024
