Old Bitcoin Whales Moving Coins: Will This Help Push BTC Above $74,000?
25 Aprile 2024 - 2:00AM
NEWSBTC
While Bitcoin struggles to extend gains, on-chain data shared by Ki
Young Ju, the founder of CryptoQuant, on
X shows increased movement of old coins. As the Bitcoin
Average Dormancy chart shows, this trend recently hit a 13-year
high. More Old Whales Moving Coins The Bitcoin Average
Dormancy shows the average number of days each BTC has been
dormant. On-chain data indicates that coins held for 3 to 5 years
have changed hands and moved to new owners. While there was
movement, interestingly, data shows that they were not transferred
to exchanges. Instead, it is highly likely that they were traded
over the counter (OTC). Related Reading: Brace For Impact:
Worldcoin Team Plans To Sell 1.5 Million WLD Tokens Every Week For
6 Months Usually, any transfer to centralized exchanges like
Binance or Coinbase could suggest the intention of selling. The
more coins hit these exchanges, especially from whales, the higher
the chance of price dumping. However, if trades are made via OTC,
the impact on spot rates is negligible, which is a positive for
bulls. Further analysis of these transfers using the Spent Output
Profit Ratio (SOPR) indicator suggests that whales moving them made
decent profits. Historically, whenever whales dump and register
profits, prices tend to dip. Will Bitcoin Prices Retest All-Time
Highs However, in a post on X, one analyst says prices will likely
increase because of the impact of spot Bitcoin exchange-traded
funds (ETFs). These derivatives are like a buffer against price
drops, considering the pace of inflows in the past weeks. Spot ETFs
allow institutions to gain regulated exposure to BTC. Coupled with
decreasing outflows from GBTC, the odds of prices rising remain
elevated. According to Lookonchain data, GBTC unloaded
750 BTC on April 23. However, Fidelity and other eight spot ETF
issuers bought 1,513 BTC on behalf of their clients. Spot Bitcoin
ETF issuers sell shares representing BTC holdings. These coins can
be purchased from secondary markets like Binance, via OTC
platforms, or directly from miners. BTC prices remain muted
and capped below $68,000, representing April 13 highs. Related
Reading: Solana Market Cap Skyrockets $11 Billion As Price Jumps
17% – Details To define the uptrend, there must be a high volume
expansion above this liquidation line, reversing recent
losses. Even so, looking at the BTCUSDT candlestick
arrangement in the daily chart, bulls must break above all-time
highs for a clear trend continuation. Ideally, the uptick above
$73,800 and the current range should be with expanding volumes,
confirming the presence of buyers. Feature image from DALLE, chart
from TradingView
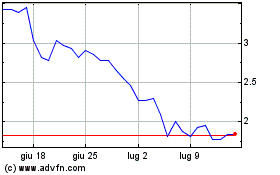
Grafico Azioni Worldcoin (COIN:WLDUSD)
Storico
Da Dic 2024 a Gen 2025

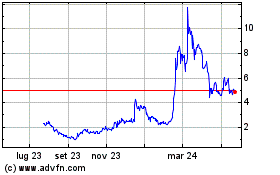
Grafico Azioni Worldcoin (COIN:WLDUSD)
Storico
Da Gen 2024 a Gen 2025
