BlackRock Greater Europe Investment Trust Plc Portfolio Update
29 Dicembre 2023 - 6:20PM
UK Regulatory
TIDMBRGE

The information contained in this release was correct as at 30 November 2023.

BLACKROCK GREATER EUROPE INVESTMENT TRUST PLC (LEI - 5493003R8FJ6I76ZUW55)

All information is at 30 November 2023 and unaudited.
Performance at month end with net income reinvested

                             One    Three   One    Three  Launch

                             Month  Months  Year   Years  (20 Sep 04)

Net asset value (undiluted)  11.1%  1.4%    13.0%  15.2%  682.3%
Share price                  12.5%  0.6%    10.7%  9.3%   638.1%
FTSE World Europe ex UK      6.3%   2.0%    10.3%  24.0%  394.4%

Sources: BlackRock and Datastream

At month end

Net asset value (capital only):      563.12p
Net asset value (including income):  563.29p
Share price:                         525.00p
Discount to NAV (including income):  6.8%
Net gearing:                         7.2%
Net yield1:                          1.3%
Total assets (including income):     £567.9m
Ordinary shares in issue2:           100,812,161
Ongoing charges3:                    0.98%

1  Based on an interim dividend of 1.75p per share and a final dividend of 5.00p
per share for the year ended 31 August 2023.

2  Excluding 17,116,777 shares held in treasury.
3  The Company's ongoing charges are calculated as a percentage of average daily
net assets and using the management fee and all other operating expenses
excluding finance costs, direct transaction costs, custody transaction charges,
VAT recovered, taxation, write back of prior year expenses and certain non
-recurring items for the year ended 31 August 2023.

Sector Analysis        Country Analysis         Total Assets (%)
Total Assets (%)       France                   21.2
Technology             Netherlands              18.2
25.0                   Switzerland              17.9
Industrials            Denmark                  15.4
24.0                   United Kingdom           7.1
Consumer               Sweden                   6.3
Discretionary   22.7   Ireland                  5.8
Health Care            Italy                    3.9
14.7                   Spain                    2.3
Financials             Belgium                  1.7
8.3                    Germany                  1.1
Consumer Staples       Net Current Liabilities  -0.9
3.3                                             -----
Basic Materials                                 100.0
2.9                                             =====
Net Current
Liabilities  -0.9

-----

100.0

=====

Top 10 holdings     Country         Fund %
Novo Nordisk        Denmark         9.1
RELX                United Kingdom  6.3
ASML                Netherlands     6.0
LVMH                France          5.1
BE Semiconductor    Netherlands     4.8
Hermès              France          4.2
STMicroelectronics  Switzerland     4.0
Ferrari             Italy           3.8
Safran              France          3.7
ASM International   Netherlands     3.4

Commenting on the markets, Stefan Gries and Alexandra Dangoor, representing the
Investment Manager noted:

During the month, the Company's NAV rose by 11.1% and the share price was up by
12.5%. For reference, the FTSE World Europe ex UK Index returned 6.3% during the
period.

November was an incredibly strong month for European ex UK markets. Economic
data released in November showed a continued fall in inflation: Eurozone
inflation dropped sharply to 2.4% from 2.9% in the previous month, which was the
lowest annual inflation number since July 2021. Lower energy, food and services
prices were the main drivers behind the improving inflation numbers. This led
investors to gain confidence that central banks have likely reached the peak of
their tightening cycles without causing significant damage to the economy.
Hence, markets rallied from oversold levels after having lost ground from August
to October.

The market was led by bond proxies such as real estate and risk assets including
IT, industrials, financials and consumer discretionary. Energy, health care and
consumer staples were the weakest performers in the market.

The Company outperformed its reference index during the month, driven by both
positive sector allocation and stock selection. In sector terms, the portfolio's
overweight allocation to IT and industrials aided returns. A lower weight to
commodities including energy and materials was also positive for relative
returns. Our zero exposure to real estate detracted during the month.

Semiconductor names BESI, STMicroelectronics and ASML rallied through the month.
Despite limited stock specific news, shares performed well given improving
smartphone demand data and a better environment for risk assets in general. An
update from American Nvidia also showed continued strong demand, particularly in
data centre end markets.

Speciality chemical distributor IMCD was amongst the top contributors. The
company guided to an improvement in end markets and IMCD specifically noted that
they expected to see an increase in volumes in Q4 versus Q3.

Shares in Partners Group performed strongly over the month, benefiting from an
improved rate environment and outlook for fundraising activity. We have spoken
to the company's CEO over the month, with management noting funding more readily
available and an optimistic outlook for deal making.

Royal Unibrew was the worst performer during the period. The company reported
weak Q3 results, with sales declining -1% versus expectations of 8% growth. This
was driven by much weaker volumes than anticipated, which the company attributed
to weather and price increases in Northern Europe in particular. The company
also marginally lowered guidance for the rest of the year in part due to a lower
contribution from the recently acquired Vrumona (soft drinks manufacturing)
business, bringing the reliability of the management team's execution into
question. We are monitoring the developments closely as part of a reassessment
of our investment thesis.

DSV also continued to underperform following the news of a CEO transition and
the announcement of a logistics joint venture with Saudi's NEOM city project, as
we discussed in last month's report. We would however note that management have
done a decent job explaining the potential of the project and the protection
mechanisms DSV have.

Outlook

The noise around market moves seems to increase with every passing year. We make
no attempt to predict to the basis point next quarters' GDP, inflation, or
unemployment number. Nor do we pay much heed to top-down indicators or what they
may reveal about the health of the global economy. From our point of view, the
world finds itself currently in the midst of several transitions: Covid to post
Covid, inflation to disinflation, low interest rates to high interest rates.

These dynamics must be considered when assessing the health of the global
economy and the prospects for equity markets. Various end markets may continue
to imply weak demand as inventories are run down, while others - perhaps those
associated with Chinese real estate - may have more prolonged problems.

However, assessing the economy from the bottom-up, company by company, we see no
reason for investors with a reasonable time horizon to be alarmed. Corporate
balance sheets are strong after 15 years of deleveraging, margins remain at
healthy levels and we may be at the foothills of an increase in capex spending
resulting in a `modern era industrial revolution'. Similarly, household debt
relative to assets is low in large economies, interest rate sensitivity is lower
than in previous cycles and real wages are growing.

As investors we must be forward looking, we must anticipate areas of enduring
demand and identify those special companies whose characteristics enable them to
capitalise on this demand and, in doing so, benefit their stakeholders and
shareholders. We remain optimistic about the prospects of companies held in our
portfolio.

29 December 2023

ENDS

Latest information is available by typing www.blackrock.com/uk/brge on the
internet, "BLRKINDEX" on Reuters, "BLRK" on Bloomberg or "8800" on Topic 3 (ICV
terminal).  Neither the contents of the Manager's website nor the contents of
any website accessible from hyperlinks on the Manager's website (or any other
website) is incorporated into, or forms part of, this announcement.


This information was brought to you by Cision http://news.cision.com


END
(END) Dow Jones Newswires
December 29, 2023 12:20 ET (17:20 GMT)
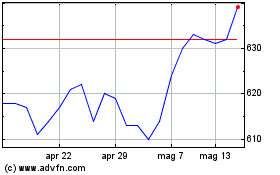
Grafico Azioni Blackrock Greater Europe... (LSE:BRGE)
Storico
Da Nov 2024 a Dic 2024

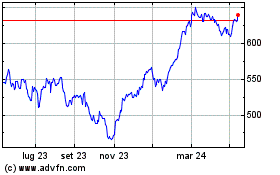
Grafico Azioni Blackrock Greater Europe... (LSE:BRGE)
Storico
Da Dic 2023 a Dic 2024
