Half Yearly Report -3-
23 Agosto 2010 - 8:00AM
UK Regulatory
level of customer service being delivered by the Group.
Principal risks and uncertainties
In a manner consistent with the Disclosure and Transparency Rules, the Board has
formally identified a number of principal risks and uncertainties that may
impact the business, reporting on these in full in its 2009 annual report and
accounts.  The purpose of so doing is to ensure that the Group is able to
arrange its affairs such that it can avoid the risk or mitigate the impact of
the risk occurring.  A number of these risks relate to the Group's day to day
operations, such as the risk of accidents occurring as a result of breaches of
health & safety standards or of environmental damage arising.
Other risks and uncertainties are inherent in the activity of speculative
housebuilding and are principally commercial in nature.  During the worsening
trading environment, the Group reviewed and reassessed the likelihood and impact
of risk occurring in this changing business environment.  Having done so, the
Group identified that the principal commercial risks of the business fell into a
number of categories, principally market driven risks around the ability to
deliver sales pricing and sales volume, legislative risks posed by planning and
legislation changes and liquidity risks given the difficulties in financial
markets.
Given the strong investment in new consented land over the last six months,
together with the Group's expectations of further investment in the near term,
the risks associated with delivering future sales volumes have lessened.  The
housing market has remained stable in terms of transactional activity and the
ability of the Group to trade from an increased number of sales outlets in
future periods will assist in achieving the targeted sales volumes.
Mortgage availability has improved during the first half of 2010 although still
constrained relative to the period prior to the housing market downturn, and
house prices have stabilised with small improvements within the new homes
market, with the south of England stronger than the Midlands and the north of
England.
Recent changes to the planning environment have increased the levels of
uncertainty around obtaining residential planning consents.  The Government has
been swift to announce its planned changes to the planning system and there
appears a heightened risk that a period of hiatus will arise as local planning
authorities react to the changing rules by slowing decision making.  There is
now a risk that certain areas of the country will see limited positive decisions
for planning consent for new homes until new planning legislation is released in
2011.  The strategy of the Group, implemented in the second half of 2009, to
invest significantly in land which already has a residential planning consent
will ensure that the Group has a strong pipeline of consented land on which to
develop during the next few years without being significantly impacted by the
aforementioned risks to planning.  Many of the Group's long term interests in
strategic land remain strong contenders for planning consent, although the
timing of such consents may be delayed by virtue of the current planning system
changes.
Cumulative sales
Cumulative sales achieved to 30 June 2010 for 2010 legal completion stood at
1,474 homes as compared to 1,364 homes at the same point last year.  Within
these totals, private sales stood at 1,150 homes in 2010 compared to 1,086 homes
in 2009, reflecting a 6% increase.  In the first half of the year, the Group
achieved a net private sales rate per site per week of 0.42 reservations, ahead
of the comparable net private sales rate achieved in the first half of 2009 of
0.39 reservations per site per week.
Prospects
Cumulative sales achieved to 20 August 2010 for 2010 legal completion stood at
1,637 homes as compared to 1,519 homes at the same point last year, an 8%
increase year over year.  Within this total, private sales now stand at 1,313
homes, up 5% on the 1,250 home sales achieved to the same point last year.
Based on the assumption that current housing market conditions prevail, the
Group is targeting the legal completion of c1,600 private homes during 2010 as
compared to 1,527 private home legal completions in 2009, representing an
increase of 5%.
The Group has traded well through the housing market downturn and is strongly
positioned to exploit opportunities to expand the Group based on investment at a
low point in the housing market cycle.  2010 will be a year of improved profit
performance and strong land acquisition, both of which will enable the Group to
demonstrate that it has added shareholder value in a tough operating
environment.  The Group will continue to use its strong balance sheet position
to invest in cost effective consented land opportunities in the near term with
the aim of increasing its land bank of consented plots.  This strategy will
increase the output capacity of the Group through holding a larger land bank
across an increased number of housing sites.  This new land has been acquired
based on acquisition appraisals which achieve returns in line with the Group's
hurdle rates using current sales prices.  Therefore, based on current market
conditions, these new sites will provide the Group the potential to improve
profit margins and investment returns over the coming years as these new sites
begin to deliver legal completions.  The combination of increased volume from a
greater number of sites with improved margins will contribute strongly to the
profit growth of the Group, without reliance on a general housing market
recovery.


Bovis Homes Group PLC
Group income statement

+---------------------------------+-------------+-+-------------+-+---------+-+-------------+-+-------------+-+----------+-+-------------+--+-------------+--+----------+--+
| For the six months ended 30     |         Six months ended 30 June          |          Six months ended 30 June          |          Year ended 31 December 2009          |
| June 2010                       |                   2010                    |                    2009                    |                                               |
+---------------------------------+-------------------------------------------+--------------------------------------------+-----------------------------------------------+
| (unaudited)                     |      Before | | Exceptional | |   Total | |      Before | | Exceptional | |    Total | |      Before |  | Exceptional |  |    Total |  |
|                                 | exceptional | |       items | |         | | exceptional | |       items | |          | | exceptional |  |       items |  |          |  |
|                                 |             | |             | |         | |       items | |             | |          | |       items |  |             |  |          |  |
|                                 |       items | |             | |         | |             | |             | |          | |             |  |             |  |          |  |
+---------------------------------+-------------+-+-------------+-+---------+-+-------------+-+-------------+-+----------+-+-------------+--+-------------+--+----------+--+
|                                 |      GBP000 | |      GBP000 | |  GBP000 | |      GBP000 | |      GBP000 | |   GBP000 | |      GBP000 |  |      GBP000 |  |   GBP000 |  |
+---------------------------------+-------------+-+-------------+-+---------+-+-------------+-+-------------+-+----------+-+-------------+--+-------------+--+----------+--+
|                                 |             | |             | |         | |             | |             | |          | |             |  |             |  |          |  |
+---------------------------------+-------------+-+-------------+-+---------+-+-------------+-+-------------+-+----------+-+-------------+--+-------------+--+----------+--+
| Revenue                         |     115,623 | |           - | | 115,623 | |     122,611 | |           - | |  122,611 | |     281,505 |  |           - |  |  281,505 |  |
+---------------------------------+-------------+-+-------------+-+---------+-+-------------+-+-------------+-+----------+-+-------------+--+-------------+--+----------+--+
| Cost of sales                   |     (96,806 | )|           - | | (96,806 | )|    (102,849 | )|      (9,843 | )| (112,692 | )|    (236,339 | )|       1,471 |  | (234,868 | )|
+---------------------------------+-------------+-+-------------+-+---------+-+-------------+-+-------------+-+----------+-+-------------+--+-------------+--+----------+--+
| Gross profit/(loss)             |      18,817 | |           - | |  18,817 | |      19,762 | |      (9,843 | )|    9,919 | |      45,166 |  |       1,471 |  |   46,637 |  |
+---------------------------------+-------------+-+-------------+-+---------+-+-------------+-+-------------+-+----------+-+-------------+--+-------------+--+----------+--+
| Administrative expenses         |     (13,997 | )|           - | | (13,997 | )|     (12,582 | )|           - | |  (12,582 | )|     (27,769 | )|           - |  |  (27,769 | )|
+---------------------------------+-------------+-+-------------+-+---------+-+-------------+-+-------------+-+----------+-+-------------+--+-------------+--+----------+--+
| Operating profit/(loss) before  |       4,820 | |           - | |   4,820 | |       7,180 | |      (9,843 | )|   (2,663 | )|      17,397 |  |       1,471 |  |   18,868 |  |
| financing costs                 |             | |             | |         | |             | |             | |          | |             |  |             |  |          |  |
+---------------------------------+-------------+-+-------------+-+---------+-+-------------+-+-------------+-+----------+-+-------------+--+-------------+--+----------+--+
| Financial income                |       1,363 | |           - | |   1,363 | |         764 | |           - | |      764 | |       2,304 |  |           - |  |    2,304 |  |
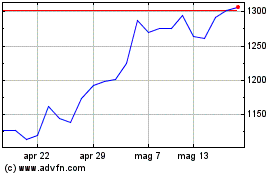
Grafico Azioni Vistry (LSE:VTY)
Storico
Da Giu 2024 a Lug 2024

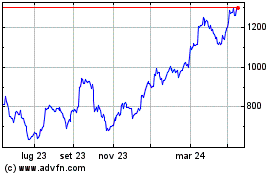
Grafico Azioni Vistry (LSE:VTY)
Storico
Da Lug 2023 a Lug 2024
