Half Yearly Report -4-
23 Agosto 2010 - 8:00AM
UK Regulatory
+---------------------------------+-------------+-+-------------+-+---------+-+-------------+-+-------------+-+----------+-+-------------+--+-------------+--+----------+--+
| Financial expenses              |      (2,634 | )|           - | |  (2,634 | )|      (6,708 | )|           - | |   (6,708 | )|     (12,178 | )|      (4,197 | )|  (16,375 | )|
+---------------------------------+-------------+-+-------------+-+---------+-+-------------+-+-------------+-+----------+-+-------------+--+-------------+--+----------+--+
| Net financing costs             |      (1,271 | )|           - | |  (1,271 | )|      (5,944 | )|           - | |   (5,944 | )|      (9,874 | )|      (4,197 | )|  (14,071 | )|
+---------------------------------+-------------+-+-------------+-+---------+-+-------------+-+-------------+-+----------+-+-------------+--+-------------+--+----------+--+
| Share of loss of equity         |         (30 | )|           - | |     (30 | )|           - | |           - | |        - | |           - |  |           - |  |        - |  |
| accounted entities              |             | |             | |         | |             | |             | |          | |             |  |             |  |          |  |
+---------------------------------+-------------+-+-------------+-+---------+-+-------------+-+-------------+-+----------+-+-------------+--+-------------+--+----------+--+
| Profit/(loss) before tax        |       3,519 | |           - | |   3,519 | |       1,236 | |      (9,843 | )|   (8,607 | )|       7,523 |  |      (2,726 | )|    4,797 |  |
+---------------------------------+-------------+-+-------------+-+---------+-+-------------+-+-------------+-+----------+-+-------------+--+-------------+--+----------+--+
| Income tax (expense)/credit     |      (1,126 | )|           - | |  (1,126 | )|        (725 | )|       2,756 | |    2,031 | |      (2,070 | )|         763 |  |   (1,307 | )|
+---------------------------------+-------------+-+-------------+-+---------+-+-------------+-+-------------+-+----------+-+-------------+--+-------------+--+----------+--+
| Profit/(loss) for the period    |       2,393 | |           - | |   2,393 | |         511 | |      (7,087 | )|   (6,576 | )|       5,453 |  |      (1,963 | )|    3,490 |  |
| attributable to equity          |             | |             | |         | |             | |             | |          | |             |  |             |  |          |  |
| holders of the parent           |             | |             | |         | |             | |             | |          | |             |  |             |  |          |  |
+---------------------------------+-------------+-+-------------+-+---------+-+-------------+-+-------------+-+----------+-+-------------+--+-------------+--+----------+--+
|                                 |             | |             | |         | |             | |             | |          | |             |  |             |  |          |  |
+---------------------------------+-------------+-+-------------+-+---------+-+-------------+-+-------------+-+----------+-+-------------+--+-------------+--+----------+--+
| Earnings/(loss) per share       |             | |             | |         | |             | |             | |          | |             |  |             |  |          |  |
+---------------------------------+-------------+-+-------------+-+---------+-+-------------+-+-------------+-+----------+-+-------------+--+-------------+--+----------+--+
| Basic                           |             | |             | |    1.8p | |             | |             | |    (5.5p | )|             |  |             |  |     2.8p |  |
+---------------------------------+-------------+-+-------------+-+---------+-+-------------+-+-------------+-+----------+-+-------------+--+-------------+--+----------+--+
| Diluted                         |             | |             | |    1.8p | |             | |             | |    (5.5p | )|             |  |             |  |     2.8p |  |
+---------------------------------+-------------+-+-------------+-+---------+-+-------------+-+-------------+-+----------+-+-------------+--+-------------+--+----------+--+


Bovis Homes Group PLC
Group statement of comprehensive income
+-----------------------------+----------+--+----------+--+----------+--+
| For the six months ended 30 |      Six |  |      Six |  |     Year |  |
| June 2010                   |   months |  |   months |  |    ended |  |
|                             |    ended |  |    ended |  |          |  |
+-----------------------------+----------+--+----------+--+----------+--+
| (unaudited)                 |  30 June |  |  30 June |  |   31 Dec |  |
|                             |     2010 |  |     2009 |  |     2009 |  |
+-----------------------------+----------+--+----------+--+----------+--+
|                             |   GBP000 |  |   GBP000 |  |   GBP000 |  |
+-----------------------------+----------+--+----------+--+----------+--+
|                             |          |  |          |  |          |  |
+-----------------------------+----------+--+----------+--+----------+--+
| Profit/(loss) for the       |    2,393 |  |   (6,576 | )|    3,490 |  |
| period                      |          |  |          |  |          |  |
+-----------------------------+----------+--+----------+--+----------+--+
| Actuarial losses on defined |   (3,340 | )|   (4,400 | )|   (4,210 | )|
| benefit pension scheme      |          |  |          |  |          |  |
+-----------------------------+----------+--+----------+--+----------+--+
| Deferred tax on actuarial   |      935 |  |    1,232 |  |    1,179 |  |
| movements on defined        |          |  |          |  |          |  |
| benefit pension scheme      |          |  |          |  |          |  |
+-----------------------------+----------+--+----------+--+----------+--+
| Total comprehensive         |      (12 | )|   (9,744 | )|      459 |  |
| (expense)/income for the    |          |  |          |  |          |  |
| period attributable to      |          |  |          |  |          |  |
| equity holders of the       |          |  |          |  |          |  |
| parent                      |          |  |          |  |          |  |
+-----------------------------+----------+--+----------+--+----------+--+

Bovis Homes Group PLC
Group balance sheet
+-----------------------------+----------+--+----------+--+----------+--+
| At 30 June 2010 (unaudited) |  30 June |  |  30 June |  |   31 Dec |  |
|                             |     2010 |  |     2009 |  |     2009 |  |
+-----------------------------+----------+--+----------+--+----------+--+
|                             |   GBP000 |  |   GBP000 |  |   GBP000 |  |
+-----------------------------+----------+--+----------+--+----------+--+
|                             |          |  |          |  |          |  |
+-----------------------------+----------+--+----------+--+----------+--+
| Assets                      |          |  |          |  |          |  |
+-----------------------------+----------+--+----------+--+----------+--+
| Property, plant and         |   11,500 |  |   11,895 |  |   11,574 |  |
| equipment                   |          |  |          |  |          |  |
+-----------------------------+----------+--+----------+--+----------+--+
| Available for sale          |   25,766 |  |   13,989 |  |   21,291 |  |
| financial assets            |          |  |          |  |          |  |
+-----------------------------+----------+--+----------+--+----------+--+
| Investments                 |    4,708 |  |       22 |  |       22 |  |
+-----------------------------+----------+--+----------+--+----------+--+
| Deferred tax assets         |    6,680 |  |    9,028 |  |    6,446 |  |
+-----------------------------+----------+--+----------+--+----------+--+
| Trade and other receivables |    2,162 |  |    2,343 |  |    2,213 |  |
+-----------------------------+----------+--+----------+--+----------+--+
| Total non-current assets    |   50,816 |  |   37,277 |  |   41,546 |  |
+-----------------------------+----------+--+----------+--+----------+--+
| Inventories                 |  700,859 |  |  689,490 |  |  630,709 |  |
+-----------------------------+----------+--+----------+--+----------+--+
| Trade and other receivables |   42,682 |  |   25,808 |  |   30,771 |  |
+-----------------------------+----------+--+----------+--+----------+--+
| Cash and cash equivalents   |   89,314 |  |    4,791 |  |  114,595 |  |
+-----------------------------+----------+--+----------+--+----------+--+
| Current tax asset           |        - |  |      859 |  |      831 |  |
+-----------------------------+----------+--+----------+--+----------+--+
| Total current assets        |  832,855 |  |  720,948 |  |  776,906 |  |
+-----------------------------+----------+--+----------+--+----------+--+
| Total assets                |  883,671 |  |  758,225 |  |  818,452 |  |
+-----------------------------+----------+--+----------+--+----------+--+
|                             |          |  |          |  |          |  |
+-----------------------------+----------+--+----------+--+----------+--+
| Equity                      |          |  |          |  |          |  |
+-----------------------------+----------+--+----------+--+----------+--+
| Issued capital              |   66,607 |  |   60,514 |  |   66,570 |  |
+-----------------------------+----------+--+----------+--+----------+--+
| Share premium               |  210,398 |  |  157,228 |  |  210,181 |  |
+-----------------------------+----------+--+----------+--+----------+--+
| Retained earnings           |  415,791 |  |  404,988 |  |  415,815 |  |
+-----------------------------+----------+--+----------+--+----------+--+
| Total equity attributable   |  692,796 |  |  622,730 |  |  692,566 |  |
| to equity holders of the    |          |  |          |  |          |  |
| parent                      |          |  |          |  |          |  |
+-----------------------------+----------+--+----------+--+----------+--+
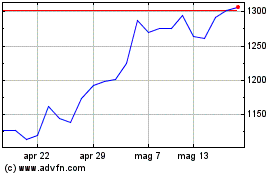
Grafico Azioni Vistry (LSE:VTY)
Storico
Da Giu 2024 a Lug 2024

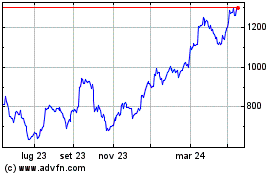
Grafico Azioni Vistry (LSE:VTY)
Storico
Da Lug 2023 a Lug 2024
