Half Yearly Report -7-
23 Agosto 2010 - 8:00AM
UK Regulatory
profit or loss during the period that the hedged forecast cash flows affect
profit or loss.  As the Group's current hedged instruments are currently
ineffective, movements are taken through the income statement so this will have
no practical impact.
IFRIC15 - Agreements for the Construction of Real Estate.  IFRIC15 provides
guidance on whether the construction of real estate should be accounted for
under IAS11 or IAS18.  The Group already accounts for the construction of real
estate in accordance with IFRIC15 and accordingly this interpretation which is
effective from 1 January 2010 will have no impact upon the Group.
Accounting policies for new transactions and events:
IAS20 - Accounting for Government Grants and Disclosure of Government
Assistance.  During the half year to 30 June 2010, the Group has been granted
assistance for the development of several sites by the Homes and Communities
Agency (HCA).  The grants issued by the HCA have been treated as government
grants under this accounting standard.
IAS31 - Interests in Joint Ventures.  Following the purchase of a 50% share in
Bovis Peer LLP, the Group has used the equity method of accounting for its
interest in the joint venture.
IFRS4 - Insurance Contracts.  The recent launch of the Group's 'The Perfect 10'
mortgage product in partnership with Barclays will provide Bovis Homes'
customers the ability to secure a 90% Loan To Value mortgage at a fixed interest
rate of 4.99% for two years.  Under the terms of the contract, the Group will
partly indemnify the bank if a borrower defaults and the bank repossesses and
incurs a financial loss in so doing.  The Group regards such contracts as
insurance contracts and they will be treated as such under this accounting
standard.  There is no practical effect on the half-yearly financial report but
an effect is expected on the full year financial statements.
2              Seasonality
In common with the rest of the UK housebuilding industry, activity occurs
year-round, but there are two principal selling seasons: spring and autumn.  As
these fall into two separate half years, the seasonality of the business is not
pronounced, although it is biased towards the second half of the year under
normal trading conditions.
3              Segmental reporting
All revenue and profit disclosed relate to continuing activities of the Group
and are derived from activities performed in the United Kingdom.
4              Exceptional items
The Group has reviewed the carrying costs of its inventory items, comparing the
carrying cost of the asset against estimates of net realisable value.  Net
realisable value has been arrived at using the Board's estimates of achievable
selling prices taking into account current market conditions, and after
deduction of an appropriate amount for selling costs.  No land write-down or
provision for onerous land contracts was made in the six months ended 30 June
2010 (six months ended 30 June 2009: GBP9.8 million total exceptional items;
year ended 31 December 2009: GBP2.7 million total exceptional items).
5              Earnings/(loss) per share
+------------------------+------------+--+------------+--+--------------+-+
| (unaudited)            | Six months |  | Six months |  |   Year ended | |
|                        |      ended |  |      ended |  |              | |
+------------------------+------------+--+------------+--+--------------+-+
|                        |    30 June |  |    30 June |  |  31 December | |
|                        |       2010 |  |       2009 |  |         2009 | |
+------------------------+------------+--+------------+--+--------------+-+
|                        |      pence |  |      pence |  |        pence | |
+------------------------+------------+--+------------+--+--------------+-+
|                        |            |  |            |  |              | |
+------------------------+------------+--+------------+--+--------------+-+
| Basic and diluted      |        1.8 |  |       (5.5 | )*|          2.8 | |
| earnings/(loss) per    |            |  |            |  |              | |
| share                  |            |  |            |  |              | |
+------------------------+------------+--+------------+--+--------------+-+
| Pre exceptional basic  |        1.8 |  |        0.4 |  |          4.4 | |
| and diluted earnings   |            |  |            |  |              | |
| per share              |            |  |            |  |              | |
+------------------------+------------+--+------------+--+--------------+-+
* As a loss per share cannot be reduced through dilution, the dilution
adjustment was not applied to the calculation of diluted earnings per share for
the six months ended 30 June 2009.
Basic earnings/(loss) per share
Basic earnings per ordinary share for the six months ended 30 June 2010 is
calculated on a profit after tax of GBP2,393,000 (six months ended 30 June 2009:
loss after tax of GBP6,576,000; year ended 31 December 2009: profit after tax of
GBP3,490,000) over the weighted average of 133,168,667 (six months ended 30 June
2009: 120,376,631; year ended 31 December 2009: 124,179,686) ordinary shares in
issue during the period.
Basic earnings per ordinary share before exceptional items for the six months
ended 30 June 2010 is calculated on the pre-exceptional profit after tax of
GBP2,393,000 (six months ended 30 June 2009: profit after tax of GBP511,000;
year ended 31 December 2009: profit after tax of GBP5,453,000).  There is no
basic earnings or loss per share on exceptional items for the six months ended
30 June 2010 (six months ended 30 June 2009: exceptional loss after tax of
GBP7,087,000; year ended 31 December 2009: exceptional loss after tax of
GBP1,963,000).  In all cases this is expressed on a per share basis using the
weighted average share information disclosed above.
Diluted earnings/(loss) per share
Under normal circumstances, the average number of shares is diluted by reference
to the average number of potential ordinary shares held under option during the
period.  This dilutive effect amounts to the number of ordinary shares which
would be purchased using the aggregate difference in value between the market
value of shares and the share option exercise price.  The market value of shares
has been calculated using the average ordinary share price during the period.
Only share options which have met their cumulative performance criteria have
been included in the dilution calculation.
The Group's diluted weighted average ordinary shares potentially in issue during
the six months ended 30 June 2010 was 133,207,512 (six months ended 30 June
2009: 120,392,032; year ended 31 December 2009: 124,203,192).
6              Dividends
The Board determined on 20 August 2010 that no interim dividend for 2010 be paid
(2009: nil).
7              Taxation
Income tax comprises the sum of the tax currently payable or receivable and
deferred tax.  Income tax is recognised in the income statement except to the
extent that it relates to items recognised directly in equity, in which case it
is recognised in equity.  The tax currently payable or receivable is based on
taxable profit or loss for the year and any adjustment to tax payable or
receivable in respect of previous years.  Taxable profit or loss differs from
net profit or loss as reported in the income statement because it excludes items
of income and expense that are taxable or deductible in other years and it
further excludes items that are never taxable or deductible.  The Group's
liability or asset for current tax was calculated using a rate of 28%.
Deferred tax is the tax expected to be payable or recoverable on differences
between the carrying amounts of assets and liabilities in the financial
statements and the corresponding tax bases used in the computation of taxable
profit, and is accounted for using the balance sheet liability method.  Deferred
tax liabilities are generally recognised for all taxable temporary differences
and deferred tax assets are recognised to the extent that it is probable that
taxable profits will be available against which deductible temporary differences
can be utilised.  Such assets and liabilities are not recognised if the
temporary differences arise from non-tax deductible goodwill, from the initial
recognition of assets and liabilities in a transaction that affects neither the
tax profit or the accounting profit, and from differences relating to
investments in subsidiaries to the extent that they will probably not reverse in
the foreseeable future.  The carrying amount of deferred tax assets is reviewed
at each balance sheet date and reduced to the extent that it is no longer
probable that sufficient taxable profits will be available to allow all or part
of the assets to be recovered.  Deferred tax is calculated at the tax rates that
are expected to apply in the period when the liability is settled or the asset
is realised.  Deferred tax is charged or credited in the income statement,
except when it relates to items charged or credited directly to reserves, in
which case the deferred tax is also dealt with in reserves.
8              Related party transactions
Transactions between fellow subsidiaries, which are related parties, during the
first half of 2010 have been eliminated on consolidation, as have transactions
between the Company and its subsidiaries during this period.  The Group's
associates and joint ventures are disclosed in the Group's Annual report and
accounts 2009.  Since 31 December 2009 the Group has invested in Bovis Peer LLP,
a joint venture.  The purpose of this entity is to invest in residential
property.
In the six months ended 30 June 2010, inventory was sold to Bovis Peer LLP for a
cash consideration of GBP25,859,250 (six months ended 30 June 2009: nil; year
ended 31 December 2009: nil).  Half of the revenue and profit in respect of the
sale to the joint venture has been eliminated from the Group results in
accordance with IAS 31.  Fees earned in respect of lettings management services
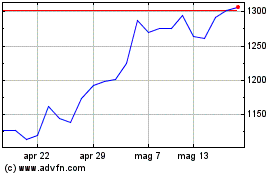
Grafico Azioni Vistry (LSE:VTY)
Storico
Da Giu 2024 a Lug 2024

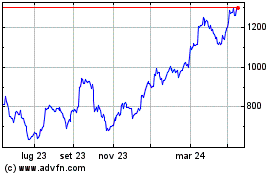
Grafico Azioni Vistry (LSE:VTY)
Storico
Da Lug 2023 a Lug 2024
