false
0000887596
0000887596
2024-02-15
2024-02-15
iso4217:USD
xbrli:shares
iso4217:USD
xbrli:shares
UNITED STATES
SECURITIES AND EXCHANGE COMMISSION
Washington, D.C. 20549
FORM 8-K
CURRENT REPORT
Pursuant to Section 13 OR 15(d) of
The Securities Exchange Act of 1934
Date of Report (Date of earliest event reported):
February 15, 2024
THE CHEESECAKE
FACTORY INCORPORATED
(Exact name of registrant as specified in its
charter)
| Delaware |
|
0-20574 |
|
51-0340466 |
| (State
or other jurisdiction |
|
(Commission |
|
(IRS
Employer |
| of
incorporation) |
|
File
Number) |
|
Identification
No.) |
26901
Malibu Hills Road
Calabasas Hills,
California |
|
91301 |
| (Address
of principal executive offices) |
|
(Zip
Code) |
Registrant’s telephone number, including
area code (818) 871-3000
Not Applicable
(Former name or former address, if changed since
last report.)
Check the appropriate box below if the Form 8-K
filing is intended to simultaneously satisfy the filing obligation of the registrant under any of the following provisions:
| ¨ | Written
communications pursuant to Rule 425 under the Securities Act (17 CFR 230.425) |
| ¨ | Soliciting
material pursuant to Rule 14a-12 under the Exchange Act (17 CFR 240.14a-12) |
| ¨ | Pre-commencement
communications pursuant to Rule 14d-2(b) under the Exchange Act (17 CFR 240.14d-2(b)) |
| ¨ | Pre-commencement
communications pursuant to Rule 13e-4(c) under the Exchange Act (17 CFR 240.13e-4(c)) |
Securities registered pursuant to Section 12(b) of the Act:
| Title of each class: |
|
Trading
Symbol(s) |
|
Name of each exchange on which registered: |
| Common
Stock, par value $.01 per share |
|
CAKE |
|
The
Nasdaq Stock Market LLC |
Indicate by check mark whether the registrant
is an emerging growth company as defined in Rule 405 of the Securities Act of 1933 (§230.405 of this chapter) or Rule 12b-2
of the Securities Exchange Act of 1934 (§240.12b-2 of this chapter).
Emerging
growth company ¨
If
an emerging growth company, indicate by check mark if the registrant has elected not to use the extended transition period for complying
with any new or revised financial accounting standards provided pursuant to Section 13(a) of the Exchange Act. ¨
The
following information under Item 2.02 of Form 8-K, “Results of Operations and Financial Condition” and Item 7.01 of Form
8-K, “Regulation FD Disclosure” is intended to be furnished. This information shall not be deemed “filed” for
purposes of Section 18 of the Securities Exchange Act of 1934, as amended (the “Exchange Act”), or incorporated by reference
in any filing under the Securities Act of 1933, as amended, or the Exchange Act, whether made before or after the date of this report,
regardless of any general incorporation language in the filing.
| ITEM
2.02 | RESULTS
OF OPERATIONS AND FINANCIAL CONDITION |
In
a press release dated February 21, 2024, a copy of which is furnished as Exhibit 99.1 to this report, The Cheesecake Factory Incorporated
(the “Company”) reported financial results for the fourth quarter of fiscal 2023, which ended on January 2, 2024.
| ITEM
7.01 | REGULATION
FD DISCLOSURE |
Also
on February 21, 2024, the Company posted an updated Investor Presentation on the Company’s Investor Relations website at investors.thecheesecakefactory.com.
A copy of the presentation is furnished as Exhibit 99.2 hereto and is incorporated by reference herein.
On February 15, 2024, the Board of Directors
of the Company (the “Board”) declared a quarterly cash dividend of $0.27 per share which will be paid on March 19, 2024 to
the stockholders of record of each share of the Company’s common stock at the close of business on March 6, 2024. Future decisions
to pay or to increase or decrease dividends are at the discretion of the Board and will depend upon operating performance and other factors.
| ITEM
9.01 | FINANCIAL STATEMENTS
AND EXHIBITS |
SIGNATURES
Pursuant
to the requirements of the Securities Exchange Act of 1934, the Registrant has duly caused this report to be signed on its behalf by
the undersigned hereunto duly authorized.
| Date: February
21, 2024 |
THE
CHEESECAKE FACTORY INCORPORATED |
| |
|
| |
By: |
/s/
Matthew E. Clark |
| |
|
Matthew
E. Clark |
| |
|
Executive
Vice President and Chief Financial Officer |
Exhibit 99.1
PRESS RELEASE
| FOR
IMMEDIATE RELEASE |
Contact:
Etienne Marcus |
| |
(818)
871-3000 |
| |
investorrelations@thecheesecakefactory.com |
THE CHEESECAKE
FACTORY REPORTS RESULTS FOR
FOURTH QUARTER
OF FISCAL 2023
CALABASAS
HILLS, Calif. – February 21, 2024 – The Cheesecake Factory Incorporated (NASDAQ: CAKE)
today reported financial results for the fourth quarter of fiscal 2023, which ended on January 2, 2024.
Total revenues
were $877.0 million in the fourth quarter of fiscal 2023 compared to $892.8 million in the fourth quarter of fiscal 2022. The fourth
quarter of fiscal 2023 included 13 weeks compared to 14 weeks in the fourth quarter of fiscal 2022. Excluding the impact of the
additional week in fiscal 2022, which contributed approximately $78.4 million in sales, total revenues for the fourth quarter of
fiscal 2023 increased 7.7% over the prior year period. Net income and diluted net income per share were $12.7 million and $0.26,
respectively, in the fourth quarter of fiscal 2023.
The Company recorded
a pre-tax net expense of $35.6 million related to impairment of assets and lease termination expenses and Fox Restaurant Concepts (“FRC”)
acquisition-related items. Excluding the after-tax impact of these items, adjusted net income and adjusted net income per share for the
fourth quarter of fiscal 2023 were $39.0 million and $0.80, respectively. Please see the Company’s reconciliation of non-GAAP financial
measures at the end of this press release.
Comparable restaurant
sales at The Cheesecake Factory restaurants increased 2.5% year-over-year in the fourth quarter of fiscal 2023 and increased 14.0% relative
to the fourth quarter of fiscal 2019, on an operating week basis.
“Our fourth
quarter results marked a strong finish to the year, with positive comparable sales growth and margin expansion contributing to record
annual revenue and solid earnings growth for the year,” said David Overton, Chairman and Chief Executive Officer. “Comparable
sales and traffic at The Cheesecake Factory restaurants outperformed the broader casual dining industry in the fourth quarter, demonstrating
the strength and resilience of our namesake brand and our ability to capture market share. Execution within our restaurants was outstanding
with our operators delivering improvements in labor productivity, food efficiency, wage management, and hourly staff and manager retention,
driving solid flow-through to support profitability.”
“During the
quarter we opened nine new restaurants to strong consumer demand, and on the international front two Cheesecake Factory restaurants opened
under licensing agreements, including the first location in Thailand. We believe we are well-positioned to build on this momentum and
continue accelerating unit growth to achieve our longer-term development objectives. As we look ahead, we remain intently focused on
leveraging our competitive strengths, including our scale, differentiated concepts and best-in-class operators to drive profitable growth
and meaningful shareholder value.”
26901
Malibu Hills Road, Calabasas Hills, CA 91301 ● Telephone (818) 871-3000
Development
During the fourth
quarter of fiscal 2023, the Company opened nine new restaurants, including three Cheesecake Factory restaurants, three North Italia restaurants
and three FRC restaurants. In addition, two Cheesecake Factory restaurants opened internationally under licensing agreements in China
and Thailand. Subsequent to quarter-end, the Company opened one North Italia restaurant, one Flower Child and one Culinary Dropout, and
one Cheesecake Factory restaurant opened internationally under a licensing agreement in Mexico.
Liquidity and
Capital Allocation
As
of January 2, 2024, the Company had total available liquidity of $292.8 million, including a cash balance of $56.3 million and availability
on its revolving credit facility of $236.5 million. Total principal amount of debt outstanding was $475 million, including $345 million
in principal amount of 0.375% convertible senior notes due 2026 and $130 million in principal amount drawn on the Company’s revolving
credit facility.
The
Company repurchased approximately 318,400 shares of its stock at a cost of $9.8 million in the fourth quarter of fiscal 2023. In addition,
the Company’s Board of Directors has declared a quarterly dividend of $0.27 per share to be paid on March 19, 2024 to shareholders
of record at the close of business on March 6, 2024.
Conference Call
and Webcast
The Company will
hold a conference call to review its results for the fourth quarter of fiscal 2023 today at 2:00 p.m. Pacific Time. The conference call
will be webcast live on the Company’s website at investors.thecheesecakefactory.com and a replay of the webcast will be available
through March 22, 2024.
About The Cheesecake Factory Incorporated
The Cheesecake
Factory Incorporated is a leader in experiential dining. We are culinary forward and relentlessly focused on hospitality. Delicious,
memorable experiences created by passionate people – this defines who we are and where we are going. We currently own and operate
334 restaurants throughout the United States and Canada under brands including The Cheesecake
Factory®, North Italia®, Flower Child® and a collection of other FRC brands. Internationally,
33 The Cheesecake Factory® restaurants operate under licensing agreements. Our bakery division operates two facilities
that produce quality cheesecakes and other baked products for our restaurants, international licensees and third-party bakery customers.
In 2023, we were named to the FORTUNE Magazine “100 Best Companies to Work For®” list for the tenth consecutive
year. To learn more, visit www.thecheesecakefactory.com, www.northitalia.com, www.iamaflowerchild.com and www.foxrc.com.
From
Fortune ©2024 Fortune Media IP Limited. All rights reserved. Used under license. Fortune and Fortune 100 Best Companies to Work
For are registered trademarks of Fortune Media IP Limited and are used under license. Fortune and Fortune Media IP Limited are not affiliated
with, and do not endorse products or services of, The Cheesecake Factory Incorporated.
26901
Malibu Hills Road, Calabasas Hills, CA 91301 ● Telephone (818) 871-3000
Safe
Harbor Statement
This press release
contains forward-looking statements within the meaning of the Private Securities Litigation Reform Act of 1995, as codified in Section
27A of the Securities Act of 1933, as amended, and Section 21E of the Securities Exchange Act of 1934, as amended. These statements include,
without limitation, statements regarding strength and resilience of the Company’s brand, ability to capture market share, operational
execution to support profitability, customer demand, accelerating unit growth, achievement of development objectives, profitable growth
and shareholder value. Such forward-looking statements include all other statements that are not historical facts, as well as statements
that are preceded by, followed by or that include words or phrases such as “believe,” “plan,” “will likely
result,” “expect,” “intend,” “will continue,” “is anticipated,” “estimate,”
“project,” “may,” “could,” “would,” “should” and similar expressions. These
statements are based on current expectations and involve risks and uncertainties which may cause results to differ materially from those
set forth in such statements. Investors are cautioned that forward-looking statements are not guarantees of future performance and that
undue reliance should not be placed on such statements. These forward-looking statements may be affected by various factors including:
economic, public health and political conditions that impact consumer confidence and spending, including increased interest rates, periods
of heightened inflation and market instability, and armed conflicts; supply chain disruptions; demonstrations, political unrest, potential
damage to or closure of the Company’s restaurants and potential reputational damage to the Company or any of its brands; pandemics
and related containment measures, including the potential for quarantines or restriction on in-person dining; acceptance and success
of The Cheesecake Factory in international markets; acceptance and success of North Italia, Flower Child and Other Fox Restaurant Concepts
restaurants; the risks of doing business abroad through Company-owned restaurants and/or licensees; foreign exchange rates, tariffs and
cross border taxation; changes in unemployment rates; increases in minimum wages and benefit costs; the economic health of the Company’s
landlords and other tenants in retail centers in which its restaurants are located, and the Company’s ability to successfully manage
its lease arrangements with landlords; the economic health of suppliers, licensees, vendors and other third parties providing goods or
services to the Company; the timing of new unit development and related permitting; compliance with debt covenants; strategic capital
allocation decisions including with respect to share repurchases or dividends; the ability to achieve projected financial results; the
resolution of uncertain tax positions with the Internal Revenue Service and the impact of tax reform legislation; changes in laws impacting
the Company’s business; adverse weather conditions in regions in which the Company’s restaurants are located; factors that
are under the control of government agencies, landlords and other third parties; the risks, costs and uncertainties associated with opening
new restaurants; and other risks and uncertainties detailed from time to time in the Company’s filings with the Securities and
Exchange Commission (“SEC”). Forward-looking statements speak only as of the dates on which they are made and the Company
undertakes no obligation to publicly update or revise any forward-looking statements or to make any other forward-looking statements,
whether as a result of new information, future events or otherwise, unless required to do so by law. Investors are referred to the full
discussion of risks and uncertainties associated with forward-looking statements and the discussion of risk factors contained in the
Company’s latest Annual Report on Form 10-K, Quarterly Reports on Form 10-Q and Current Reports on Form 8-K as filed with the SEC,
which are available at www.sec.gov.
26901
Malibu Hills Road, Calabasas Hills, CA 91301 ● Telephone (818) 871-3000
| The Cheesecake Factory Incorporated |
| Condensed Consolidated Financial Statements |
| (unaudited; in thousands, except per
share and statistical data) |
| |
| | |
13 Weeks
Ended | |
14 Weeks
Ended | |
52 Weeks
Ended | |
53 Weeks
Ended | |
| Consolidated
Statements of Income/(Loss) | |
January
2, 2024 | |
January
3, 2023 | |
January
2, 2024 | |
January
3, 2023 | |
| | |
Amount | |
Percent
of
Revenues | |
Amount | |
Percent
of
Revenues | |
Amount | |
Percent
of
Revenues | |
Amount | |
Percent
of
Revenues | |
| Revenues | |
$ | 877,009 | |
100.0 | % |
$ | 892,802 | |
| 100.0 | % |
$ | 3,439,503 | |
100.0 | % |
$ | 3,303,156 | |
100.0 | % |
| Costs and
expenses: | |
| | |
| |
| | |
| | |
| | |
| |
| | |
| |
| Food
and beverage cost | |
| 201,449 | |
23.0 | % |
| 220,469 | |
| 24.7 | % |
| 803,500 | |
23.4 | % |
| 810,926 | |
24.6 | % |
| Labor
expenses | |
| 308,555 | |
35.2 | % |
| 318,629 | |
| 35.7 | % |
| 1,227,895 | |
35.7 | % |
| 1,211,951 | |
36.7 | % |
| Other
operating costs and expenses | |
| 234,969 | |
26.8 | % |
| 237,783 | |
| 26.6 | % |
| 922,428 | |
26.8 | % |
| 881,627 | |
26.7 | % |
| General
and administrative expenses | |
| 54,683 | |
6.2 | % |
| 56,115 | |
| 6.3 | % |
| 217,449 | |
6.3 | % |
| 205,753 | |
6.2 | % |
| Depreciation
and amortization expenses | |
| 24,012 | |
2.7 | % |
| 25,616 | |
| 2.9 | % |
| 93,136 | |
2.7 | % |
| 92,380 | |
2.8 | % |
| Impairment
of assets and lease termination expenses | |
| 27,827 | |
3.2 | % |
| 31,074 | |
| 3.5 | % |
| 29,464 | |
0.9 | % |
| 31,387 | |
1.0 | % |
| Acquisition-related
contingent consideration, compensation and amortization expenses | |
| 7,796 | |
0.9 | % |
| 10,448 | |
| 1.2 | % |
| 11,686 | |
0.3 | % |
| 13,368 | |
0.4 | % |
| Preopening
costs | |
| 9,579 | |
1.1 | % |
| 7,791 | |
| 0.8 | % |
| 25,379 | |
0.7 | % |
| 16,829 | |
0.4 | % |
| Total
costs and expenses | |
| 868,870 | |
99.1 | % |
| 907,925 | |
| 101.7 | % |
| 3,330,937 | |
96.8 | % |
| 3,264,221 | |
98.8 | % |
| Income/(loss)
from operations | |
| 8,139 | |
0.9 | % |
| (15,123 | ) |
| (1.7 | )% |
| 108,566 | |
3.2 | % |
| 38,935 | |
1.2 | % |
| Interest
and other expense, net | |
| (2,483 | ) |
(0.3 | )% |
| (2,137 | ) |
| (0.2 | )% |
| (8,552 | ) |
(0.3 | )% |
| (6,043 | ) |
(0.2 | )% |
| Income/(loss)
before income taxes | |
| 5,656 | |
0.6 | % |
| (17,260 | ) |
| (1.9 | )% |
| 100,014 | |
2.9 | % |
| 32,892 | |
1.0 | % |
| Income
tax benefit | |
| (7,025 | ) |
(0.8 | )% |
| (13,962 | ) |
| (1.5 | )% |
| (1,337 | ) |
(0.0 | )% |
| (10,231 | ) |
(0.3 | )% |
| Net income/(loss) | |
$ | 12,681 | |
1.4 | % |
$ | (3,298 | ) |
| (0.4 | )% |
$ | 101,351 | |
2.9 | % |
$ | 43,123 | |
1.3 | % |
| | |
| | |
| |
| | |
| | |
| | |
| |
| | |
| |
| Basic net income/(loss) per
share | |
$ | 0.27 | |
| |
$ | (0.07 | ) |
| | |
$ | 2.10 | |
| |
$ | 0.87 | |
| |
| Basic weighted average shares
outstanding | |
| 47,828 | |
| |
| 48,951 | |
| | |
| 48,324 | |
| |
| 49,815 | |
| |
| | |
| | |
| |
| | |
| | |
| | |
| |
| | |
| |
| Diluted net income/(loss)
per share | |
$ | 0.26 | |
| |
$ | (0.07 | ) |
| | |
$ | 2.07 | |
| |
$ | 0.86 | |
| |
| Diluted weighted average
shares outstanding | |
| 48,609 | |
| |
| 48,951 | |
| | |
| 49,050 | |
| |
| 50,414 | |
| |
26901
Malibu Hills Road, Calabasas Hills, CA 91301 ● Telephone (818) 871-3000
| | |
13
Weeks Ended | | |
14
Weeks Ended | | |
52
Weeks Ended | | |
53
Weeks Ended | |
| Selected
Segment Information | |
January
2, 2024 | | |
January
3, 2023 | | |
January
2, 2024 | | |
January
3, 2023 | |
| Revenues: | |
| | | |
| | | |
| | | |
| | |
| The
Cheesecake Factory restaurants | |
$ | 658,445 | | |
$ | 674,467 | | |
$ | 2,595,066 | | |
$ | 2,528,043 | |
| North
Italia | |
| 67,224 | | |
| 65,514 | | |
| 258,878 | | |
| 228,622 | |
| Other
FRC | |
| 70,913 | | |
| 66,507 | | |
| 263,923 | | |
| 237,552 | |
| Other | |
| 80,427 | | |
| 86,314 | | |
| 321,636 | | |
| 308,939 | |
| Total | |
$ | 877,009 | | |
$ | 892,802 | | |
$ | 3,439,503 | | |
$ | 3,303,156 | |
| | |
| | | |
| | | |
| | | |
| | |
| Income/(loss) from operations: | |
| | | |
| | | |
| | | |
| | |
| The Cheesecake
Factory restaurants | |
$ | 65,363 | | |
$ | 50,872 | | |
$ | 297,063 | | |
$ | 220,765 | |
| North
Italia | |
| 3,201 | | |
| 3,553 | | |
| 18,515 | | |
| 13,934 | |
| Other
FRC | |
| 3,596 | | |
| 5,346 | | |
| 19,422 | | |
| 23,577 | |
| Other | |
| (64,021 | ) | |
| (74,894 | ) | |
| (226,434 | ) | |
| (219,341 | ) |
| Total | |
$ | 8,139 | | |
$ | (15,123 | ) | |
$ | 108,566 | | |
$ | 38,935 | |
| | |
| | | |
| | | |
| | | |
| | |
| Depreciation and amortization
expenses: | |
| | | |
| | | |
| | | |
| | |
| The Cheesecake
Factory restaurants | |
$ | 16,251 | | |
$ | 18,803 | | |
$ | 64,206 | | |
$ | 66,539 | |
| North
Italia | |
| 1,694 | | |
| 1,638 | | |
| 6,407 | | |
| 5,714 | |
| Other
FRC | |
| 2,289 | | |
| 1,519 | | |
| 7,916 | | |
| 6,231 | |
| Other | |
| 3,778 | | |
| 3,656 | | |
| 14,607 | | |
| 13,896 | |
| Total | |
$ | 24,012 | | |
$ | 25,616 | | |
$ | 93,136 | | |
$ | 92,380 | |
| | |
| | | |
| | | |
| | | |
| | |
| Impairment of assets and lease
termination expenses: | |
| | | |
| | | |
| | | |
| | |
| The Cheesecake
Factory restaurants | |
$ | 20,241 | | |
$ | 19,760 | | |
$ | 20,401 | | |
$ | 19,701 | |
| North
Italia | |
| 1,015 | | |
| - | | |
| 1,015 | | |
| - | |
| Other
FRC | |
| 2,527 | | |
| 3,909 | | |
| 2,582 | | |
| 3,909 | |
| Other | |
| 4,044 | | |
| 7,405 | | |
| 5,466 | | |
| 7,777 | |
| Total | |
$ | 27,827 | | |
$ | 31,074 | | |
$ | 29,464 | | |
$ | 31,387 | |
| | |
| | | |
| | | |
| | | |
| | |
| Preopening costs: | |
| | | |
| | | |
| | | |
| | |
| The Cheesecake
Factory restaurants | |
$ | 4,457 | | |
$ | 4,362 | | |
$ | 12,857 | | |
$ | 9,525 | |
| North
Italia | |
| 2,926 | | |
| 1,550 | | |
| 5,058 | | |
| 4,305 | |
| Other
FRC | |
| 1,998 | | |
| 1,004 | | |
| 6,482 | | |
| 1,361 | |
| Other | |
| 198 | | |
| 875 | | |
| 982 | | |
| 1,638 | |
| Total | |
$ | 9,579 | | |
$ | 7,791 | | |
$ | 25,379 | | |
$ | 16,829 | |
| | |
| | | |
| | | |
| | | |
| | |
26901 Malibu Hills Road, Calabasas Hills,
CA 91301 ● Telephone (818) 871-3000
| | |
13
Weeks Ended | | |
14
Weeks Ended | | |
52
Weeks Ended | | |
53
Weeks Ended | |
| The
Cheesecake Factory restaurants operating information: | |
January
2, 2024 | | |
January
3, 2023 | | |
January
2, 2024 | | |
January
3, 2023 | |
| Comparable
restaurant sales vs. prior year | |
| 2.5 | % | |
| 4.0 | % | |
| 3.0 | % | |
| 7.0 | % |
| Comparable
restaurant sales vs. 2019 | |
| 14.0 | % | |
| 11.4 | % | |
| 13.9 | % | |
| 10.5 | % |
| Restaurants
opened during period | |
| 3 | | |
| 2 | | |
| 6 | | |
| 3 | |
| Restaurants
open at period-end | |
| 216 | | |
| 211 | | |
| 216 | | |
| 211 | |
| Restaurant
operating weeks | |
| 2,783 | | |
| 2,939 | | |
| 11,010 | | |
| 11,052 | |
| | |
| | | |
| | | |
| | | |
| | |
| North Italia operating
information: | |
| | | |
| | | |
| | | |
| | |
| Comparable
restaurant sales vs. prior year | |
| 7 | % | |
| 9 | % | |
| 8 | % | |
| 15 | % |
| Comparable
restaurant sales vs. 2019 | |
| 34 | % | |
| 26 | % | |
| 31 | % | |
| 22 | % |
| Restaurants
opened during period | |
| 3 | | |
| 2 | | |
| 3 | | |
| 4 | |
| Restaurants
open at period-end | |
| 36 | | |
| 33 | | |
| 36 | | |
| 33 | |
| Restaurant
operating weeks | |
| 442 | | |
| 454 | | |
| 1,729 | | |
| 1,604 | |
| | |
| | | |
| | | |
| | | |
| | |
| Other
Fox Restaurant Concepts (FRC) operating information:(1) | |
| | | |
| | | |
| | | |
| | |
| Restaurants
opened during period | |
| 3 | | |
| 2 | | |
| 6 | | |
| 3 | |
| Restaurants
open at period-end | |
| 40 | | |
| 34 | | |
| 40 | | |
| 34 | |
| Restaurant
operating weeks | |
| 512 | | |
| 462 | | |
| 1,906 | | |
| 1,681 | |
| | |
| | | |
| | | |
| | | |
| | |
| Other
operating information:(2) | |
| | | |
| | | |
| | | |
| | |
| Restaurants
opened during period | |
| - | | |
| 2 | | |
| 1 | | |
| 3 | |
| Restaurants
open at period-end | |
| 39 | | |
| 40 | | |
| 39 | | |
| 40 | |
| Restaurant
operating weeks | |
| 519 | | |
| 558 | | |
| 2,074 | | |
| 2,072 | |
| | |
| | | |
| | | |
| | | |
| | |
| Number of company-owned
restaurants: | |
| | | |
| | | |
| | | |
| | |
| The Cheesecake
Factory | |
| 216 | | |
| | | |
| | | |
| | |
| North
Italia | |
| 36 | | |
| | | |
| | | |
| | |
| Other
FRC | |
| 40 | | |
| | | |
| | | |
| | |
| Other | |
| 39 | | |
| | | |
| | | |
| | |
| Total | |
| 331 | | |
| | | |
| | | |
| | |
| | |
| | | |
| | | |
| | | |
| | |
| Number of international-licensed
restaurants: | |
| | | |
| | | |
| | | |
| | |
| The Cheesecake
Factory | |
| 32 | | |
| | | |
| | | |
| | |
| (1) The Other FRC
segment includes all FRC brands except Flower Child. |
| (2) The
Other segment includes the Flower Child, Grand Lux Cafe and Social Monk Asian Kitchen concepts, as well as the Company's third-party
bakery, international and consumer packaged goods businesses, unallocated corporate expenses and gift card costs. |
| Selected
Consolidated Balance Sheet Information | |
January
2, 2024 | | |
January
3, 2023 | |
| Cash and cash equivalents | |
$ | 56,290 | | |
$ | 114,777 | |
| Long-term
debt, net of issuance costs (1) | |
| 470,047 | | |
| 468,032 | |
| (1)
Includes $340.0 million net balance of 0.375% convertible senior notes due 2026 (principal amount of $345 million less $5.0 million
in unamortized issuance costs) and $130 million drawn on the Company's revolving credit facility. The unamortized issuance costs
were recorded as a contra-liability and netted with long-term debt on the Condensed Consolidated Balance Sheet and are being amortized
as interest expense. |
26901 Malibu Hills Road, Calabasas Hills,
CA 91301 ● Telephone (818) 871-3000
Reconciliation of Non-GAAP Results
to GAAP Results
In addition to
the results provided in accordance with accounting principles generally accepted in the United States of America (“GAAP”)
in this press release, the Company is providing non-GAAP measurements which present net income/(loss) and net income/(loss) per share
excluding the impact of certain items. The non-GAAP measurements are intended to supplement the presentation of the Company’s financial
results in accordance with GAAP. These non-GAAP measures are calculated by eliminating from net income/(loss) and diluted net income/(loss)
per share the impact of items the Company does not consider indicative of its ongoing operations. The Company uses these non-GAAP financial
measures for financial and operational decision-making and as a means to evaluate period-to-period comparisons.
| The Cheesecake
Factory Incorporated |
| Reconciliation
of Non-GAAP Financial Measures |
| (unaudited;
in thousands, except per share data) |
| |
| | |
13 Weeks
Ended | |
14 Weeks
Ended | |
52 Weeks
Ended | |
53 Weeks
Ended | |
| | |
January
2, 2024 | |
January
3, 2023 | |
January
2, 2024 | |
January
3, 2023 | |
| Net
income/(loss) (GAAP) | |
$ | 12,681 | |
$ | (3,298 | ) |
$ | 101,351 | |
$ | 43,123 | |
| Impairment
of assets and lease termination expenses(1) | |
| 27,827 | |
| 31,074 | |
| 29,464 | |
| 31,387 | |
| Acquisition-related
contingent consideration, compensation and amortization expenses(2) | |
| 7,796 | |
| 10,448 | |
| 11,686 | |
| 13,368 | |
| Tax
effect of adjustments(3) | |
| (9,262 | ) |
| (10,795 | ) |
| (10,699 | ) |
| (11,637 | ) |
| Adjusted
net income (non-GAAP) | |
$ | 39,042 | |
$ | 27,429 | |
$ | 131,802 | |
$ | 76,241 | |
| | |
| | |
| | |
| | |
| | |
| Diluted
net income/(loss) per share (GAAP) | |
$ | 0.26 | |
$ | (0.07 | ) |
$ | 2.07 | |
$ | 0.86 | |
| Impairment
of assets and lease termination expenses | |
| 0.57 | |
| 0.63 | |
| 0.61 | |
| 0.62 | |
| Acquisition-related
contingent consideration, compensation and amortization expenses | |
| 0.16 | |
| 0.21 | |
| 0.24 | |
| 0.27 | |
| Tax
effect of adjustments | |
| (0.19 | ) |
| (0.22 | ) |
| (0.22 | ) |
| (0.23 | ) |
| Adjusted
net income per share (non-GAAP)(4) | |
$ | 0.80 | |
$ | 0.56 | |
$ | 2.69 | |
$ | 1.51 | |
| (1)
A detailed breakdown of impairment of assets and lease termination expenses recorded in the thirteen and fifty-two weeks ended January
2, 2024 and the fourteen and fifty-three weeks ended January 3, 2023 can be found in the Selected Segment Information table. |
| (2) Represents
changes in the fair value of the deferred consideration and contingent consideration and compensation liabilities related to the
North Italia and FRC acquisition, as well as amortization of acquired definite-lived licensing agreements. |
| (3) Based
on the federal statutory rate and an estimated blended state tax rate, the tax effect on all adjustments assumes a 26% tax rate for
the fiscal 2023 and 2022 periods. |
| (4) Adjusted
net income per share may not add due to rounding. |
26901
Malibu Hills Road, Calabasas Hills, CA 91301 ● Telephone (818) 871-3000
Exhibit 99.2
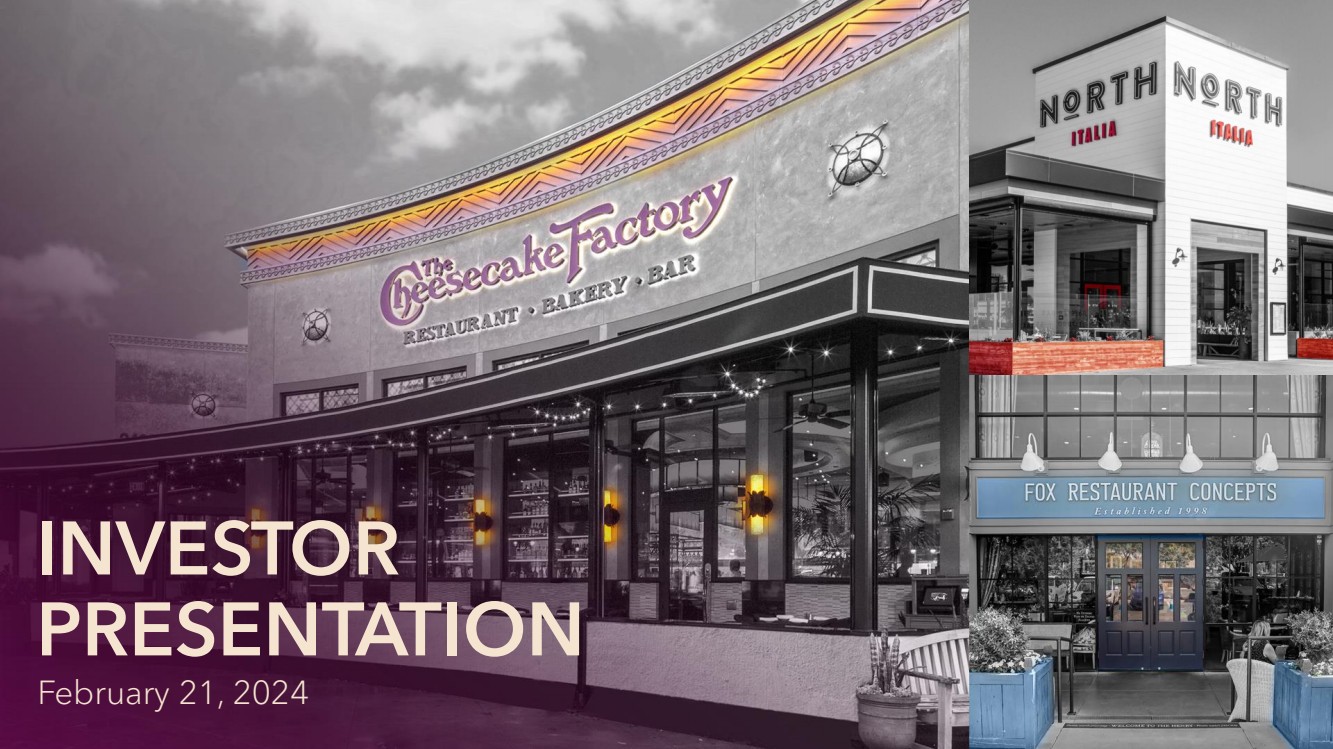
| INVESTOR
PRESENTATION
February 21, 2024 |
| SAFE HARBOR STATEMENT
2
This presentation contains forward-looking statements within the meaning of Section 27A of the Securities Act of 1933, as amended, and Section 21E of the Securities Exchange Act of
1934, as amended. This includes, without limitation, financial guidance and projections, including underlying assumptions, and statements with respect to expectations of the
Company’s future financial condition, results of operations, cash flows, plans, targets, goals, objectives, performance, growth potential, engines and opportunities and expected growth
rates; industry-leading comparable sales growth, retention and competitive position; quality control and supply chain efficiencies; operational execution and retention; annualized
average unit volume; the Company’s differentiation and strong foothold in the off-premise channel; statements from the Company’s corporate social responsibility report; the
opportunity for additional domestic and foreign locations and licensees and territories; target returns for new restaurant openings; international expansion; North Italia and Fox
Restaurant Concepts (“FRC”) as growth drivers and FRC as an incubation engine; new restaurant targeted ranges and unit growth rates.
Such forward-looking statements include all other statements that are not historical facts, as well as statements that are preceded by, followed by or that include words or phrases such
as “believe,” “plan,” “will likely result,” “expect,” “intend,” “will continue,” “is anticipated,” “estimate,” “project,” “may,” “could,” “would,” “should” and similar expressions. These
statements are based on current expectations and involve risks and uncertainties which may cause results to differ materially from those set forth in such statements. Investors are
cautioned that forward-looking statements are not guarantees of future performance and that undue reliance should not be placed on such statements. These forward-looking
statements may be affected by various factors including: economic, public health and political conditions that impact consumer confidence and spending, including increased interest
rates, periods of heightened inflation and market instability, and armed conflicts; supply chain disruptions; demonstrations, political unrest, potential damage to or closure of our
restaurants and potential reputational damage to us or any of our brands; pandemics and related containment measures, including the potential for quarantines or restriction on in-person dining; acceptance and success of The Cheesecake Factory in international markets; acceptance and success of North Italia and the FRC concepts; the risks of doing business
abroad through Company-owned restaurants and/or licensees; foreign exchange rates, tariffs and cross border taxation; changes in unemployment rates; increases in minimum wages
and benefit costs; the economic health of our landlords and other tenants in retail centers in which our restaurants are located, and our ability to successfully manage our lease
arrangements with landlords; the economic health of suppliers, licensees, vendors and other third parties providing goods or services to us; the timing of our new unit development
and related permitting; compliance with debt covenants; strategic capital allocation decisions including with respect to share repurchases or dividends; the ability to achieve projected
financial results; the resolution of uncertain tax positions with the Internal Revenue Service and the impact of tax reform legislation; changes in laws impacting our business; adverse
weather conditions in regions in which our restaurants are located; factors that are under the control of government agencies, landlords and other third parties; the risks, costs and
uncertainties associated with opening new restaurants; and other risks and uncertainties detailed from time to time in the Company’s filings with the Securities and Exchange
Commission (“SEC”). Forward-looking statements speak only as of the dates on which they are made and the Company undertakes no obligation to publicly update or revise any
forward-looking statements or to make any other forward-looking statements, whether as a result of new information, future events or otherwise, unless required to do so by law.
Investors are referred to the full discussion of risks and uncertainties associated with forward-looking statements and the discussion of risk factors contained in the Company’s latest
Annual Report on Form 10-K, Quarterly Reports on Form 10-Q and Current Reports on Form 8-K as filed with the SEC, which are available at www.sec.gov. |
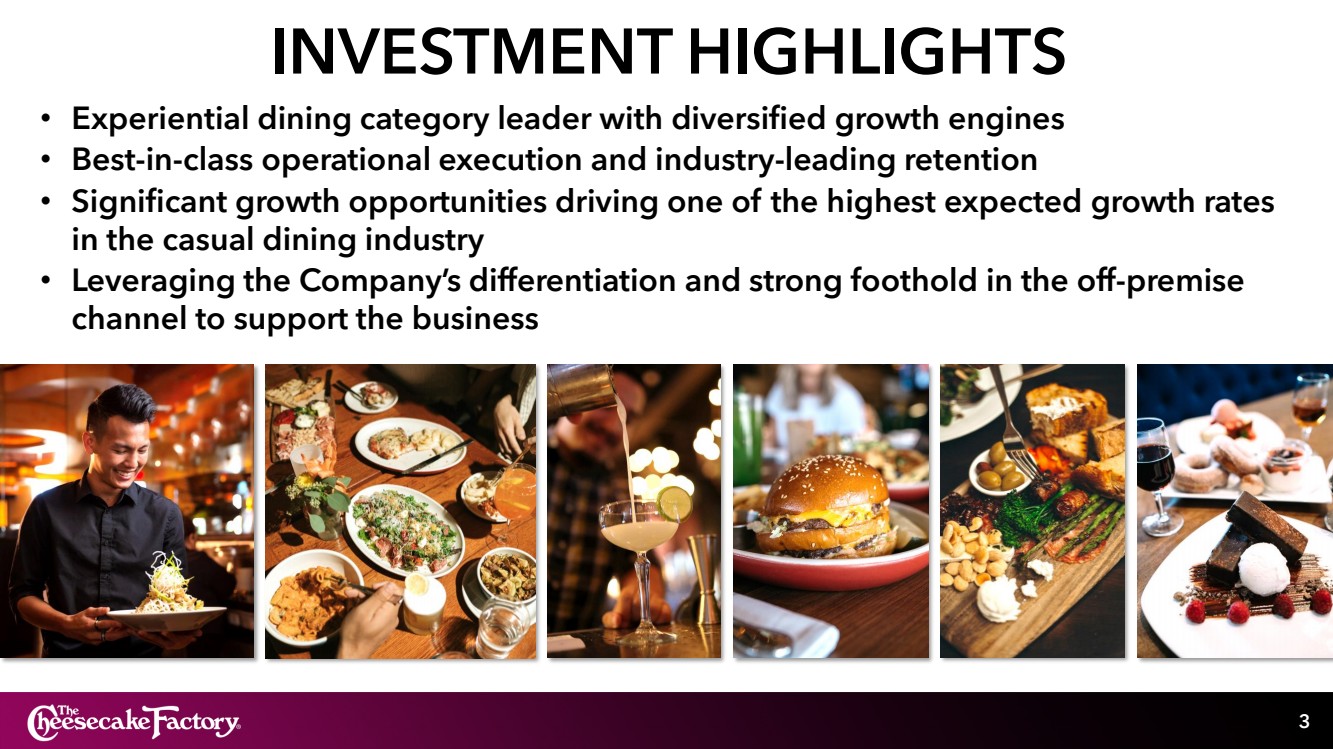
| INVESTMENT HIGHLIGHTS
3
• Experiential dining category leader with diversified growth engines
• Best-in-class operational execution and industry-leading retention
• Significant growth opportunities driving one of the highest expected growth rates
in the casual dining industry
• Leveraging the Company’s differentiation and strong foothold in the off-premise
channel to support the business |
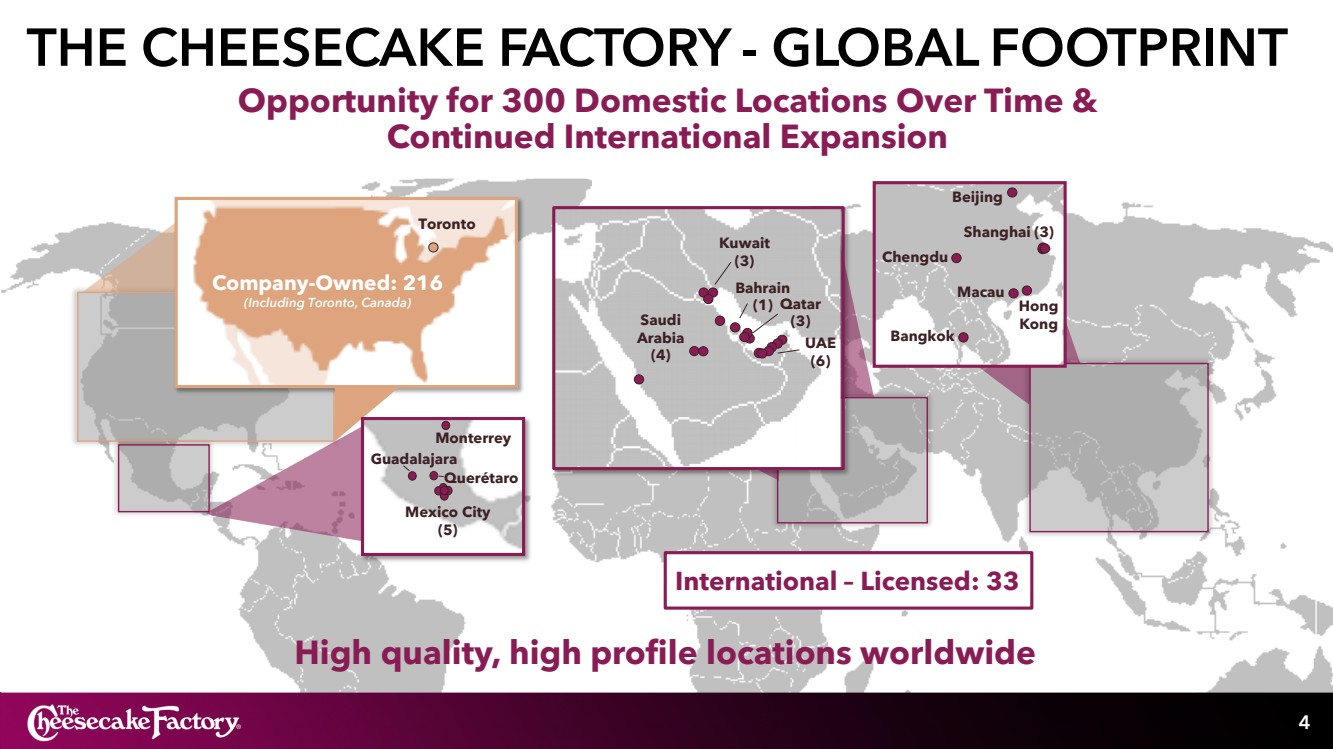
| THE CHEESECAKE FACTORY - GLOBAL FOOTPRINT
4
High quality, high profile locations worldwide
Company-Owned: 216
(Including Toronto, Canada)
Toronto
International – Licensed: 33
Mexico City
(5)
Guadalajara
Saudi
Arabia
(4)
UAE
(6)
Kuwait
(3)
Qatar
(3)
Bahrain
(1)
Monterrey
Opportunity for 300 Domestic Locations Over Time &
Continued International Expansion
Querétaro
Shanghai (3)
Hong
Kong
Beijing
Macau
Chengdu
Bangkok |
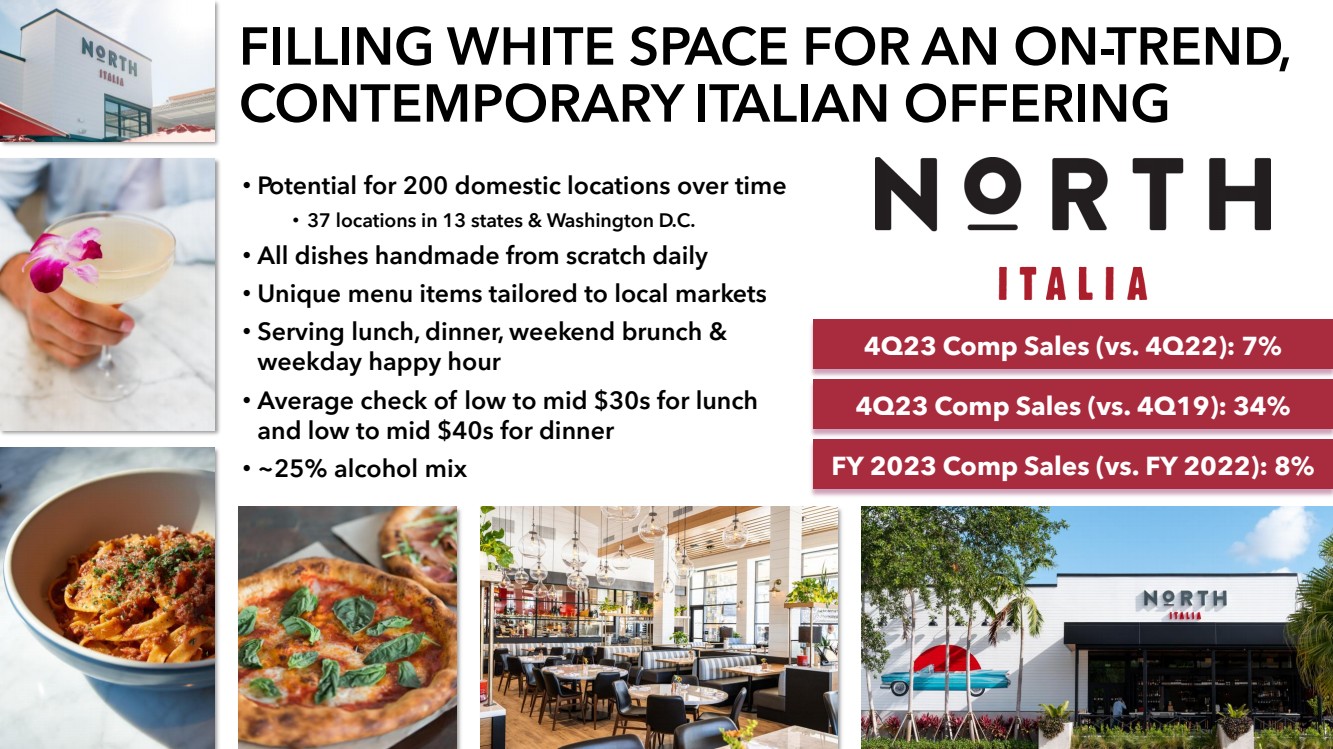
| 5
FILLING WHITE SPACE FOR AN ON-TREND,
CONTEMPORARY ITALIAN OFFERING
• Potential for 200 domestic locations over time
• 37 locations in 13 states & Washington D.C.
• All dishes handmade from scratch daily
• Unique menu items tailored to local markets
• Serving lunch, dinner, weekend brunch &
weekday happy hour
• Average check of low to mid $30s for lunch
and low to mid $40s for dinner
• ~25% alcohol mix
4Q23 Comp Sales (vs. 4Q22): 7%
4Q23 Comp Sales (vs. 4Q19): 34%
FY 2023 Comp Sales (vs. FY 2022): 8% |
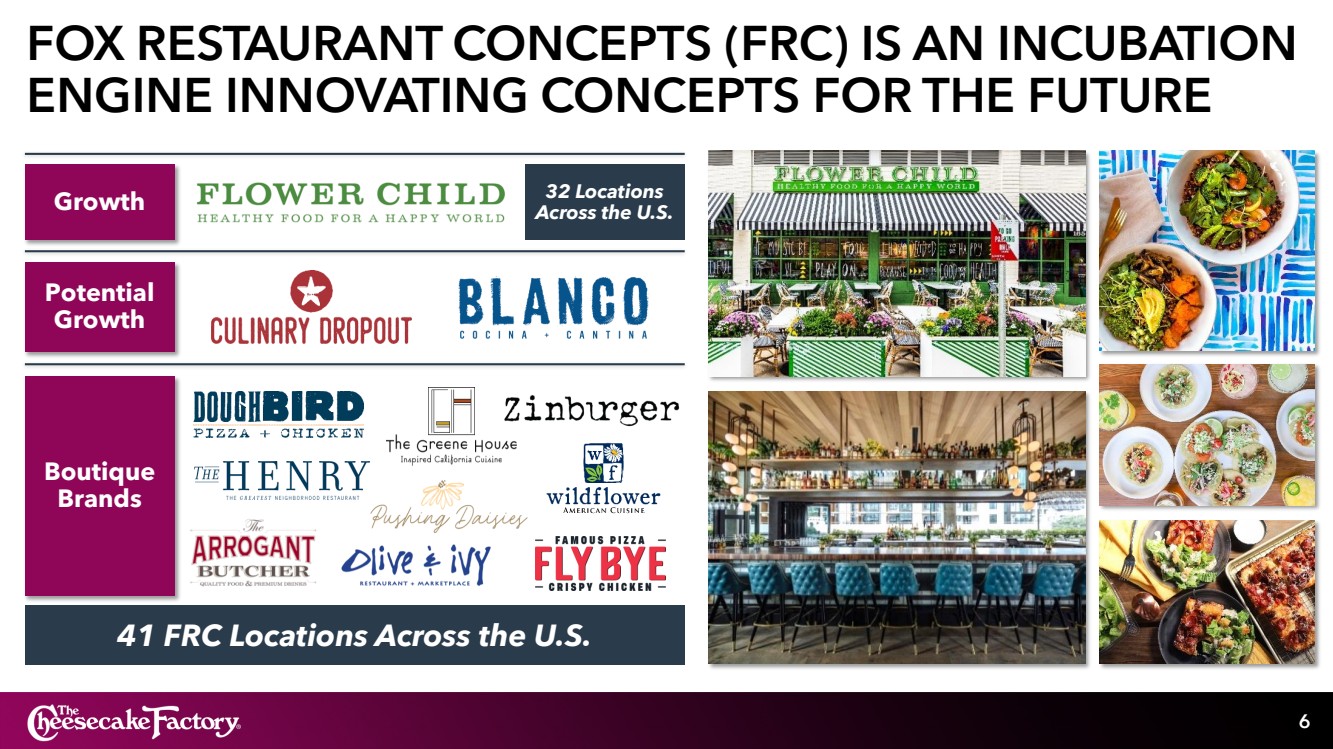
| FOX RESTAURANT CONCEPTS (FRC) IS AN INCUBATION
ENGINE INNOVATING CONCEPTS FOR THE FUTURE
6
Growth
Boutique
Brands
41 FRC Locations Across the U.S.
Potential
Growth
32 Locations
Across the U.S. |
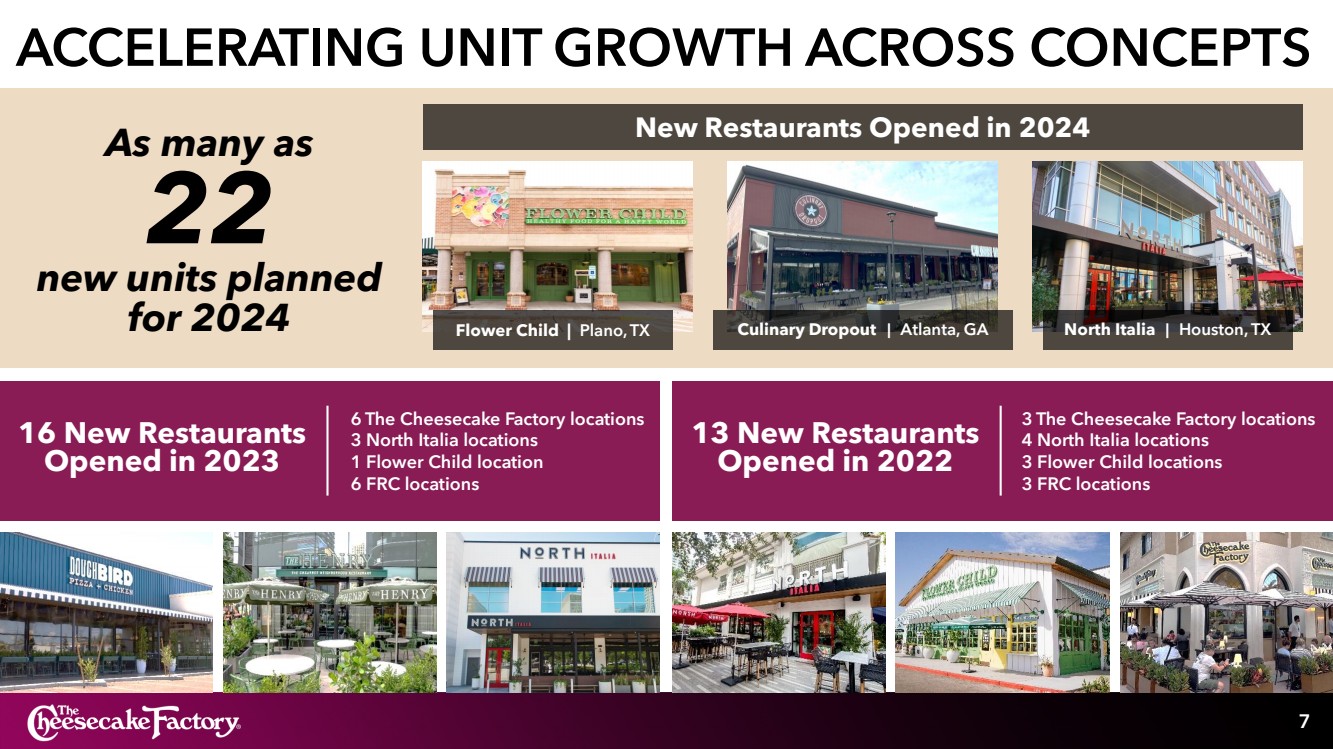
| 13 New Restaurants
Opened in 2022
3 The Cheesecake Factory locations
4 North Italia locations
3 Flower Child locations
3 FRC locations
16 New Restaurants
Opened in 2023
6 The Cheesecake Factory locations
3 North Italia locations
1 Flower Child location
6 FRC locations
ACCELERATING UNIT GROWTH ACROSS CONCEPTS
7
As many as
22
new units planned
for 2024
New Restaurants Opened in 2024
Flower Child | Plano, TX
Will add
on 2/21
Culinary Dropout | Atlanta, GA North Italia | Houston, TX |
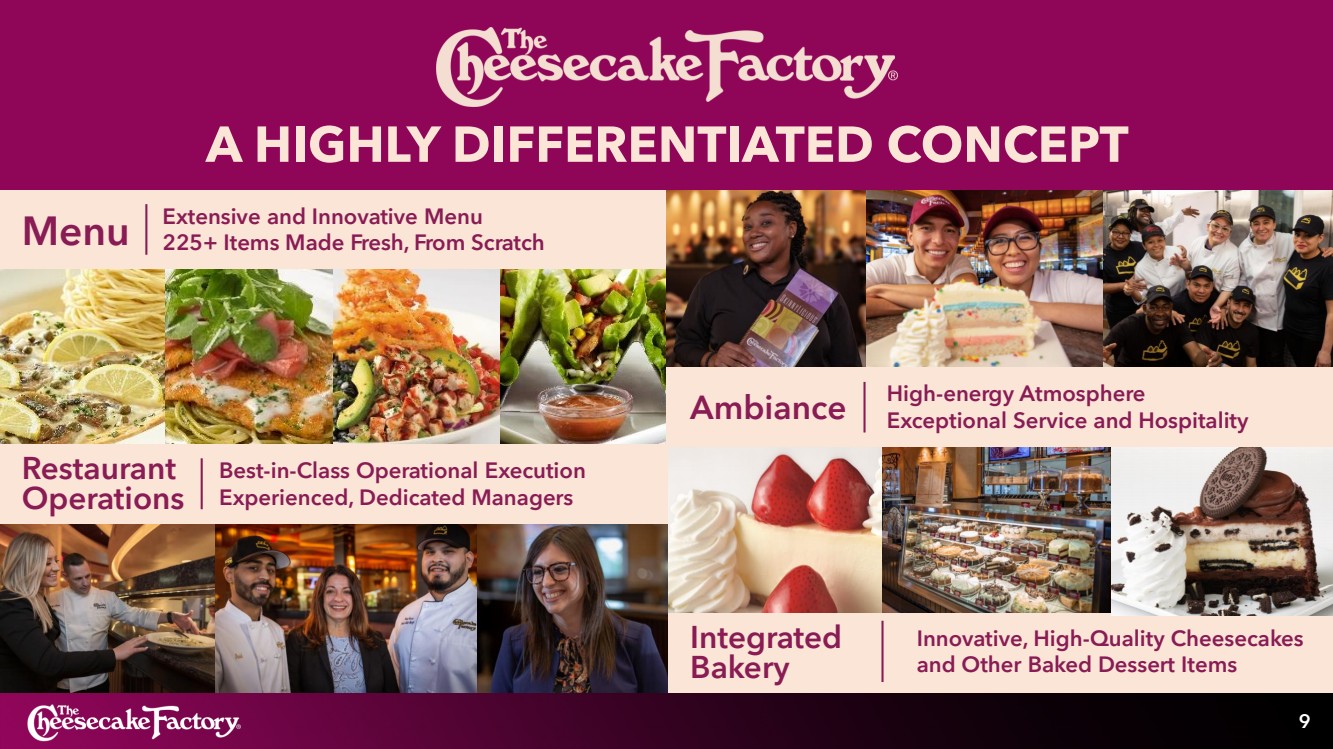
| 9
Extensive and Innovative Menu Menu 225+ Items Made Fresh, From Scratch
Innovative, High-Quality Cheesecakes
and Other Baked Dessert Items
Integrated
Bakery
Best-in-Class Operational Execution
Experienced, Dedicated Managers
Restaurant
Operations
A HIGHLY DIFFERENTIATED CONCEPT
High-energy Atmosphere Ambiance Exceptional Service and Hospitality |
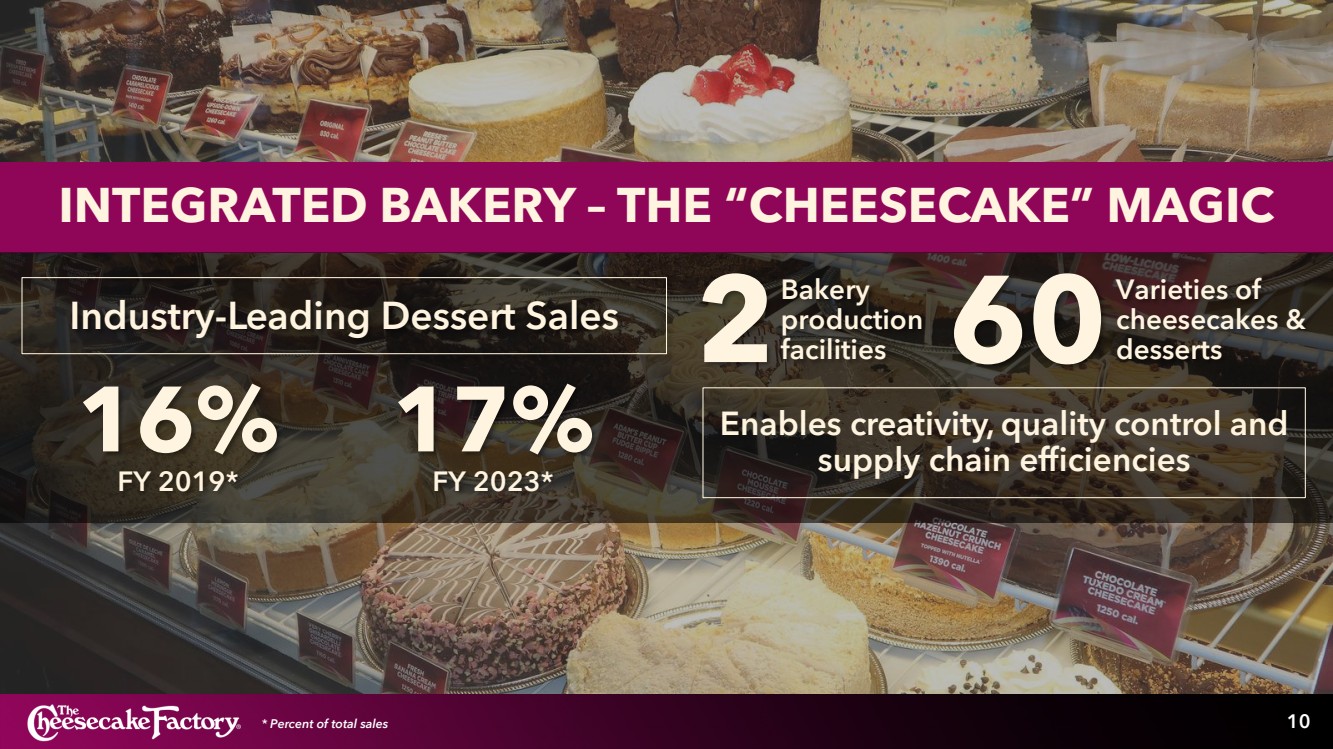
| 10
INTEGRATED BAKERY – THE “CHEESECAKE” MAGIC
Industry-Leading Dessert Sales
Enables creativity, quality control and
supply chain efficiencies
60 Varieties of
cheesecakes & 2 desserts
Bakery
production
facilities
* Percent of total sales
17%
FY 2023*
1
FY 2019*
6% |
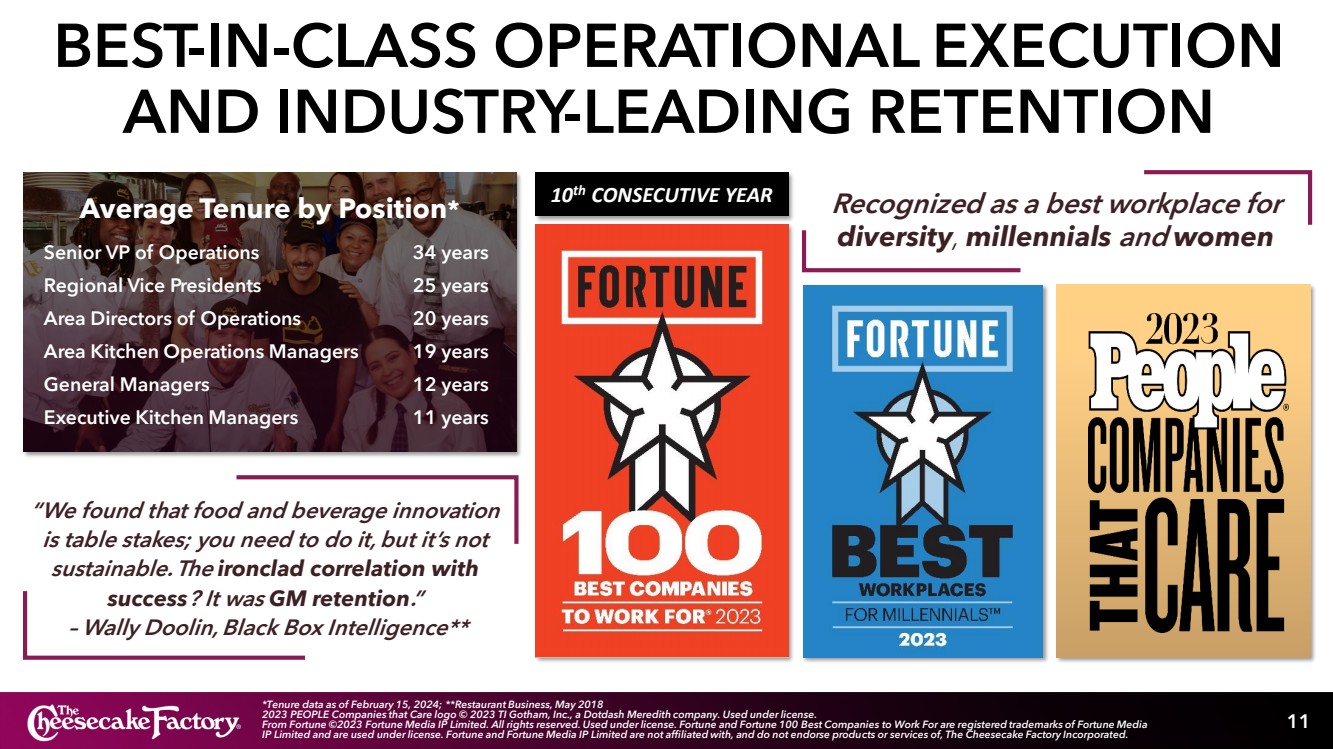
| BEST-IN-CLASS OPERATIONAL EXECUTION
AND INDUSTRY-LEADING RETENTION
11
“We found that food and beverage innovation
is table stakes; you need to do it, but it’s not
sustainable. The ironclad correlation with
success? It was GM retention.”
– Wally Doolin, Black Box Intelligence**
10th CONSECUTIVE YEAR Recognized as a best workplace for
diversity, millennials and women
Average Tenure by Position*
34 years
25 years
20 years
19 years
12 years
11 years
Senior VP of Operations
Regional Vice Presidents
Area Directors of Operations
Area Kitchen Operations Managers
General Managers
Executive Kitchen Managers
*Tenure data as of February 15, 2024; **Restaurant Business, May 2018
2023 PEOPLE Companies that Care logo © 2023 TI Gotham, Inc., a Dotdash Meredith company. Used under license.
From Fortune ©2023 Fortune Media IP Limited. All rights reserved. Used under license. Fortune and Fortune 100 Best Companies to Work For are registered trademarks of Fortune Media
IP Limited and are used under license. Fortune and Fortune Media IP Limited are not affiliated with, and do not endorse products or services of, The Cheesecake Factory Incorporated. |

| CULT STATUS & STRONG CONSUMER ENGAGEMENT
12
Reaching
5M+ users
5M fans 1M+ followers
350K
followers
Millions of
Viewers
Note: Statistics as of February 6, 2024
360K
followers |
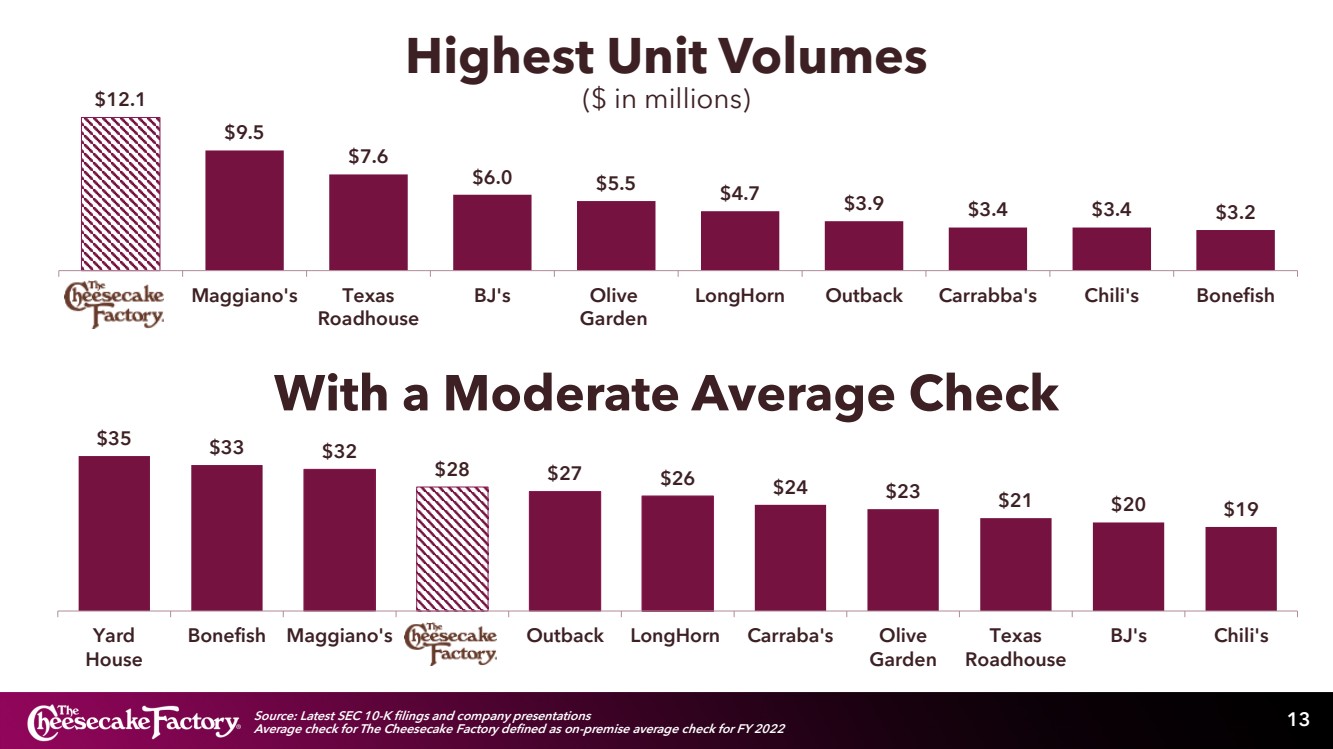
| $12.1
$9.5
$7.6
$6.0 $5.5 $4.7 $3.9 $3.4 $3.4 $3.2
Maggiano's Texas
Roadhouse
BJ's Olive
Garden
LongHorn Outback Carrabba's Chili's Bonefish
With a Moderate Average Check
Highest Unit Volumes
($ in millions)
Source: Latest SEC 10-K filings and company presentations
Average check for The Cheesecake Factory defined as on-premise average check for FY 2022
$35 $33 $32
$28 $27 $26 $24 $23 $21 $20 $19
Yard
House
Bonefish Maggiano's Outback LongHorn Carraba's Olive
Garden
Texas
Roadhouse
BJ's Chili's
13 |
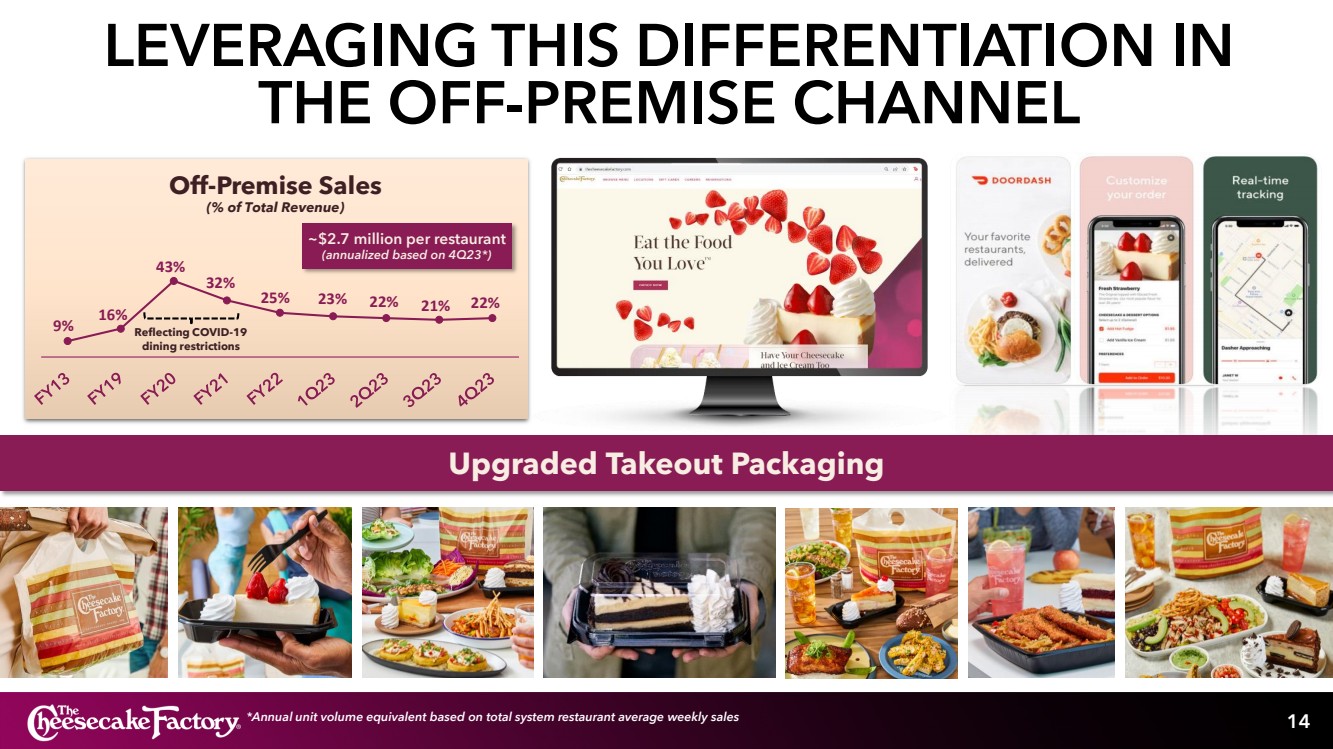
| LEVERAGING THIS DIFFERENTIATION IN
THE OFF-PREMISE CHANNEL
14 *Annual unit volume equivalent based on total system restaurant average weekly sales
9%
16%
43%
32%
25% 23% 22% 21% 22%
Off-Premise Sales
(% of Total Revenue)
~$2.7 million per restaurant
(annualized based on 4Q23*)
Reflecting COVID-19
dining restrictions
Upgraded Takeout Packaging |

| FURTHER LEANING IN TO CONVENIENCE
15 |
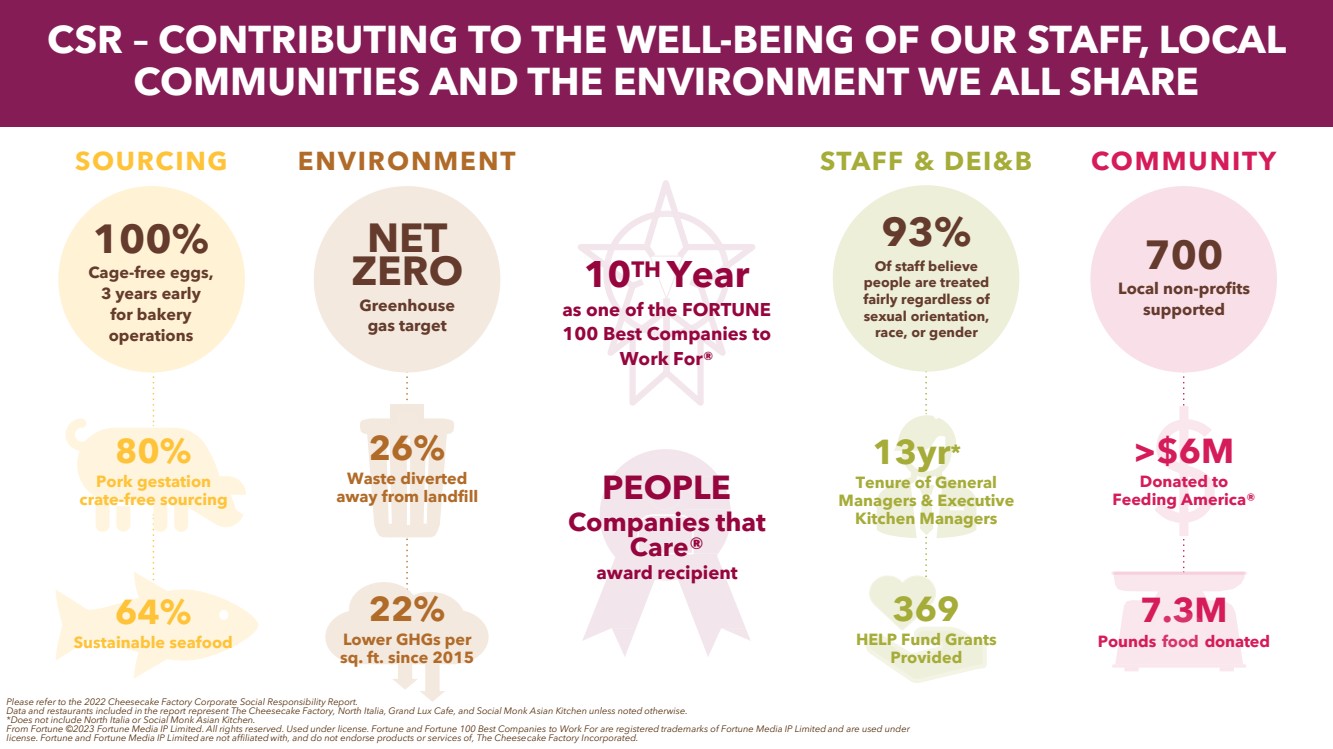
| >$6M
Donated to
Feeding America®
93%
Of staff believe
people are treated
fairly regardless of
sexual orientation,
race, or gender
26%
Waste diverted
away from landfill
369
HELP Fund Grants
Provided
22%
Lower GHGs per
sq. ft. since 2015
7.3M
Pounds food donated
SOURCING ENVIRONMENT STAFF & DEI&B COMMUNITY
NET
ZERO
Greenhouse
gas target
80%
Pork gestation
crate-free sourcing
64%
Sustainable seafood
700
Local non-profits
supported
13yr*
Tenure of General
Managers & Executive
Kitchen Managers
CSR – CONTRIBUTING TO THE WELL-BEING OF OUR STAFF, LOCAL
COMMUNITIES AND THE ENVIRONMENT WE ALL SHARE
Please refer to the 2022 Cheesecake Factory Corporate Social Responsibility Report.
Data and restaurants included in the report represent The Cheesecake Factory, North Italia, Grand Lux Cafe, and Social Monk Asian Kitchen unless noted otherwise.
*Does not include North Italia or Social Monk Asian Kitchen.
From Fortune ©2023 Fortune Media IP Limited. All rights reserved. Used under license. Fortune and Fortune 100 Best Companies to Work For are registered trademarks of Fortune Media IP Limited and are used under
license. Fortune and Fortune Media IP Limited are not affiliated with, and do not endorse products or services of, The Cheesecake Factory Incorporated.
10TH Year
as one of the FORTUNE
100 Best Companies to
Work For®
PEOPLE
Companies that
Care®
award recipient
100%
Cage-free eggs,
3 years early
for bakery
operations |

| Confidential
17
Financial Resiliency
Sales Leadership
Growth Opportunities |
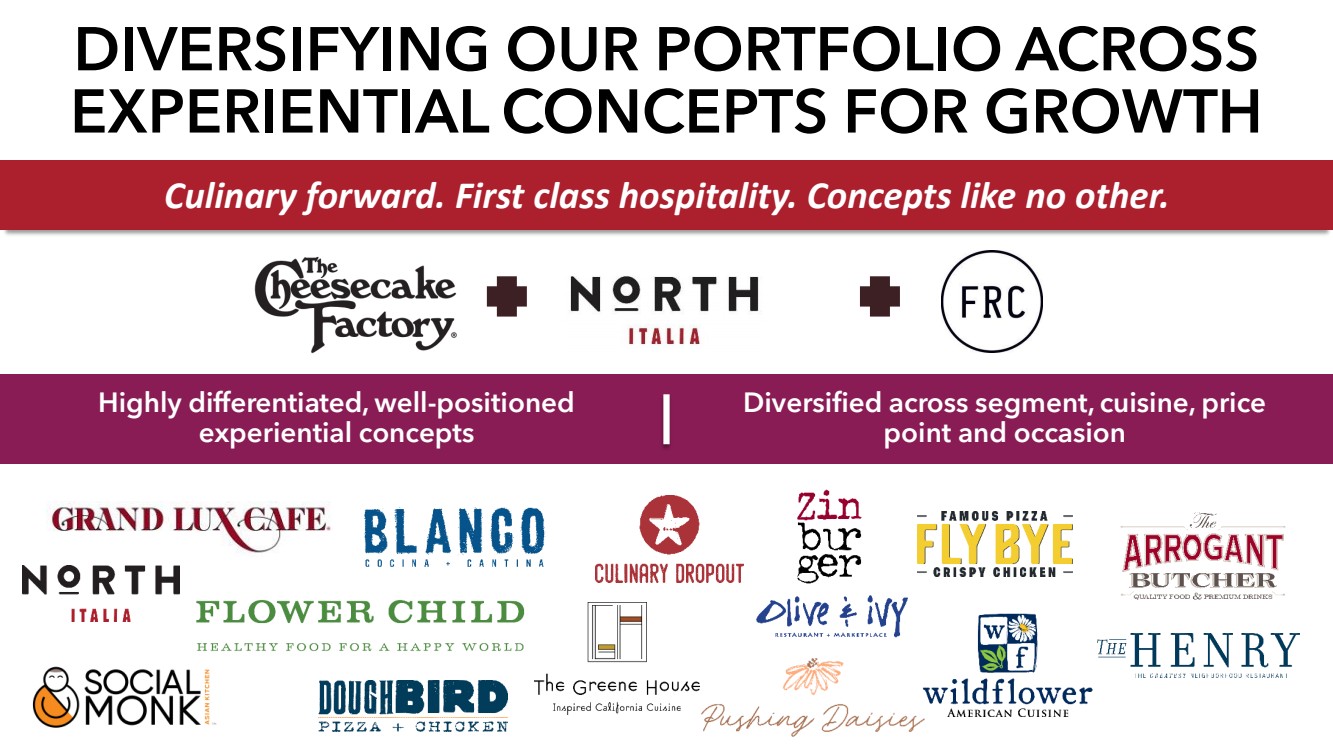
| Culinary forward. First class hospitality. Concepts like no other.
DIVERSIFYING OUR PORTFOLIO ACROSS
EXPERIENTIAL CONCEPTS FOR GROWTH
Diversified across segment, cuisine, price
point and occasion
Highly differentiated, well-positioned
experiential concepts |
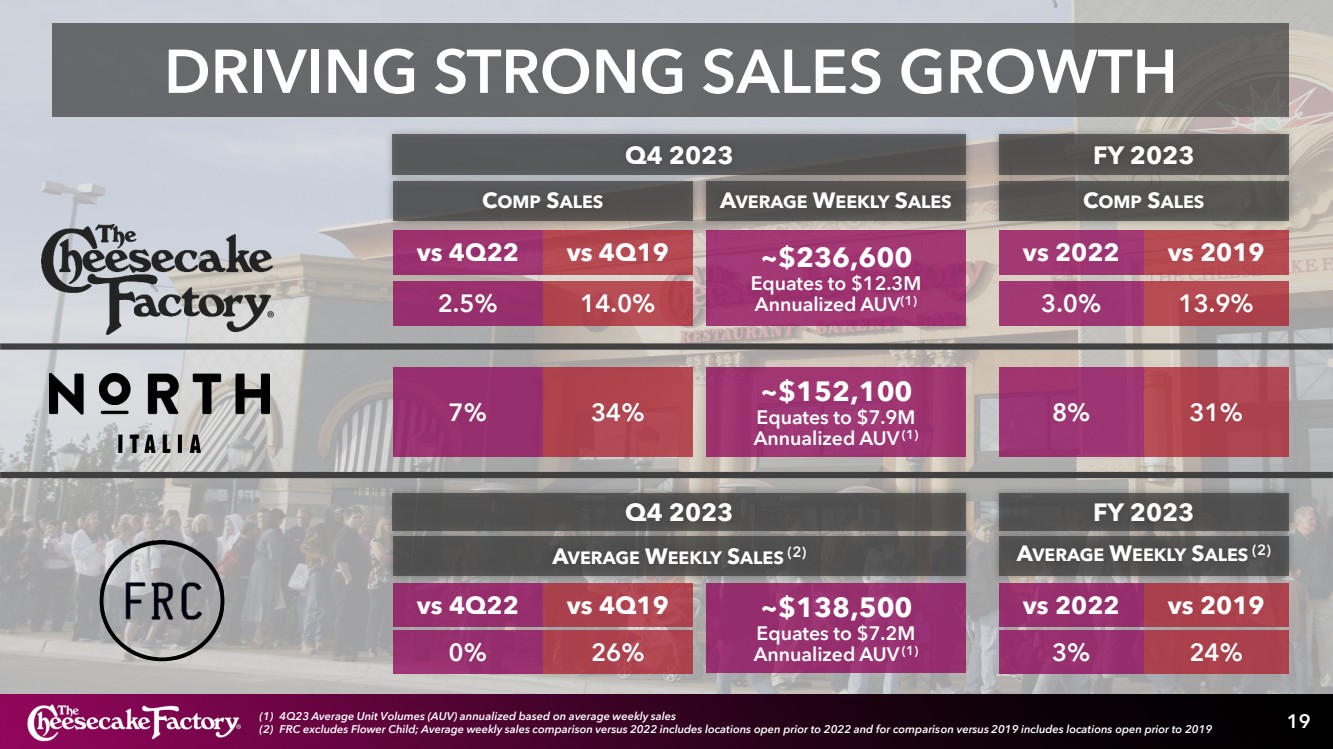
| 19
DRIVING STRONG SALES GROWTH
vs 2022 vs 2019
3% 24%
8% 31%
FY 2023
COMP SALES
3.0% 13.9%
vs 4Q22 vs 4Q19
0% 26%
~$236,600
Equates to $12.3M
Annualized AUV(1)
AVERAGE WEEKLY SALES
~$152,100
Equates to $7.9M
Annualized AUV(1)
~$138,500
Equates to $7.2M
Annualized AUV(1)
7% 34%
Q4 2023
COMP SALES
2.5% 14.0%
FY 2023
AVERAGE WEEKLY SALES (2) AVERAGE WEEKLY SALES (2)
Q4 2023
vs 4Q22 vs 4Q19 vs 2022 vs 2019
(1) 4Q23 Average Unit Volumes (AUV) annualized based on average weekly sales
(2) FRC excludes Flower Child; Average weekly sales comparison versus 2022 includes locations open prior to 2022 and for comparison versus 2019 includes locations open prior to 2019 |
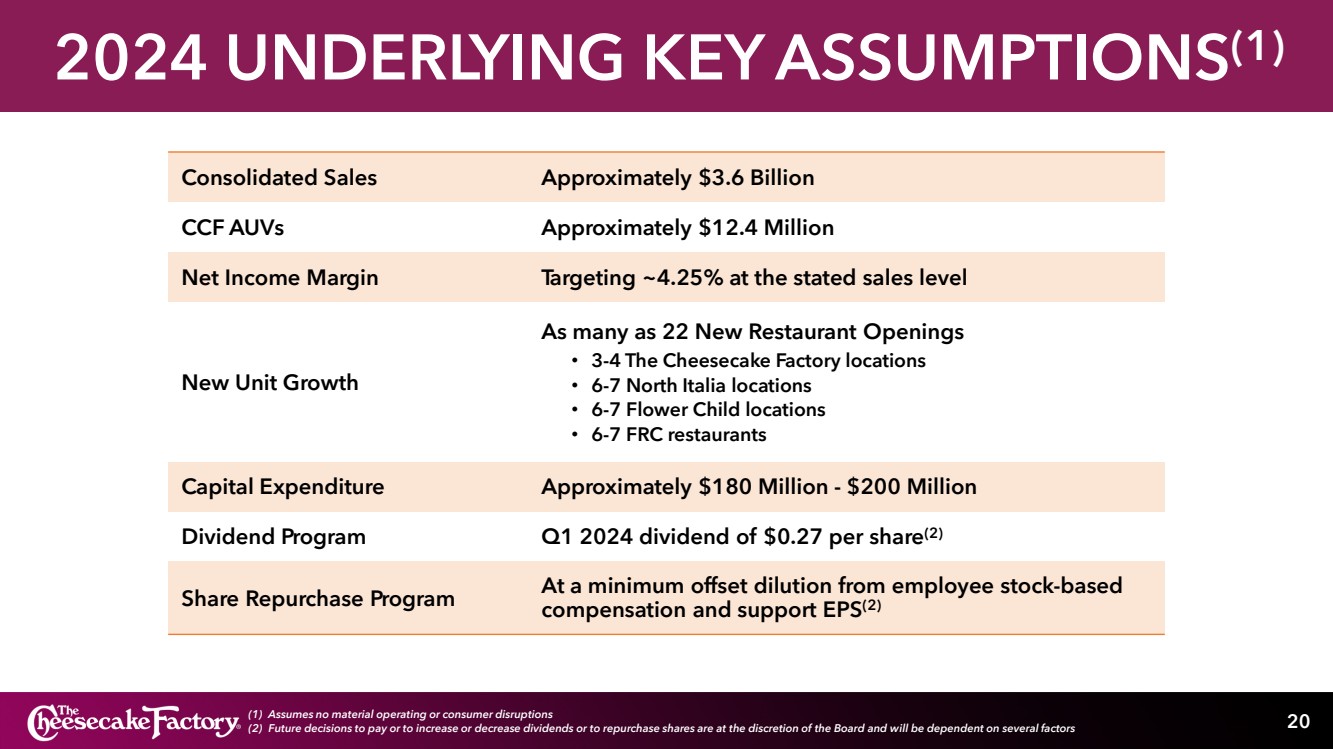
| 2024 UNDERLYING KEY ASSUMPTIONS(1)
20 (1) Assumes no material operating or consumer disruptions
(2) Future decisions to pay or to increase or decrease dividends or to repurchase shares are at the discretion of the Board and will be dependent on several factors
Consolidated Sales Approximately $3.6 Billion
CCF AUVs Approximately $12.4 Million
Net Income Margin Targeting ~4.25% at the stated sales level
New Unit Growth
As many as 22 New Restaurant Openings
• 3-4 The Cheesecake Factory locations
• 6-7 North Italia locations
• 6-7 Flower Child locations
• 6-7 FRC restaurants
Capital Expenditure Approximately $180 Million - $200 Million
Dividend Program Q1 2024 dividend of $0.27 per share(2)
Share Repurchase Program At a minimum offset dilution from employee stock-based
compensation and support EPS(2) |

| QUALITY GROWTH OPPORTUNITY
21
New Unit Growth Targets(1)
Size(2) Sales per Sq Ft(2) Annual Unit Growth
7,000 -10,000 ~$1,100 - $1,200 ~2% -3%
6,000 -7,000 ~$1,200 - $1,300 ~20%
3,000 -4,000 ~$1,100 - $1,200 ~15% -20%
3,500 -15,000 ~$1,100 ~10% -15%
Diversified Portfolio
Differentiated experiential concepts
diversified across industry segment, price
point, cuisine, occasion and real estate
Value Creation Opportunities
Leveraging brand power, operational
excellence, scale, supply chain and real
estate development expertise
1% - 2%
Comparable Sales Growth
LONG-TERM OUTLOOK
AVERAGE ANNUAL GROWTH TARGETS
7% - 8%
Top-line Revenue Growth
Attractive Growth Potential
Significant runway for future development
across portfolio of concepts to drive
accretive growth over time
(1) Illustrative example of new restaurant openings targeted size, sales per square foot, and annual unit growth; Targets represent steady-state and are typically reached after 3 years of operations
(2) Target size and sales per square foot are an average based on productive square feet defined as all interior square footage plus seasonally adjusted exterior patio square footage |
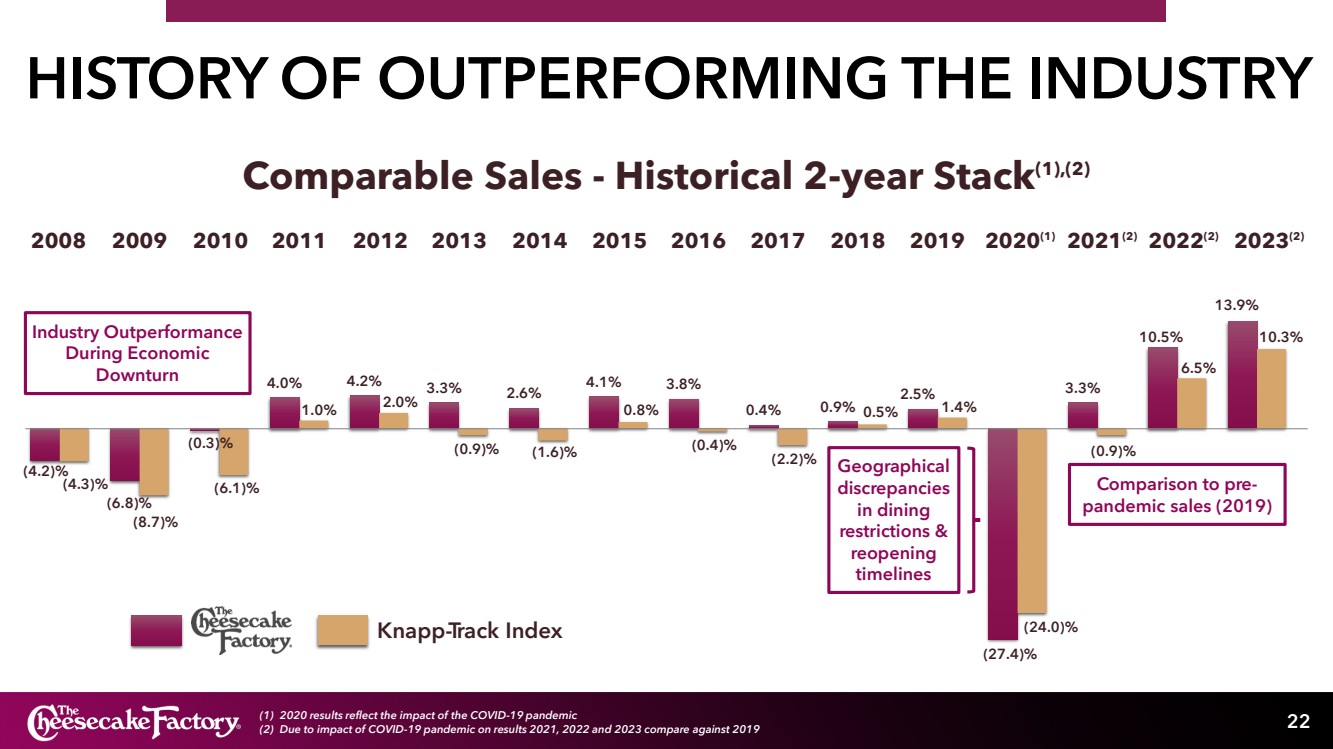
| HISTORY OF OUTPERFORMING THE INDUSTRY
(4.2)%
(6.8)%
(0.3)%
4.0% 4.2% 3.3% 2.6%
4.1% 3.8%
0.4% 0.9%
2.5%
(27.4)%
3.3%
10.5%
13.9%
(4.3)%
(8.7)%
(6.1)%
1.0% 2.0%
(0.9)% (1.6)%
0.8%
(0.4)%
(2.2)%
0.5% 1.4%
(24.0)%
(0.9)%
6.5%
10.3%
2008
Knapp-Track Index
Comparable Sales - Historical 2-year Stack(1),(2)
Industry Outperformance
During Economic
Downturn
Geographical
discrepancies
in dining
restrictions &
reopening
timelines
22
2009 2010 2011 2012 2013 2014 2015 2016 2017 2018 2019 2020(1) 2021(2) 2022(2) 2023(2)
Comparison to pre-pandemic sales (2019)
(1) 2020 results reflect the impact of the COVID-19 pandemic
(2) Due to impact of COVID-19 pandemic on results 2021, 2022 and 2023 compare against 2019 |
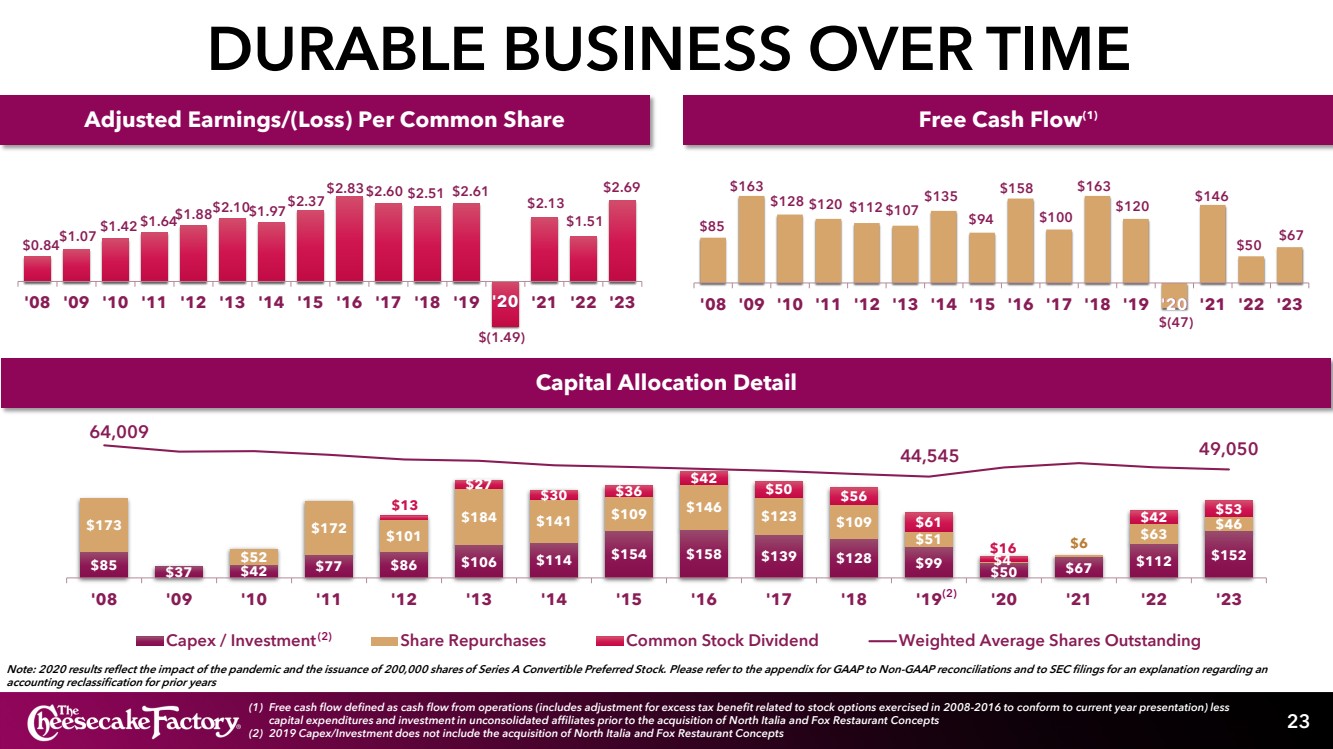
| DURABLE BUSINESS OVER TIME
23
Note: 2020 results reflect the impact of the pandemic and the issuance of 200,000 shares of Series A Convertible Preferred Stock. Please refer to the appendix for GAAP to Non-GAAP reconciliations and to SEC filings for an explanation regarding an
accounting reclassification for prior years
$0.84 $1.07 $1.42 $1.64 $1.88 $2.10 $1.97 $2.37
$2.83 $2.60 $2.51 $2.61
$(1.49)
$2.13
$1.51
$2.69
'08 '09 '10 '11 '12 '13 '14 '15 '16 '17 '18 '19 '20 '21 '22 '23
Capital Allocation Detail
$85
$163
$128 $120 $112 $107
$135
$94
$158
$100
$163
$120
$(47)
$146
$50 $67
'08 '09 '10 '11 '12 '13 '14 '15 '16 '17 '18 '19 '20 '21 '22 '23
$85 $37 $42 $77 $86 $106 $114 $154 $158 $139 $128 $99 $50 $67 $112 $152
$173
$52
$172 $101
$184 $141 $109 $146 $123 $109
$51
$4
$6 $63 $46
$13
$27 $30 $36
$42
$50 $56
$61
$16
$42 $53
64,009
44,545 49,050
'08 '09 '10 '11 '12 '13 '14 '15 '16 '17 '18 '19 '20 '21 '22 '23
Capex / Investment Share Repurchases Common Stock Dividend Weighted Average Shares Outstanding
Free Cash Flow(1) Adjusted Earnings/(Loss) Per Common Share
'20 '20
(1) Free cash flow defined as cash flow from operations (includes adjustment for excess tax benefit related to stock options exercised in 2008-2016 to conform to current year presentation) less
capital expenditures and investment in unconsolidated affiliates prior to the acquisition of North Italia and Fox Restaurant Concepts
(2) 2019 Capex/Investment does not include the acquisition of North Italia and Fox Restaurant Concepts
(2)
(2) |

| APPENDIX |
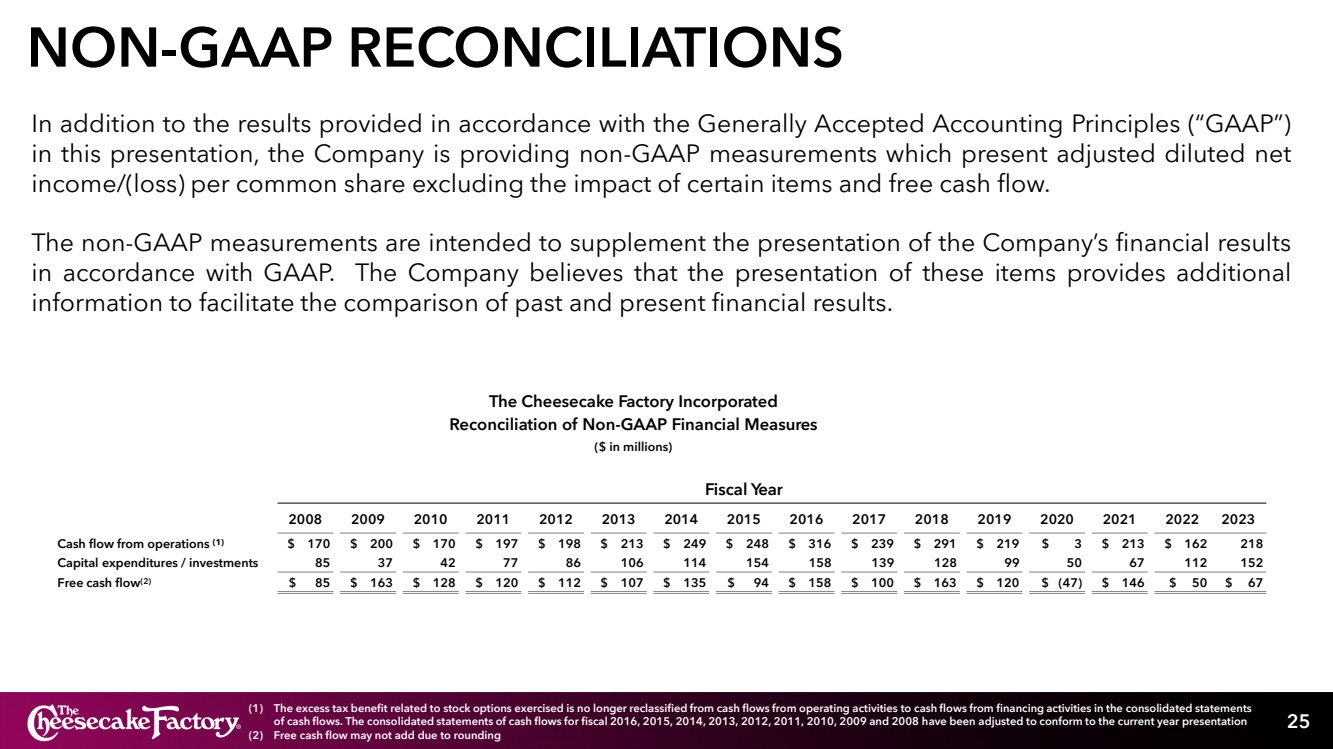
| NON-GAAP RECONCILIATIONS
25
In addition to the results provided in accordance with the Generally Accepted Accounting Principles (“GAAP”)
in this presentation, the Company is providing non-GAAP measurements which present adjusted diluted net
income/(loss) per common share excluding the impact of certain items and free cash flow.
The non-GAAP measurements are intended to supplement the presentation of the Company’s financial results
in accordance with GAAP. The Company believes that the presentation of these items provides additional
information to facilitate the comparison of past and present financial results.
(1) The excess tax benefit related to stock options exercised is no longer reclassified from cash flows from operating activities to cash flows from financing activities in the consolidated statements
of cash flows. The consolidated statements of cash flows for fiscal 2016, 2015, 2014, 2013, 2012, 2011, 2010, 2009 and 2008 have been adjusted to conform to the current year presentation
(2) Free cash flow may not add due to rounding
The Cheesecake Factory Incorporated
Reconciliation of Non-GAAP Financial Measures
($ in millions)
Fiscal Year
2008 2009 2010 2011 2012 2013 2014 2015 2016 2017 2018 2019 2020 2021 2022 2023
Cash flow from operations (1) $ 170 $ 200 $ 170 $ 197 $ 198 $ 213 $ 249 $ 248 $ 316 $ 239 $ 291 $ 219 $ 3 $ 213 $ 162 218
Capital expenditures / investments 85 37 42 77 86 106 114 154 158 139 128 99 50 67 112 152
Free cash flow(2) $ 85 $ 163 $ 128 $ 120 $ 112 $ 107 $ 135 $ 94 $ 158 $ 100 $ 163 $ 120 $ (47) $ 146 $ 50 $ 67 |
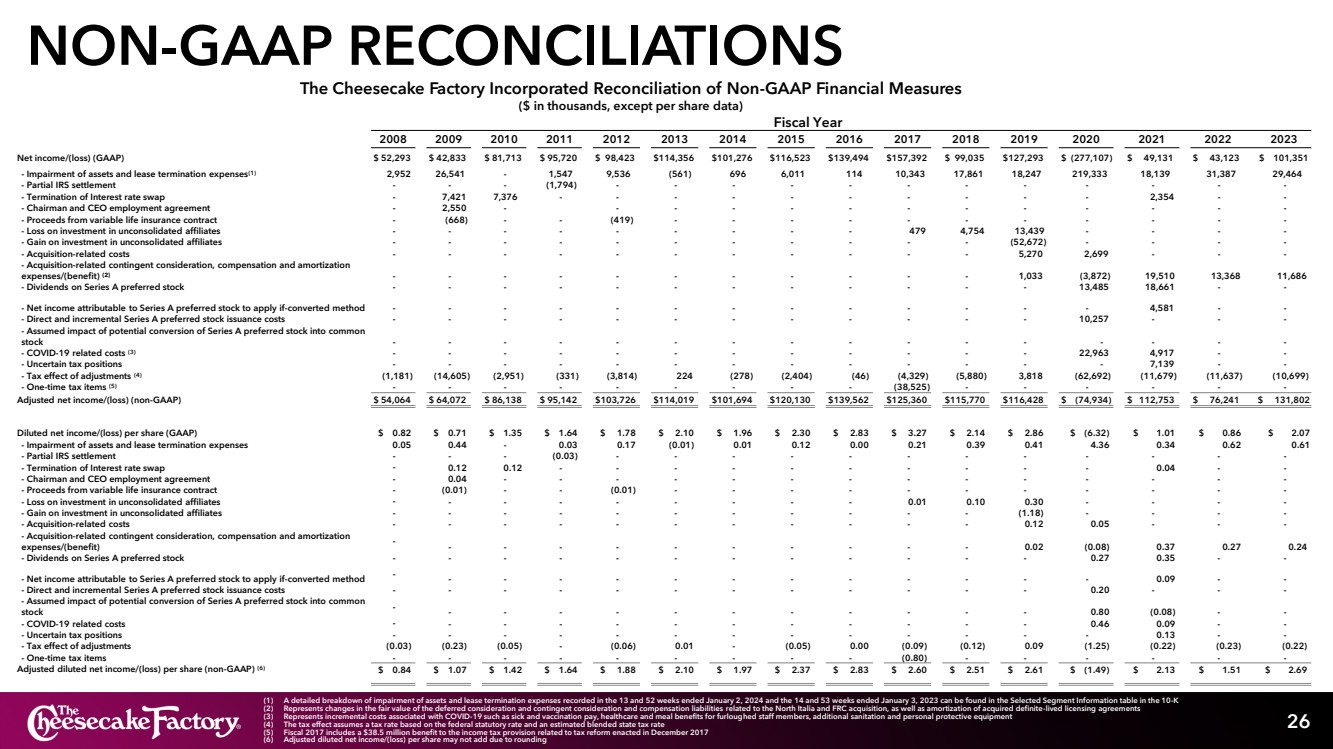
| NON-GAAP RECONCILIATIONS
26
The Cheesecake Factory Incorporated Reconciliation of Non-GAAP Financial Measures
($ in thousands, except per share data)
Fiscal Year
2008 2009 2010 2011 2012 2013 2014 2015 2016 2017 2018 2019 2020 2021 2022 2023
Net income/(loss) (GAAP) $ 52,293 $ 42,833 $ 81,713 $ 95,720 $ 98,423 $114,356 $101,276 $116,523 $139,494 $157,392 $ 99,035 $127,293 $ (277,107) $ 49,131 $ 43,123 $ 101,351
- Impairment of assets and lease termination expenses(1) 2,952 26,541 - 1,547 9,536 (561) 696 6,011 114 10,343 17,861 18,247 219,333 18,139 31,387 29,464
- Partial IRS settlement - - - (1,794) - - - - - - - - - - - -
- Termination of Interest rate swap - 7,421 7,376 - - - - - - - - - - 2,354 - -
- Chairman and CEO employment agreement - 2,550 - - - - - - - - - - - - -
- Proceeds from variable life insurance contract - (668) - - (419) - - - - - - - - - - -
- Loss on investment in unconsolidated affiliates - - - - - - - - - 479 4,754 13,439 - - - -
- Gain on investment in unconsolidated affiliates - - - - - - - - - - - (52,672) - - - -
- Acquisition-related costs - - - - - - - - - - - 5,270 2,699 - - -
- Acquisition-related contingent consideration, compensation and amortization
expenses/(benefit) (2) - - - - - - - - - - - 1,033 (3,872) 19,510 13,368 11,686
- Dividends on Series A preferred stock - - - - - - - - - - - - 13,485 18,661 - -
- Net income attributable to Series A preferred stock to apply if-converted method - - - - - - - - - - - - - 4,581 - -
- Direct and incremental Series A preferred stock issuance costs - - - - - - - - - - - - 10,257 - - -
- Assumed impact of potential conversion of Series A preferred stock into common
stock - - - - - - - - - - - - - - - -
- COVID-19 related costs (3) - - - - - - - - - - - - 22,963 4,917 - -
- Uncertain tax positions - - - - - - - - - - - - - 7,139 - -
- Tax effect of adjustments (4) (1,181) (14,605) (2,951) (331) (3,814) 224 (278) (2,404) (46) (4,329) (5,880) 3,818 (62,692) (11,679) (11,637) (10,699)
- One-time tax items (5) - - - - - - - - - (38,525) - - - - - -
Adjusted net income/(loss) (non-GAAP) $ 54,064 $ 64,072 $ 86,138 $ 95,142 $103,726 $114,019 $101,694 $120,130 $139,562 $125,360 $115,770 $116,428 $ (74,934) $ 112,753 $ 76,241 $ 131,802
Diluted net income/(loss) per share (GAAP) $ 0.82 $ 0.71 $ 1.35 $ 1.64 $ 1.78 $ 2.10 $ 1.96 $ 2.30 $ 2.83 $ 3.27 $ 2.14 $ 2.86 $ (6.32) $ 1.01 $ 0.86 $ 2.07
- Impairment of assets and lease termination expenses 0.05 0.44 - 0.03 0.17 (0.01) 0.01 0.12 0.00 0.21 0.39 0.41 4.36 0.34 0.62 0.61
- Partial IRS settlement - - - (0.03) - - - - - - - - - - - -
- Termination of Interest rate swap - 0.12 0.12 - - - - - - - - - - 0.04 - -
- Chairman and CEO employment agreement - 0.04 - - - - - - - - - - - - - -
- Proceeds from variable life insurance contract - (0.01) - - (0.01) - - - - - - - - - - -
- Loss on investment in unconsolidated affiliates - - - - - - - - - 0.01 0.10 0.30 - - - -
- Gain on investment in unconsolidated affiliates - - - - - - - - - - - (1.18) - - - -
- Acquisition-related costs - - - - - - - - - - - 0.12 0.05 - - -
- Acquisition-related contingent consideration, compensation and amortization
expenses/(benefit) -
- - - - - - - - - - 0.02 (0.08) 0.37 0.27 0.24
- Dividends on Series A preferred stock - - - - - - - - - - - - 0.27 0.35 - -
- Net income attributable to Series A preferred stock to apply if-converted method -
- - - - - - - - - - - - 0.09 - -
- Direct and incremental Series A preferred stock issuance costs - - - - - - - - - - - - 0.20 - - -
- Assumed impact of potential conversion of Series A preferred stock into common
stock -
- - - - - - - - - - - 0.80 (0.08) - -
- COVID-19 related costs - - - - - - - - - - - - 0.46 0.09 - -
- Uncertain tax positions - - - - - - - - - - - - - 0.13 - -
- Tax effect of adjustments (0.03) (0.23) (0.05) - (0.06) 0.01 - (0.05) 0.00 (0.09) (0.12) 0.09 (1.25) (0.22) (0.23) (0.22)
- One-time tax items - - - - - - - - - (0.80) - - - - - -
Adjusted diluted net income/(loss) per share (non-GAAP) (6) $ 0.84 $ 1.07 $ 1.42 $ 1.64 $ 1.88 $ 2.10 $ 1.97 $ 2.37 $ 2.83 $ 2.60 $ 2.51 $ 2.61 $ (1.49) $ 2.13 $ 1.51 $ 2.69
(1) A detailed breakdown of impairment of assets and lease termination expenses recorded in the 13 and 52 weeks ended January 2, 2024 and the 14 and 53 weeks ended January 3, 2023 can be found in the Selected Segment Information table in the 10-K
(2) Represents changes in the fair value of the deferred consideration and contingent consideration and compensation liabilities related to the North Italia and FRC acquisition, as well as amortization of acquired definite-lived licensing agreements
(3) Represents incremental costs associated with COVID-19 such as sick and vaccination pay, healthcare and meal benefits for furloughed staff members, additional sanitation and personal protective equipment
(4) The tax effect assumes a tax rate based on the federal statutory rate and an estimated blended state tax rate
(5) Fiscal 2017 includes a $38.5 million benefit to the income tax provision related to tax reform enacted in December 2017
(6) Adjusted diluted net income/(loss) per share may not add due to rounding |
| X |
- DefinitionBoolean flag that is true when the XBRL content amends previously-filed or accepted submission.
| Name: |
dei_AmendmentFlag |
| Namespace Prefix: |
dei_ |
| Data Type: |
xbrli:booleanItemType |
| Balance Type: |
na |
| Period Type: |
duration |
|
| X |
- DefinitionFor the EDGAR submission types of Form 8-K: the date of the report, the date of the earliest event reported; for the EDGAR submission types of Form N-1A: the filing date; for all other submission types: the end of the reporting or transition period. The format of the date is YYYY-MM-DD.
| Name: |
dei_DocumentPeriodEndDate |
| Namespace Prefix: |
dei_ |
| Data Type: |
xbrli:dateItemType |
| Balance Type: |
na |
| Period Type: |
duration |
|
| X |
- DefinitionThe type of document being provided (such as 10-K, 10-Q, 485BPOS, etc). The document type is limited to the same value as the supporting SEC submission type, or the word 'Other'.
| Name: |
dei_DocumentType |
| Namespace Prefix: |
dei_ |
| Data Type: |
dei:submissionTypeItemType |
| Balance Type: |
na |
| Period Type: |
duration |
|
| X |
- DefinitionAddress Line 1 such as Attn, Building Name, Street Name
| Name: |
dei_EntityAddressAddressLine1 |
| Namespace Prefix: |
dei_ |
| Data Type: |
xbrli:normalizedStringItemType |
| Balance Type: |
na |
| Period Type: |
duration |
|
| X |
- Definition
+ References
+ Details
| Name: |
dei_EntityAddressCityOrTown |
| Namespace Prefix: |
dei_ |
| Data Type: |
xbrli:normalizedStringItemType |
| Balance Type: |
na |
| Period Type: |
duration |
|
| X |
- DefinitionCode for the postal or zip code
| Name: |
dei_EntityAddressPostalZipCode |
| Namespace Prefix: |
dei_ |
| Data Type: |
xbrli:normalizedStringItemType |
| Balance Type: |
na |
| Period Type: |
duration |
|
| X |
- DefinitionName of the state or province.
| Name: |
dei_EntityAddressStateOrProvince |
| Namespace Prefix: |
dei_ |
| Data Type: |
dei:stateOrProvinceItemType |
| Balance Type: |
na |
| Period Type: |
duration |
|
| X |
- DefinitionA unique 10-digit SEC-issued value to identify entities that have filed disclosures with the SEC. It is commonly abbreviated as CIK. Reference 1: http://www.xbrl.org/2003/role/presentationRef
-Publisher SEC
-Name Exchange Act
-Number 240
-Section 12
-Subsection b-2
| Name: |
dei_EntityCentralIndexKey |
| Namespace Prefix: |
dei_ |
| Data Type: |
dei:centralIndexKeyItemType |
| Balance Type: |
na |
| Period Type: |
duration |
|
| X |
- DefinitionIndicate if registrant meets the emerging growth company criteria. Reference 1: http://www.xbrl.org/2003/role/presentationRef
-Publisher SEC
-Name Exchange Act
-Number 240
-Section 12
-Subsection b-2
| Name: |
dei_EntityEmergingGrowthCompany |
| Namespace Prefix: |
dei_ |
| Data Type: |
xbrli:booleanItemType |
| Balance Type: |
na |
| Period Type: |
duration |
|
| X |
- DefinitionCommission file number. The field allows up to 17 characters. The prefix may contain 1-3 digits, the sequence number may contain 1-8 digits, the optional suffix may contain 1-4 characters, and the fields are separated with a hyphen.
| Name: |
dei_EntityFileNumber |
| Namespace Prefix: |
dei_ |
| Data Type: |
dei:fileNumberItemType |
| Balance Type: |
na |
| Period Type: |
duration |
|
| X |
- DefinitionTwo-character EDGAR code representing the state or country of incorporation.
| Name: |
dei_EntityIncorporationStateCountryCode |
| Namespace Prefix: |
dei_ |
| Data Type: |
dei:edgarStateCountryItemType |
| Balance Type: |
na |
| Period Type: |
duration |
|
| X |
- DefinitionThe exact name of the entity filing the report as specified in its charter, which is required by forms filed with the SEC. Reference 1: http://www.xbrl.org/2003/role/presentationRef
-Publisher SEC
-Name Exchange Act
-Number 240
-Section 12
-Subsection b-2
| Name: |
dei_EntityRegistrantName |
| Namespace Prefix: |
dei_ |
| Data Type: |
xbrli:normalizedStringItemType |
| Balance Type: |
na |
| Period Type: |
duration |
|
| X |
- DefinitionThe Tax Identification Number (TIN), also known as an Employer Identification Number (EIN), is a unique 9-digit value assigned by the IRS. Reference 1: http://www.xbrl.org/2003/role/presentationRef
-Publisher SEC
-Name Exchange Act
-Number 240
-Section 12
-Subsection b-2
| Name: |
dei_EntityTaxIdentificationNumber |
| Namespace Prefix: |
dei_ |
| Data Type: |
dei:employerIdItemType |
| Balance Type: |
na |
| Period Type: |
duration |
|
| X |
- DefinitionLocal phone number for entity.
| Name: |
dei_LocalPhoneNumber |
| Namespace Prefix: |
dei_ |
| Data Type: |
xbrli:normalizedStringItemType |
| Balance Type: |
na |
| Period Type: |
duration |
|
| X |
- DefinitionBoolean flag that is true when the Form 8-K filing is intended to satisfy the filing obligation of the registrant as pre-commencement communications pursuant to Rule 13e-4(c) under the Exchange Act. Reference 1: http://www.xbrl.org/2003/role/presentationRef
-Publisher SEC
-Name Exchange Act
-Number 240
-Section 13e
-Subsection 4c
| Name: |
dei_PreCommencementIssuerTenderOffer |
| Namespace Prefix: |
dei_ |
| Data Type: |
xbrli:booleanItemType |
| Balance Type: |
na |
| Period Type: |
duration |
|
| X |
- DefinitionBoolean flag that is true when the Form 8-K filing is intended to satisfy the filing obligation of the registrant as pre-commencement communications pursuant to Rule 14d-2(b) under the Exchange Act. Reference 1: http://www.xbrl.org/2003/role/presentationRef
-Publisher SEC
-Name Exchange Act
-Number 240
-Section 14d
-Subsection 2b
| Name: |
dei_PreCommencementTenderOffer |
| Namespace Prefix: |
dei_ |
| Data Type: |
xbrli:booleanItemType |
| Balance Type: |
na |
| Period Type: |
duration |
|
| X |
- DefinitionTitle of a 12(b) registered security. Reference 1: http://www.xbrl.org/2003/role/presentationRef
-Publisher SEC
-Name Exchange Act
-Number 240
-Section 12
-Subsection b
| Name: |
dei_Security12bTitle |
| Namespace Prefix: |
dei_ |
| Data Type: |
dei:securityTitleItemType |
| Balance Type: |
na |
| Period Type: |
duration |
|
| X |
- DefinitionName of the Exchange on which a security is registered. Reference 1: http://www.xbrl.org/2003/role/presentationRef
-Publisher SEC
-Name Exchange Act
-Number 240
-Section 12
-Subsection d1-1
| Name: |
dei_SecurityExchangeName |
| Namespace Prefix: |
dei_ |
| Data Type: |
dei:edgarExchangeCodeItemType |
| Balance Type: |
na |
| Period Type: |
duration |
|
| X |
- DefinitionBoolean flag that is true when the Form 8-K filing is intended to satisfy the filing obligation of the registrant as soliciting material pursuant to Rule 14a-12 under the Exchange Act. Reference 1: http://www.xbrl.org/2003/role/presentationRef
-Publisher SEC
-Name Exchange Act
-Section 14a
-Number 240
-Subsection 12
| Name: |
dei_SolicitingMaterial |
| Namespace Prefix: |
dei_ |
| Data Type: |
xbrli:booleanItemType |
| Balance Type: |
na |
| Period Type: |
duration |
|
| X |
- DefinitionTrading symbol of an instrument as listed on an exchange.
| Name: |
dei_TradingSymbol |
| Namespace Prefix: |
dei_ |
| Data Type: |
dei:tradingSymbolItemType |
| Balance Type: |
na |
| Period Type: |
duration |
|
| X |
- DefinitionBoolean flag that is true when the Form 8-K filing is intended to satisfy the filing obligation of the registrant as written communications pursuant to Rule 425 under the Securities Act. Reference 1: http://www.xbrl.org/2003/role/presentationRef
-Publisher SEC
-Name Securities Act
-Number 230
-Section 425
| Name: |
dei_WrittenCommunications |
| Namespace Prefix: |
dei_ |
| Data Type: |
xbrli:booleanItemType |
| Balance Type: |
na |
| Period Type: |
duration |
|
Grafico Azioni Cheesecake Factory (NASDAQ:CAKE)
Storico
Da Feb 2025 a Mar 2025

Grafico Azioni Cheesecake Factory (NASDAQ:CAKE)
Storico
Da Mar 2024 a Mar 2025

