Form 8-K - Current report
02 Agosto 2023 - 10:37PM
Edgar (US Regulatory)
0001568162
false
true
0001568162
2023-08-02
2023-08-02
0001568162
us-gaap:CommonStockMember
2023-08-02
2023-08-02
0001568162
us-gaap:SeriesAPreferredStockMember
2023-08-02
2023-08-02
0001568162
us-gaap:SeriesCPreferredStockMember
2023-08-02
2023-08-02
0001568162
RTL:PreferredStockPurchaseRightsMember
2023-08-02
2023-08-02
iso4217:USD
xbrli:shares
iso4217:USD
xbrli:shares
UNITED STATES
SECURITIES AND EXCHANGE COMMISSION
WASHINGTON, D.C. 20549
FORM 8-K
CURRENT REPORT
PURSUANT TO SECTION 13 OR 15(d) OF THE
SECURITIES EXCHANGE ACT OF 1934
Date of Report (Date of earliest event reported):
August 2, 2023
The Necessity Retail REIT, Inc.
(Exact Name of Registrant as Specified in
its Charter)
| Maryland |
|
001-38597 |
|
90-0929989 |
|
(State or other jurisdiction
of incorporation) |
|
(Commission File Number) |
|
(I.R.S. Employer
Identification No.) |
650 Fifth Avenue, 30th Floor
New York, New York |
10019 |
| (Address of Principal Executive Offices) |
(zip code) |
Registrant’s telephone number,
including area code: (212) 415-6500
Former name or former address, if changed since last report: Not Applicable
Check the appropriate box below if the
Form 8-K filing is intended to simultaneously satisfy the filing obligation of the registrant under any of the following provisions:
| ¨ |
Written communications pursuant to Rule 425 under the Securities Act (17 CFR 230.425) |
| |
|
| ¨ |
Soliciting material pursuant to Rule 14a-12 under the Exchange Act (17 CFR 240.14a-12) |
| |
|
| ¨ |
Pre-commencement communications pursuant to Rule 14d-2(b) under the Exchange Act (17 CFR 240.14d-2(b)) |
| |
|
| ¨ |
Pre-commencement communications pursuant to Rule 13e-4(c) under the Exchange Act (17 CFR 240.13e-4(c)) |
Securities registered pursuant to section 12(b) of the Act:
| Title of each class |
|
Trading
Symbol(s) |
|
Name of each exchange on
which registered |
| Class
A Common Stock, $0.01 par value per share |
|
RTL |
|
The Nasdaq Global Select Market |
| 7.50% Series A Cumulative Redeemable
Perpetual Preferred Stock, $0.01 par value per share |
|
RTLPP |
|
The Nasdaq Global Select Market |
| 7.375% Series C Cumulative Redeemable Perpetual Preferred Stock, $0.01 par value per share |
|
RTLPO |
|
The Nasdaq Global Select Market |
| Preferred Stock Purchase Rights |
|
|
|
The Nasdaq Global Select Market |
Indicate by check mark whether the registrant
is an emerging growth company as defined in Rule 405 of the Securities Act of 1933 (§230.405 of this chapter) or Rule 12b-2
of the Securities Exchange Act of 1934 (§240.12b-2 of this chapter).
Emerging growth company ¨
If an emerging growth company, indicate
by check mark if the registrant has elected not to use the extended transition period for complying with any new or revised financial
accounting standards provided pursuant to Section 13(a) of the Exchange Act. ¨
Item 7.01. Regulation FD Disclosure.
Investor Presentation
On August 2, 2023, The Necessity Retail REIT,
Inc. (the “Company”) prepared an investor presentation that officers and other representatives of the Company intend to present
at conferences and meetings. A copy of the investor presentation is furnished as Exhibit 99.1 of this Current Report on Form 8-K. The
information set forth in Item 7.01 of this Current Report on Form 8-K and in the attached Exhibit 99.1 is deemed to be “furnished”
and shall not be deemed to be “filed” for purposes of Section 18 of the Securities Exchange Act of 1934, as amended (the “Exchange
Act”), or otherwise subject to the liabilities of that Section. The information set forth in Item 7.01 of this Current Report on
Form 8-K, including Exhibit 99.1, shall not be deemed incorporated by reference into any filing under the Exchange Act or the Securities
Act of 1933, as amended, regardless of any general incorporation language in such filing.
The statements in this Current Report on Form
8-K that are not historical facts may be forward-looking statements. These forward-looking statements involve risks and uncertainties
that could cause actual results or events to be materially different. In addition, words such as “may,” “will,”
“seeks,” “anticipates,” “believes,” “estimates,” expects,” “plans,”
“intends,” “would,” or similar expressions indicate a forward-looking statement, although not all forward-looking
statements contain these identifying words. Any statements referring to the future value of an investment in the Company, including the
adjustments giving effect to the Company merging with and into Osmosis Sub I, LLC, with Osmosis Sub I continuing as the surviving entity
and wholly-owned subsidiary of GNL (the “REIT Merger”) and GNL and the Company becoming internally managed (the “Internalization
Merger”) as described in this communication, as well as the potential success that the Company may have in executing the REIT Merger
and Internalization Merger, are also forward-looking statements. There are a number of risks, uncertainties and other important factors
that could cause the Company’s actual or anticipated results to differ materially from those contemplated by such forward-looking
statements, including but not limited to: (i) the Company’s ability to complete the REIT Merger and the Internalization Merger on
the proposed terms or on the anticipated timeline, or at all, including risks and uncertainties related to securing the necessary stockholder
approvals and satisfaction of other closing conditions to consummate the proposed transactions, (ii) the occurrence of any event, change
or other circumstance that could give rise to the termination of the Internalization Merger Agreement and REIT Merger Agreement, each
dated as of May 23, 2023 relating to the proposed transactions, (iii) the Company’s ability to obtain consents of applicable counterparties
to certain of its lending agreements identified in the REIT Merger Agreement, (iv) failure to realize the expected benefits of the REIT
Merger and the Internalization Merger, (v) significant transaction costs or unknown or inestimable liabilities, (vi) risks related to
diverting the attention of the Company’s management from ongoing business operations, (vii) the risk of shareholder litigation in
connection with the proposed transaction, including resulting expense or delay, (viii) the risk that the Company’s business will
not be integrated successfully or that such integration may be more difficult, time-consuming or costly than expected; (ix) risks related
to the market value of the GNL’s common stock to be issued in the proposed transactions; (x) potential adverse effects of the ongoing
global COVID-19 pandemic, including actions taken to contain or treat COVID-19, on the Company, the Company’s tenants and the global
economy and financial market, (x) the risk that one or more parties to the REIT Merger Agreement may not fulfil its obligations under
the agreement, as well as the additional risks, uncertainties and other important factors set forth in the “Risk Factors”
and “Management’s Discussion and Analysis of Financial Condition and Results of Operations” sections of the Company’s
Annual Report on Form 10-K for the year ended December 31, 2022 filed with the SEC on February 23, 2023, and all other filings with the
SEC after that date, including, but not limited to, the Company’s quarterly report on Form 10-Q as of and for the quarter ended
June 30, 2023, as such risks, uncertainties and other important factors may be updated from time to time in the Company’s subsequent
reports. Further, forward-looking statements speak only as of the date they are made, and Company undertakes no obligation to update or
revise forward-looking statements to reflect changed assumptions, the occurrence of unanticipated events or changes to future operating
results over time, except as required by law.
Item 9.01. Financial Statements and Exhibits.
(d) Exhibits
Exhibit
No. |
|
Description |
| 99.1 |
|
Investor Presentation |
| |
|
|
| 104 |
|
Cover Page Interactive Data File - the cover page XBRL tags are embedded within the Inline XBRL Document. |
SIGNATURES
Pursuant to the requirements
of the Securities Exchange Act of 1934, as amended, the registrant has duly caused this report to be signed on its behalf by the undersigned
thereunto duly authorized.
| THE NECESSITY RETAIL REIT, INC. |
|
| |
|
|
| By: |
/s/ Edward M. Weil, Jr. |
|
| |
Edward M. Weil, Jr. |
|
| |
Chief Executive Officer and President
(Principal Executive Officer) |
|
Dated: August 2, 2023
Exhibit
99.1
| The Necessity Retail REIT
Second Quarter 2023 Investor Presentation
August 2023 |
| The Necessity Retail REIT 1
® Where America Shops | www.necessityretailreit.com
Merger and Internalization Update
1. For more information, refer to the Registration Statement on Form S-4 that GNL filed with the Securities and Exchange Commission (“SEC”) on July 6, 2023, as amended on July 17, 2023.
2. Market data as of announcement on May 23, 2023.
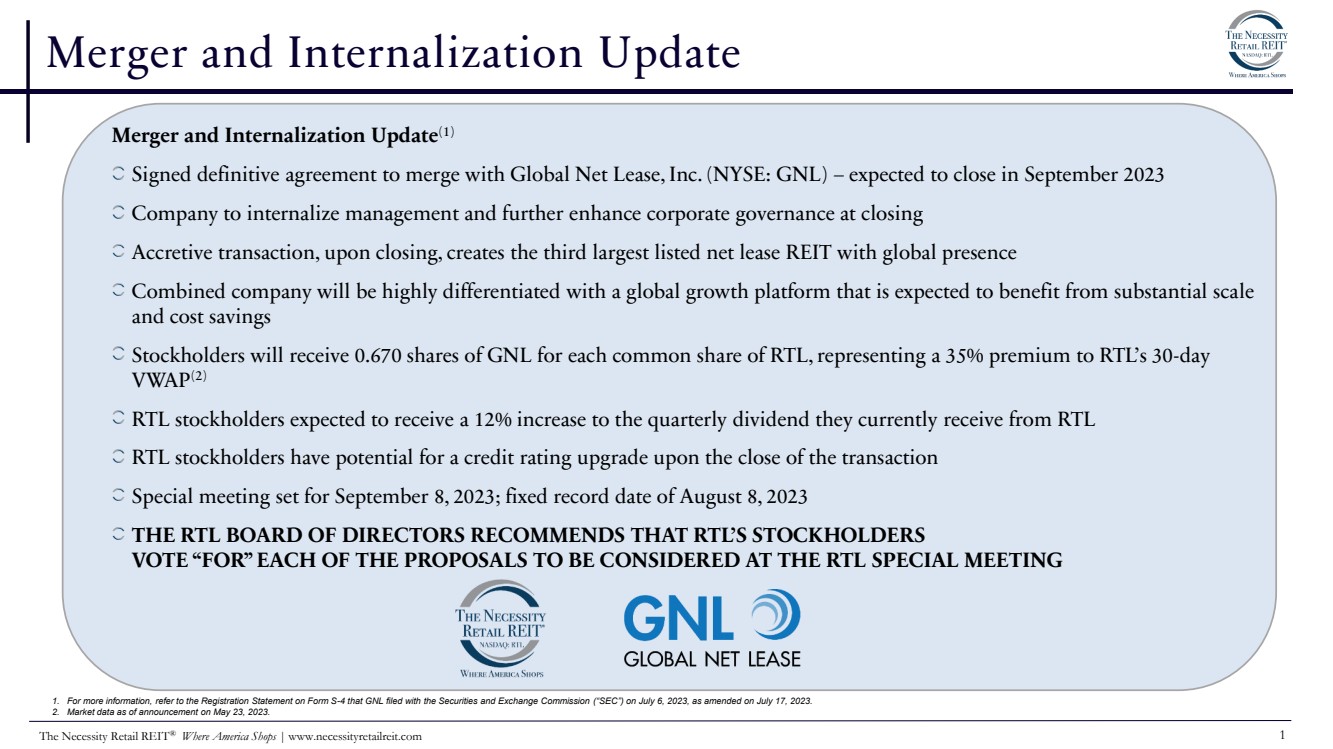
Merger and Internalization Update(1)
Signed definitive agreement to merge with Global Net Lease, Inc. (NYSE: GNL) – expected to close in September 2023
Company to internalize management and further enhance corporate governance at closing
Accretive transaction, upon closing, creates the third largest listed net lease REIT with global presence
Combined company will be highly differentiated with a global growth platform that is expected to benefit from substantial scale
and cost savings
Stockholders will receive 0.670 shares of GNL for each common share of RTL, representing a 35% premium to RTL’s 30-day
VWAP(2)
RTL stockholders expected to receive a 12% increase to the quarterly dividend they currently receive from RTL
RTL stockholders have potential for a credit rating upgrade upon the close of the transaction
Special meeting set for September 8, 2023; fixed record date of August 8, 2023
THE RTL BOARD OF DIRECTORS RECOMMENDS THAT RTL’S STOCKHOLDERS
VOTE “FOR” EACH OF THE PROPOSALS TO BE CONSIDERED AT THE RTL SPECIAL MEETING |
| The Necessity Retail REIT 2
® Where America Shops | www.necessityretailreit.com
Second Quarter 2023 Overview
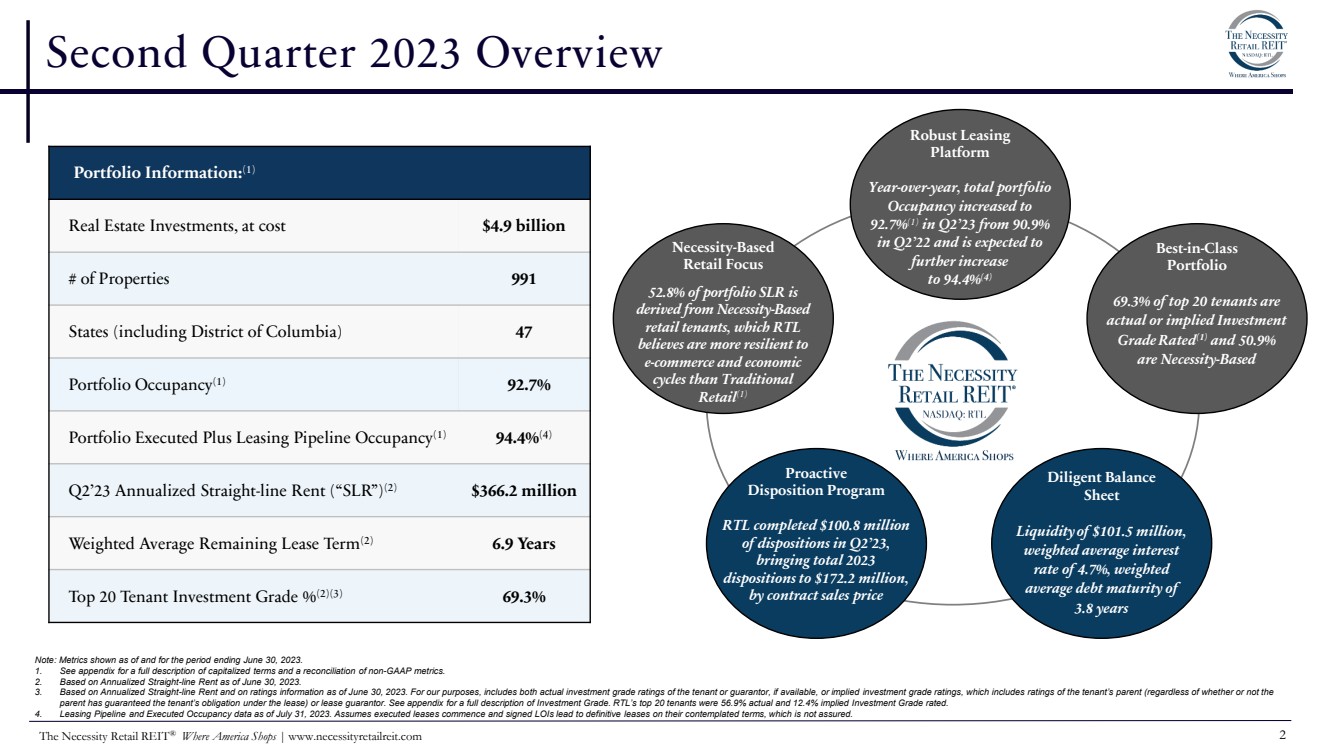
Portfolio Information:(1)
Real Estate Investments, at cost $4.9 billion
# of Properties 991
States (including District of Columbia) 47
Portfolio Occupancy(1) 92.7%
Portfolio Executed Plus Leasing Pipeline Occupancy(1) 94.4%(4)
Q2’23 Annualized Straight-line Rent (“SLR”)(2) $366.2 million
Weighted Average Remaining Lease Term(2) 6.9 Years
Top 20 Tenant Investment Grade %(2)(3) 69.3%
Note: Metrics shown as of and for the period ending June 30, 2023.
1. See appendix for a full description of capitalized terms and a reconciliation of non-GAAP metrics.
2. Based on Annualized Straight-line Rent as of June 30, 2023.
3. Based on Annualized Straight-line Rent and on ratings information as of June 30, 2023. For our purposes, includes both actual investment grade ratings of the tenant or guarantor, if available, or implied investment grade ratings, which includes ratings of the tenant’s parent (regardless of whether or not the
parent has guaranteed the tenant’s obligation under the lease) or lease guarantor. See appendix for a full description of Investment Grade. RTL’s top 20 tenants were 56.9% actual and 12.4% implied Investment Grade rated.
4. Leasing Pipeline and Executed Occupancy data as of July 31, 2023. Assumes executed leases commence and signed LOIs lead to definitive leases on their contemplated terms, which is not assured.
Diligent Balance
Sheet
Liquidity of $101.5 million,
weighted average interest
rate of 4.7%, weighted
average debt maturity of
3.8 years
Necessity-Based
Retail Focus
52.8% of portfolio SLR is
derived from Necessity-Based
retail tenants, which RTL
believes are more resilient to
e-commerce and economic
cycles than Traditional
Retail(1)
Robust Leasing
Platform
Year-over-year, total portfolio
Occupancy increased to
92.7%(1) in Q2’23 from 90.9%
in Q2’22 and is expected to
further increase
to 94.4%(4)
Proactive
Disposition Program
RTL completed $100.8 million
of dispositions in Q2’23,
bringing total 2023
dispositions to $172.2 million,
by contract sales price
Best-in-Class
Portfolio
69.3% of top 20 tenants are
actual or implied Investment
Grade Rated(1) and 50.9%
are Necessity-Based |
| The Necessity Retail REIT 3
® Where America Shops | www.necessityretailreit.com
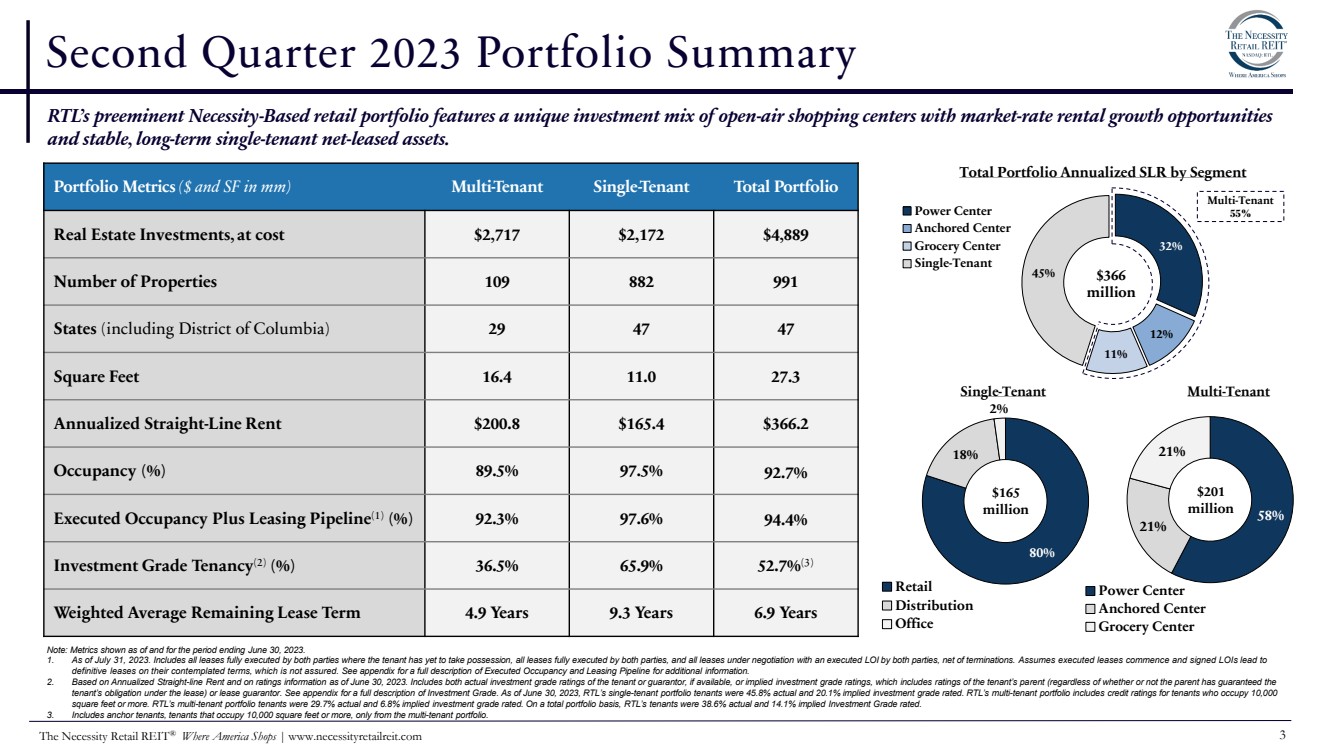
32%
12%
11%
45%
Power Center
Anchored Center
Grocery Center
Single-Tenant
Second Quarter 2023 Portfolio Summary
Portfolio Metrics($ and SF in mm) Multi-Tenant Single-Tenant Total Portfolio
Real Estate Investments, at cost $2,717 $2,172 $4,889
Number of Properties 109 882 991
States (including District of Columbia) 29 47 47
Square Feet 16.4 11.0 27.3
Annualized Straight-Line Rent $200.8 $165.4 $366.2
Occupancy (%) 89.5% 97.5% 92.7%
Executed Occupancy Plus Leasing Pipeline(1) (%) 92.3% 97.6% 94.4%
Investment Grade Tenancy(2) (%) 36.5% 65.9% 52.7%(3)
Weighted Average Remaining Lease Term 4.9 Years 9.3 Years 6.9 Years
RTL’s preeminent Necessity-Based retail portfolio features a unique investment mix of open-air shopping centers with market-rate rental growth opportunities
and stable, long-term single-tenant net-leased assets.
Note: Metrics shown as of and for the period ending June 30, 2023.
1. As of July 31, 2023. Includes all leases fully executed by both parties where the tenant has yet to take possession, all leases fully executed by both parties, and all leases under negotiation with an executed LOI by both parties, net of terminations. Assumes executed leases commence and signed LOIs lead to
definitive leases on their contemplated terms, which is not assured. See appendix for a full description of Executed Occupancy and Leasing Pipeline for additional information.
2. Based on Annualized Straight-line Rent and on ratings information as of June 30, 2023. Includes both actual investment grade ratings of the tenant or guarantor, if available, or implied investment grade ratings, which includes ratings of the tenant’s parent (regardless of whether or not the parent has guaranteed the
tenant’s obligation under the lease) or lease guarantor. See appendix for a full description of Investment Grade. As of June 30, 2023, RTL’s single-tenant portfolio tenants were 45.8% actual and 20.1% implied investment grade rated. RTL’s multi-tenant portfolio includes credit ratings for tenants who occupy 10,000
square feet or more. RTL’s multi-tenant portfolio tenants were 29.7% actual and 6.8% implied investment grade rated. On a total portfolio basis, RTL’s tenants were 38.6% actual and 14.1% implied Investment Grade rated.
3. Includes anchor tenants, tenants that occupy 10,000 square feet or more, only from the multi-tenant portfolio.
58%
21%
21%
Power Center
Anchored Center
Grocery Center
80%
18%
2%
Retail
Distribution
Office
$165
million
$201
million
Total Portfolio Annualized SLR by Segment
$366
million
Multi-Tenant
55%
Single-Tenant Multi-Tenant |
| The Necessity Retail REIT 4
® Where America Shops | www.necessityretailreit.com
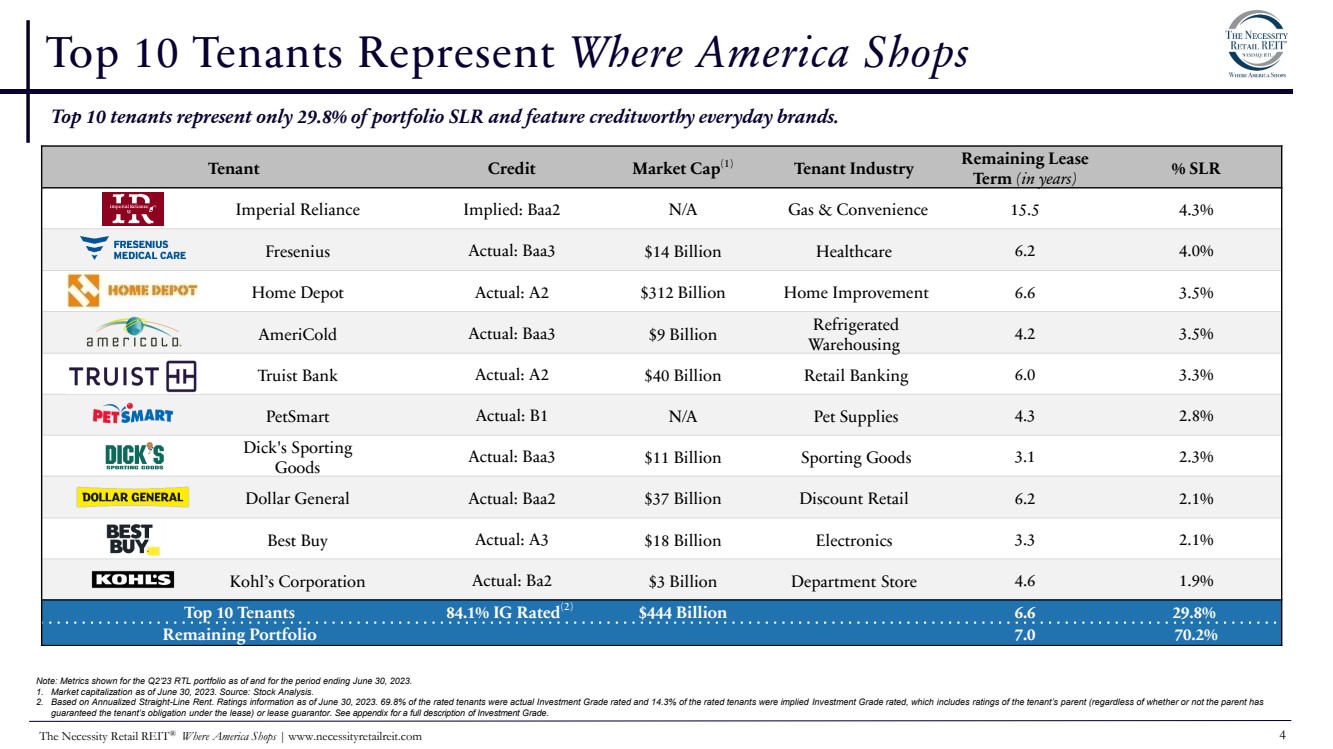
Top 10 Tenants Represent Where America Shops
Top 10 tenants represent only 29.8% of portfolio SLR and feature creditworthy everyday brands.
Tenant Credit Market Cap(1) Tenant Industry Remaining Lease
Term (in years) % SLR
Imperial Reliance Implied: Baa2 N/A Gas & Convenience 15.5 4.3%
Fresenius Actual: Baa3 $14 Billion Healthcare 6.2 4.0%
Home Depot Actual: A2 $312 Billion Home Improvement 6.6 3.5%
AmeriCold Actual: Baa3 $9 Billion Refrigerated
Warehousing 4.2 3.5%
Truist Bank Actual: A2 $40 Billion Retail Banking 6.0 3.3%
PetSmart Actual: B1 N/A Pet Supplies 4.3 2.8%
Dick's Sporting
Goods Actual: Baa3 $11 Billion Sporting Goods 3.1 2.3%
Dollar General Actual: Baa2 $37 Billion Discount Retail 6.2 2.1%
Best Buy Actual: A3 $18 Billion Electronics 3.3 2.1%
Kohl’s Corporation Actual: Ba2 $3 Billion Department Store 4.6 1.9%
Top 10 Tenants 84.1% IG Rated(2) $444 Billion 6.6 29.8%
Remaining Portfolio 7.0 70.2%
Note: Metrics shown for the Q2’23 RTL portfolio as of and for the period ending June 30, 2023.
1. Market capitalization as of June 30, 2023. Source: Stock Analysis.
2. Based on Annualized Straight-Line Rent. Ratings information as of June 30, 2023. 69.8% of the rated tenants were actual Investment Grade rated and 14.3% of the rated tenants were implied Investment Grade rated, which includes ratings of the tenant’s parent (regardless of whether or not the parent has
guaranteed the tenant’s obligation under the lease) or lease guarantor. See appendix for a full description of Investment Grade. |
| The Necessity Retail REIT 5
® Where America Shops | www.necessityretailreit.com
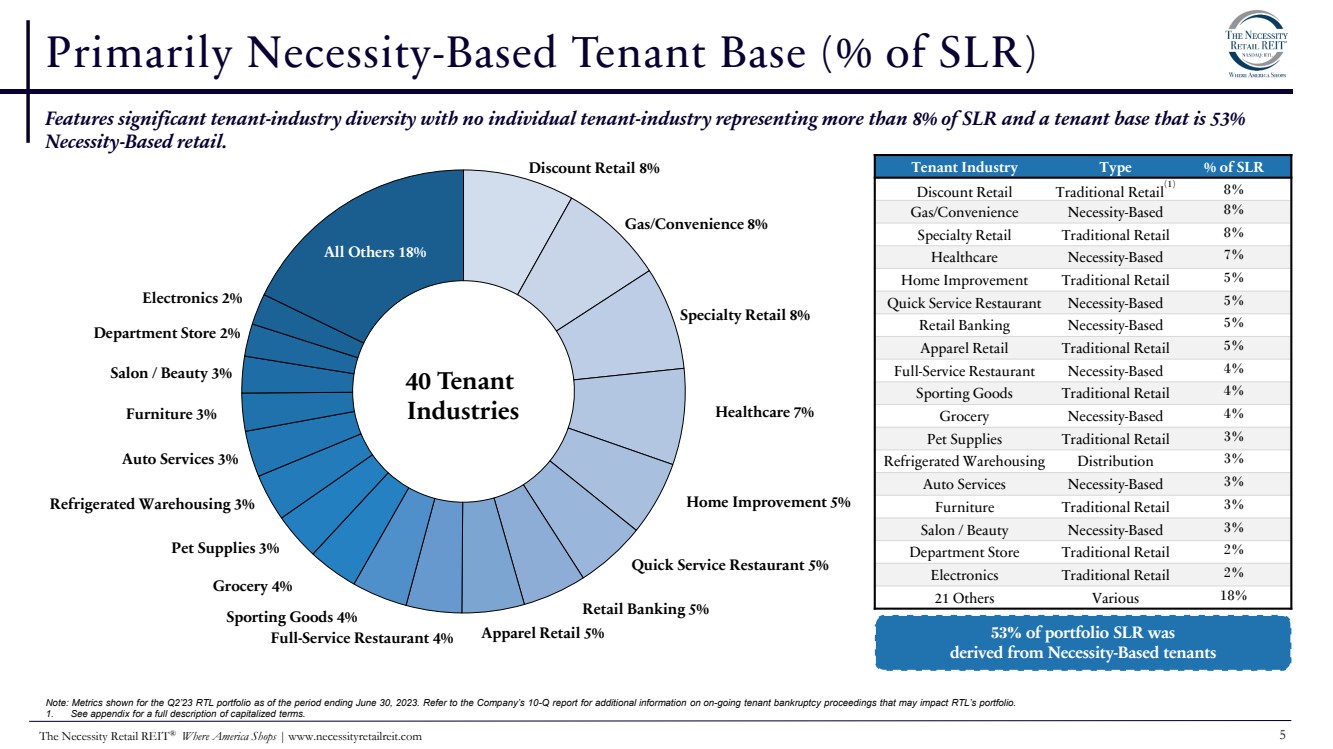
Primarily Necessity-Based Tenant Base (% of SLR)
Features significant tenant-industry diversity with no individual tenant-industry representing more than 8% of SLR and a tenant base that is 53%
Necessity-Based retail.
Tenant Industry Type % of SLR
Discount Retail Traditional Retail(1) 8%
Gas/Convenience Necessity-Based 8%
Specialty Retail Traditional Retail 8%
Healthcare Necessity-Based 7%
Home Improvement Traditional Retail 5%
Quick Service Restaurant Necessity-Based 5%
Retail Banking Necessity-Based 5%
Apparel Retail Traditional Retail 5%
Full-Service Restaurant Necessity-Based 4%
Sporting Goods Traditional Retail 4%
Grocery Necessity-Based 4%
Pet Supplies Traditional Retail 3%
Refrigerated Warehousing Distribution 3%
Auto Services Necessity-Based 3%
Furniture Traditional Retail 3%
Salon / Beauty Necessity-Based 3%
Department Store Traditional Retail 2%
Electronics Traditional Retail 2%
21 Others Various 18%
Discount Retail 8%
Gas/Convenience 8%
Specialty Retail 8%
Healthcare 7%
Home Improvement 5%
Quick Service Restaurant 5%
Retail Banking 5%
Full-Service Restaurant 4% Apparel Retail 5%
Sporting Goods 4%
Grocery 4%
Pet Supplies 3%
Refrigerated Warehousing 3%
Auto Services 3%
Furniture 3%
Salon / Beauty 3%
Department Store 2%
Electronics 2%
All Others 18%
40 Tenant
Industries
53% of portfolio SLR was
derived from Necessity-Based tenants
Note: Metrics shown for the Q2’23 RTL portfolio as of the period ending June 30, 2023. Refer to the Company’s 10-Q report for additional information on on-going tenant bankruptcy proceedings that may impact RTL’s portfolio.
1. See appendix for a full description of capitalized terms. |
| The Necessity Retail REIT 6
® Where America Shops | www.necessityretailreit.com
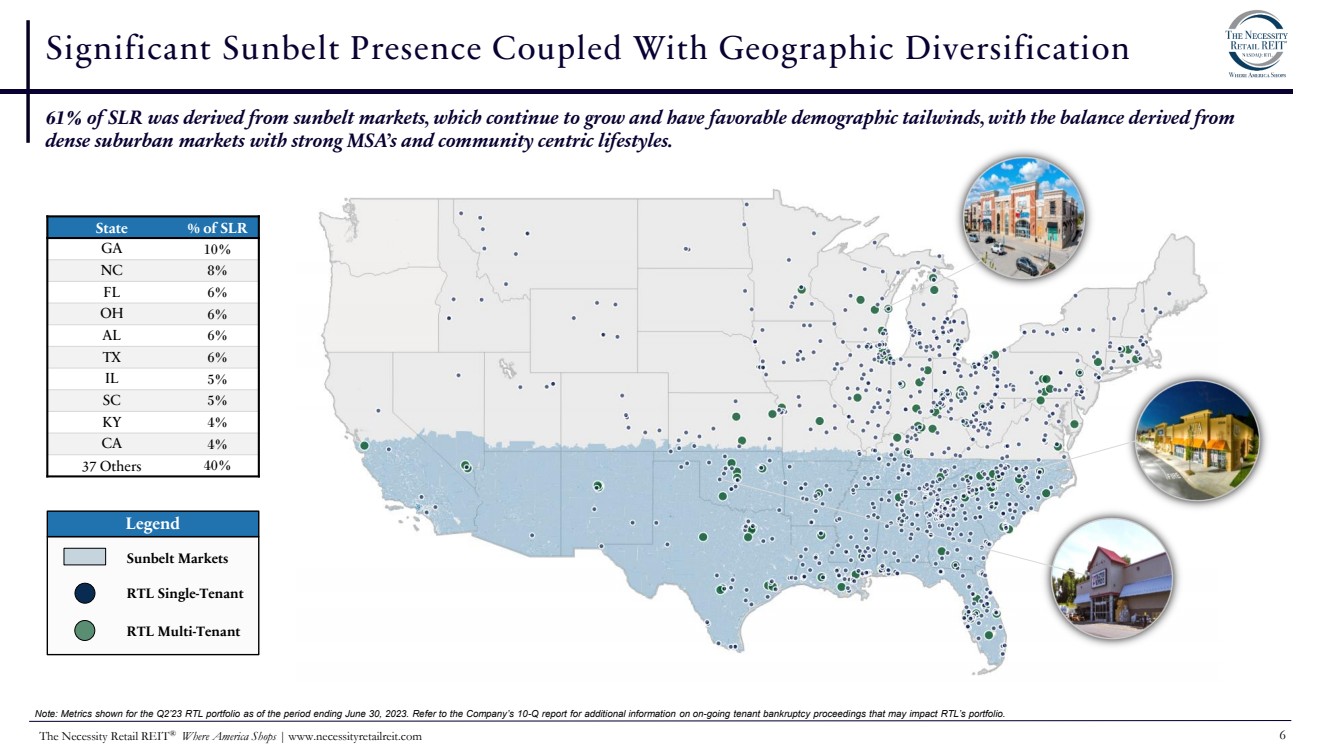
Significant Sunbelt Presence Coupled With Geographic Diversification
61% of SLR was derived from sunbelt markets, which continue to grow and have favorable demographic tailwinds, with the balance derived from
dense suburban markets with strong MSA’s and community centric lifestyles.
Sunbelt Markets
RTL Single-Tenant
RTL Multi-Tenant
State % of SLR
GA 10%
NC 8%
FL 6%
OH 6%
AL 6%
TX 6%
IL 5%
SC 5%
KY 4%
CA 4%
37 Others 40%
Legend
Note: Metrics shown for the Q2’23 RTL portfolio as of the period ending June 30, 2023. Refer to the Company’s 10-Q report for additional information on on-going tenant bankruptcy proceedings that may impact RTL’s portfolio. |
| The Necessity Retail REIT 7
® Where America Shops | www.necessityretailreit.com
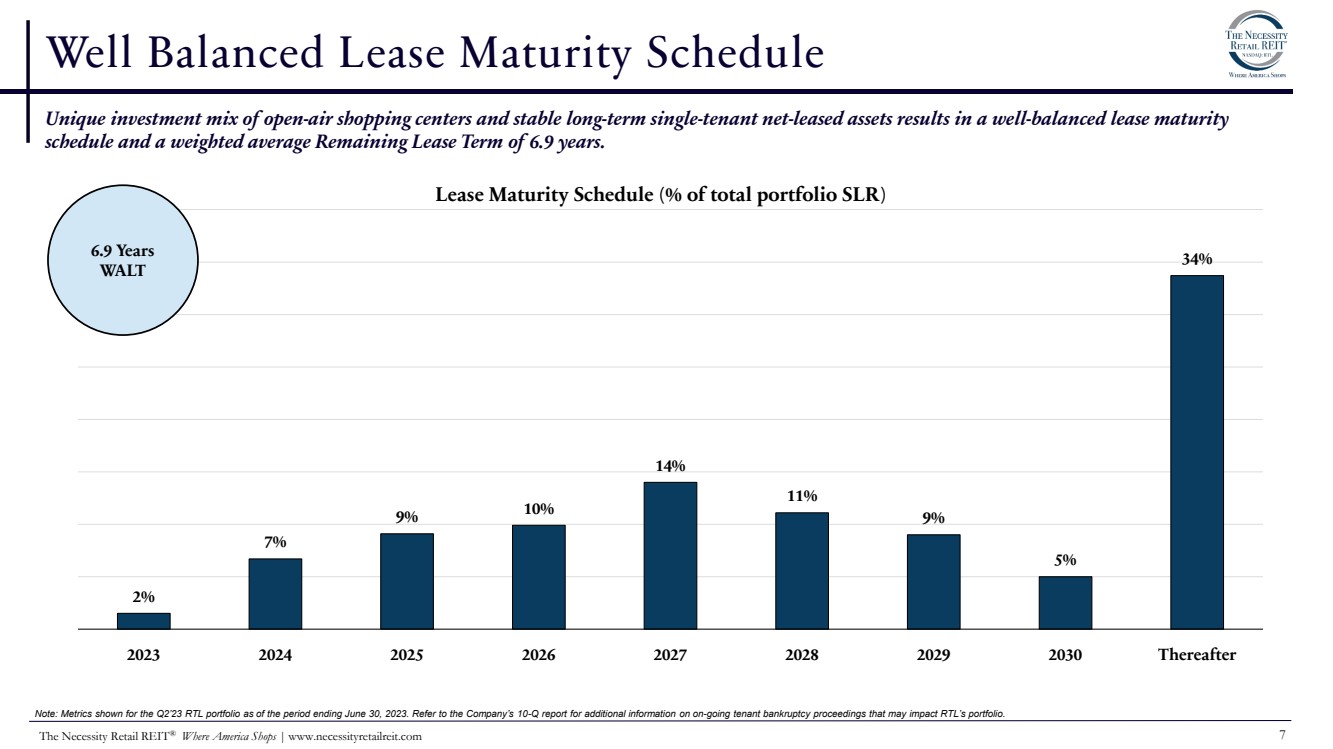
2%
7%
9% 10%
14%
11%
9%
5%
34%
2023 2024 2025 2026 2027 2028 2029 2030 Thereafter
Lease Maturity Schedule (% of total portfolio SLR)
Well Balanced Lease Maturity Schedule
Unique investment mix of open-air shopping centers and stable long-term single-tenant net-leased assets results in a well-balanced lease maturity
schedule and a weighted average Remaining Lease Term of 6.9 years.
6.9 Years
WALT
Note: Metrics shown for the Q2’23 RTL portfolio as of the period ending June 30, 2023. Refer to the Company’s 10-Q report for additional information on on-going tenant bankruptcy proceedings that may impact RTL’s portfolio. |
| The Necessity Retail REIT 8
® Where America Shops | www.necessityretailreit.com
87.6%
89.5%
92.3%
RTL Q2'22
Occupancy
RTL Q2'23
Occupancy
14,651 SF
122 SF
341 SF
14,200
14,400
14,600
14,800
15,000
15,200
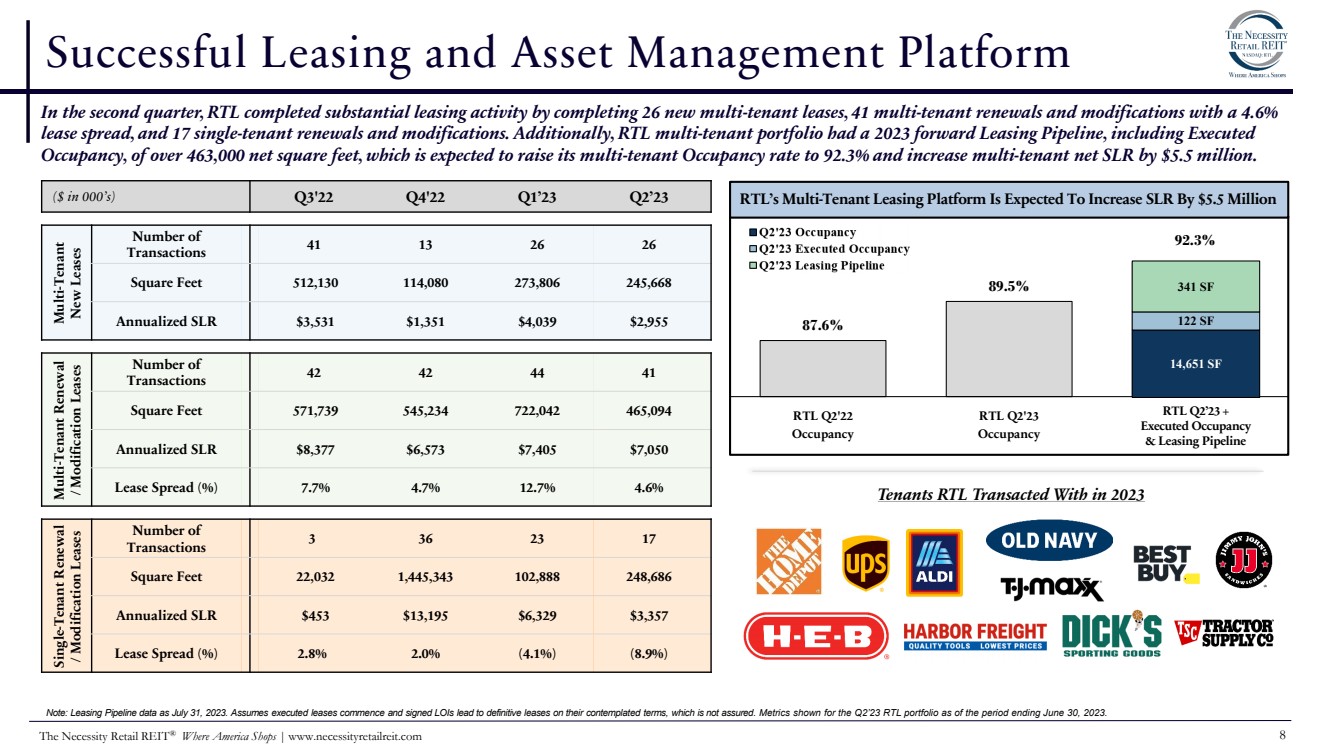
Successful Leasing and Asset Management Platform
RTL’s Multi-Tenant Leasing Platform Is Expected To Increase SLR By $5.5 Million
Note: Leasing Pipeline data as July 31, 2023. Assumes executed leases commence and signed LOIs lead to definitive leases on their contemplated terms, which is not assured. Metrics shown for the Q2’23 RTL portfolio as of the period ending June 30, 2023.
In the second quarter, RTL completed substantial leasing activity by completing 26 new multi-tenant leases, 41 multi-tenant renewals and modifications with a 4.6%
lease spread, and 17 single-tenant renewals and modifications. Additionally, RTL multi-tenant portfolio had a 2023 forward Leasing Pipeline, including Executed
Occupancy, of over 463,000 net square feet, which is expected to raise its multi-tenant Occupancy rate to 92.3% and increase multi-tenant net SLR by $5.5 million.
Tenants RTL Transacted With in 2023
RTL Q2’23 +
Executed Occupancy
& Leasing Pipeline
($ in 000’s) Q3'22 Q4'22 Q1’23 Q2’23 Multi-Tenant New Leases
Number of
Transactions 41 13 26 26
Square Feet 512,130 114,080 273,806 245,668
Annualized SLR $3,531 $1,351 $4,039 $2,955
Multi-Tenant Renewal
/ Modification Leases
Number of
Transactions 42 42 44 41
Square Feet 571,739 545,234 722,042 465,094
Annualized SLR $8,377 $6,573 $7,405 $7,050
Lease Spread (%) 7.7% 4.7% 12.7% 4.6%
Single-Tenant Renewal
/ Modification Leases
Number of
Transactions 3 36 23 17
Square Feet 22,032 1,445,343 102,888 248,686
Annualized SLR $453 $13,195 $6,329 $3,357
Lease Spread (%) 2.8% 2.0% (4.1%) (8.9%) |

| The Necessity Retail REIT 9
® Where America Shops | www.necessityretailreit.com
Second Quarter 2023 Financial Highlights
Note: Metrics as of and for the three months ended June 30, 2023 and June 30, 2022. See Definitions in the appendix for a full description of capitalized terms and for a reconciliation of non-GAAP metrics.
1) Weighted average interest rate based on the balance outstanding and the rate on that balance as of June 30, 2023.
2) See Definitions in the appendix for a full description and a reconciliation of non-GAAP metrics.
3) Excludes the effect of deferred financing costs, net and mortgage premiums, net.
4) Excluding the impacts of GAAP write-offs for lease rejections due to tenant bankruptcies, Adjusted EBITDA would have been $70.9 million and Net Debt/Adjusted EBITDA would have been 9.3x as of June 30, 2023.
5) Includes $20.9 million of costs associated with the proposed merger with GNL, the proxy contest and Blackwells related expenses.
Earnings Summary ($ mm) Q2’23
Net (Loss) Income Attributable to Common Stockholders ($53.5)
NOI(2) $81.6
Cash NOI(2) $81.3
Funds from Operations (FFO)(2) $0.5
Adjusted Funds from Operations (AFFO)(2) $27.9
Funds from Operations (FFO) per Share $0.00(5)
Adjusted Funds from Operations (AFFO) per Share $0.21
Weighted Average Diluted Shares Outstanding 133.8
Optimizing portfolio and financial performance through strategic asset management initiatives by executing significant new and renewal leasing activity and
disposing of select assets.
Key Capitalization Metrics ($ in mm) Q2’23
Net Debt(2)(3) $2,626
Gross Asset Value(2) $5,142
Net Debt / Adjusted EBITDA 9.9x
Net Debt / Adjusted EBITDA (Excluding non-recurring write-offs(4)) 9.3x
Net Debt / Gross Asset Value 51.0%_
Debt Capitalization (as of June 30, 2023) ($mm)
Single-Tenant Mortgages $1,211
Multi-Tenant Mortgages $370
Total Secured Debt $1,581
2028 4.5% Senior Unsecured Notes $500
Revolving Credit Facility $604
Total Unsecured Debt $1,104
Total Debt $2,685
Weighted Average Interest Rate(1) 4.7%
Trailing Twelve Months
$113.5
$128.1
Common Stock Dividends AFFO |
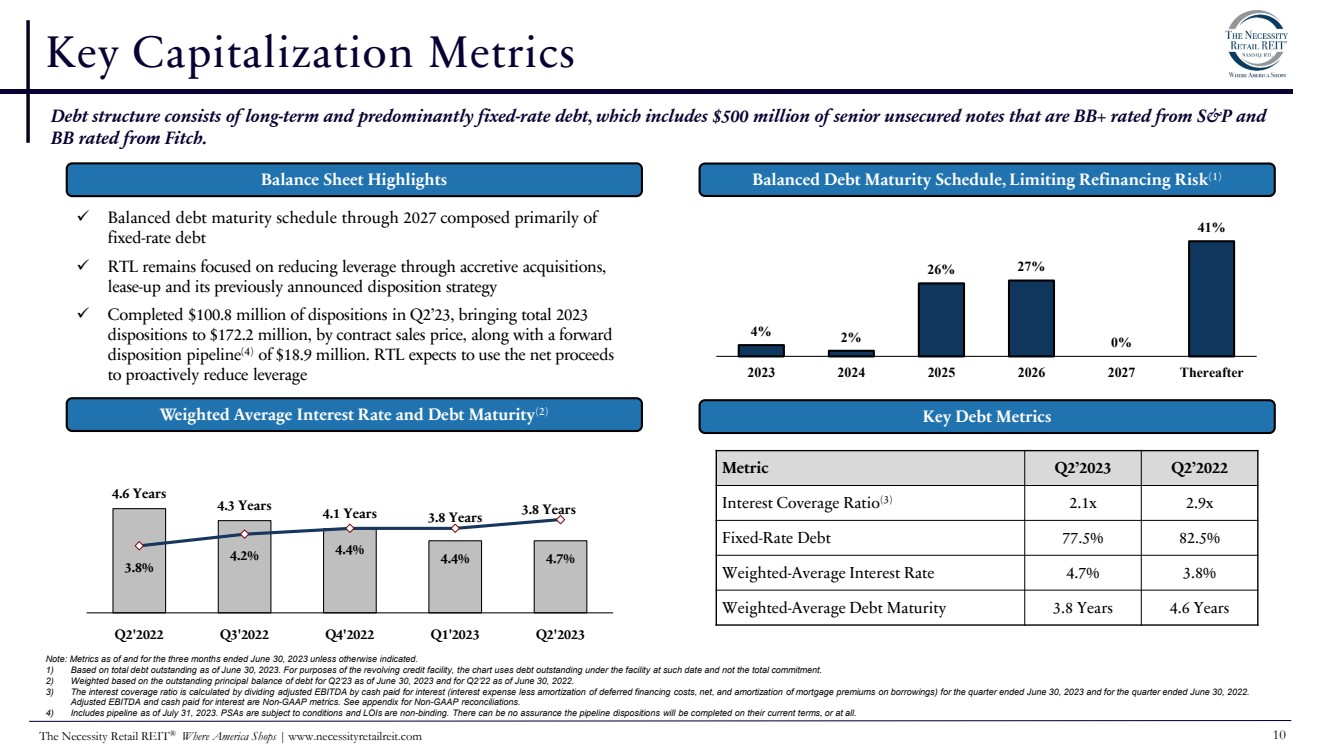
| The Necessity Retail REIT 10 ® Where America Shops | www.necessityretailreit.com
4% 2%
26% 27%
0%
41%
2023 2024 2025 2026 2027 Thereafter
Key Capitalization Metrics
4.6 Years
4.3 Years 4.1 Years 3.8 Years
4.7%
3.8%
4.2% 4.4% 4.4%
3.8 Years
2
2.5
3
3.5
4
4.5
5
5.5
6
0.015
0.025
0.035
0.045
0.055
0.065
Q2'2022 Q3'2022 Q4'2022 Q1'2023 Q2'2023
✓ Balanced debt maturity schedule through 2027 composed primarily of
fixed-rate debt
✓ RTL remains focused on reducing leverage through accretive acquisitions,
lease-up and its previously announced disposition strategy
✓ Completed $100.8 million of dispositions in Q2’23, bringing total 2023
dispositions to $172.2 million, by contract sales price, along with a forward
disposition pipeline(4) of $18.9 million. RTL expects to use the net proceeds
to proactively reduce leverage
Note: Metrics as of and for the three months ended June 30, 2023 unless otherwise indicated.
1) Based on total debt outstanding as of June 30, 2023. For purposes of the revolving credit facility, the chart uses debt outstanding under the facility at such date and not the total commitment.
2) Weighted based on the outstanding principal balance of debt for Q2’23 as of June 30, 2023 and for Q2’22 as of June 30, 2022.
3) The interest coverage ratio is calculated by dividing adjusted EBITDA by cash paid for interest (interest expense less amortization of deferred financing costs, net, and amortization of mortgage premiums on borrowings) for the quarter ended June 30, 2023 and for the quarter ended June 30, 2022.
Adjusted EBITDA and cash paid for interest are Non-GAAP metrics. See appendix for Non-GAAP reconciliations.
4) Includes pipeline as of July 31, 2023. PSAs are subject to conditions and LOIs are non-binding. There can be no assurance the pipeline dispositions will be completed on their current terms, or at all.
Metric Q2’2023 Q2’2022
Interest Coverage Ratio(3) 2.1x 2.9x
Fixed-Rate Debt 77.5% 82.5%
Weighted-Average Interest Rate 4.7% 3.8%
Weighted-Average Debt Maturity 3.8 Years 4.6 Years
Balance Sheet Highlights
Weighted Average Interest Rate and Debt Maturity(2) Key Debt Metrics
Balanced Debt Maturity Schedule, Limiting Refinancing Risk(1)
Debt structure consists of long-term and predominantly fixed-rate debt, which includes $500 million of senior unsecured notes that are BB+ rated from S&P and
BB rated from Fitch. |
| The Necessity Retail REIT 11 ® Where America Shops | www.necessityretailreit.com
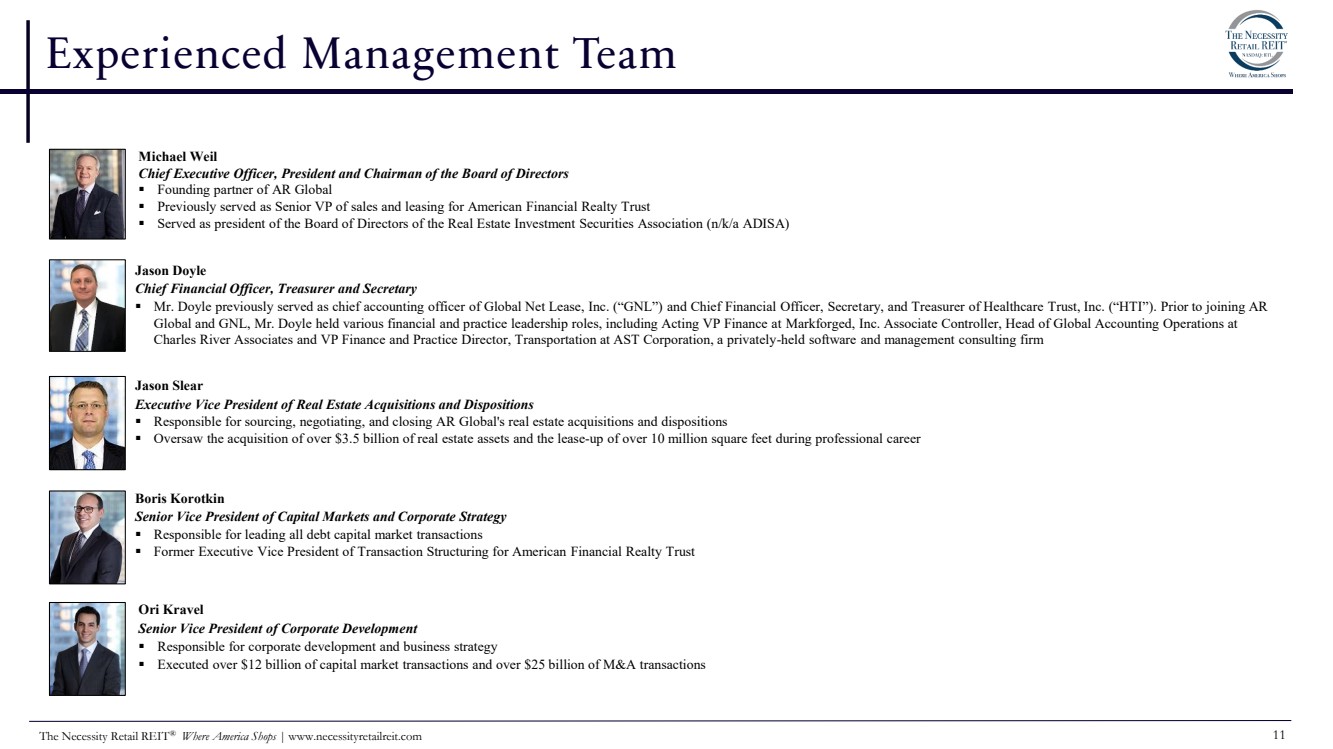
Experienced Management Team
Jason Slear
Executive Vice President of Real Estate Acquisitions and Dispositions
▪ Responsible for sourcing, negotiating, and closing AR Global's real estate acquisitions and dispositions
▪ Oversaw the acquisition of over $3.5 billion of real estate assets and the lease-up of over 10 million square feet during professional career
Michael Weil
Chief Executive Officer, President and Chairman of the Board of Directors
▪ Founding partner of AR Global
▪ Previously served as Senior VP of sales and leasing for American Financial Realty Trust
▪ Served as president of the Board of Directors of the Real Estate Investment Securities Association (n/k/a ADISA)
Boris Korotkin
Senior Vice President of Capital Markets and Corporate Strategy
▪ Responsible for leading all debt capital market transactions
▪ Former Executive Vice President of Transaction Structuring for American Financial Realty Trust
Ori Kravel
Senior Vice President of Corporate Development
▪ Responsible for corporate development and business strategy
▪ Executed over $12 billion of capital market transactions and over $25 billion of M&A transactions
Jason Doyle
Chief Financial Officer, Treasurer and Secretary
▪ Mr. Doyle previously served as chief accounting officer of Global Net Lease, Inc. (“GNL”) and Chief Financial Officer, Secretary, and Treasurer of Healthcare Trust, Inc. (“HTI”). Prior to joining AR
Global and GNL, Mr. Doyle held various financial and practice leadership roles, including Acting VP Finance at Markforged, Inc. Associate Controller, Head of Global Accounting Operations at
Charles River Associates and VP Finance and Practice Director, Transportation at AST Corporation, a privately-held software and management consulting firm |

| The Necessity Retail REIT 12 ® Where America Shops | www.necessityretailreit.com
Legal Notices |
| The Necessity Retail REIT 13 ® Where America Shops | www.necessityretailreit.com
Disclaimers
Disclaimers
This presentation includes estimated projections of future operating results or activities such as, among other things, leasing activity. The projections are based entirely on the future operating results and activities of the Company alone and do not take
into consideration any future operating results or activities of the Company after the proposed merger with GNL. These projections were not prepared in accordance with published guidelines of the SEC or the guidelines established by the American
Institute of Certified Public Accountants for preparation and presentation of financial projections. This information is not fact and should not be relied upon as being necessarily indicative of future results; the projections were prepared in good faith
by management and are based on numerous assumptions that may prove to be wrong. Important factors that may affect actual results and cause the projections to not be achieved include, but are not limited to, risks and uncertainties relating to the
Company and other factors described in the “Risk Factors” section of the Company's Annual Report on Form 10-K for the year ended December 31, 2022, the Company's subsequent Quarterly Reports on Form 10-Q and in future filings with the SEC.
The projections also reflect assumptions as to certain business decisions that are subject to change. As a result, actual results may differ materially from those contained in the estimates. Accordingly, there can be no assurance that the estimates will be
realized. The industry in which we operate is subject to a high degree of uncertainty and risk due to variety of factors, including those described in the “Risk Factors” and "Management's Discussion and Analysis of Financial Condition and Results of
Operations" sections of the Company's Annual Report on Form 10-K for the year ended December 31, 2022, filed with the SEC on February 23, 2023 and the Company's subsequent Quarterly Reports on Form 10-Q, Current Reports on Form 8-K and
Annual Reports on Form 10-K filed with the SEC. These and other factors could cause results to differ materially from those expressed in these publications and reports.
This presentation contains estimates and information concerning the Company’s industry that is based on industry publications. The Company has not independently verified the accuracy of the data contained in these industry publications. These
estimates and information involve a number of assumptions and limitations, and you are cautioned not to rely on or give undue weight to this information.
Credit Ratings
A securities rating is not a recommendation to buy, sell or hold securities and may be subject to revision or withdrawal at any time. Each rating agency has its own methodology for assigning ratings and, accordingly, each rating should be evaluated
independently of any other rating.
Additional Information About the REIT Merger and Internalization Merger and Where to Find It
In connection with the proposed transactions, on July 6, 2023, GNL filed with the SEC a registration statement on Form S-4 (as amended on July 17,2023), which includes a document that serves as a prospectus of GNL and a joint proxy statement of
GNL and the Company. Each party also plans to file other relevant documents with the SEC regarding the proposed transactions (the “joint proxy statement/prospectus”). The Form S-4 became effective on July 18, 2023. INVESTORS AND SECURITY
HOLDERS ARE URGED TO READ THE JOINT PROXY STATEMENT/PROSPECTUS AND OTHER RELEVANT DOCUMENTS FILED WITH THE SEC BECAUSE THEY CONTAIN IMPORTANT INFORMATION ABOUT THE PROPOSED
TRANSACTIONS. The Company commenced mailing the definitive joint proxy statement/prospectus to stockholders on or about July 19, 2023. Investors and security holders may obtain a free copy of the joint proxy statement/prospectus and other
relevant documents filed by the Company with the SEC at the SEC's website at www.sec.gov. Copies of the documents filed by the Company with the SEC are available free of charge on the Company's website at www.necessityretailreit.com or by
contacting the Company's Investor Relations at ir@rtlreit.com.
Participants in the Proxy Solicitation
The Company and its respective directors, executive officers and other members of management and employees may be deemed to be participants in the solicitation of proxies in respect of the proposed transactions. Information about the directors and
executive officers of the Company is available in its proxy statement for the 2023 Annual Meeting, as incorporated by reference in the joint proxy statement/prospectus. Other information regarding the participants in the proxy solicitation and a
description of their direct and indirect interests, by security holdings or otherwise, is contained in the joint proxy statement/prospectus and other relevant materials filed with the SEC regarding the proposed transactions. Investors should read the joint
proxy statement/prospectus carefully before making any voting or investment decisions. Investors may obtain free copies of these documents from the Company as indicated above. |
| The Necessity Retail REIT 14 ® Where America Shops | www.necessityretailreit.com
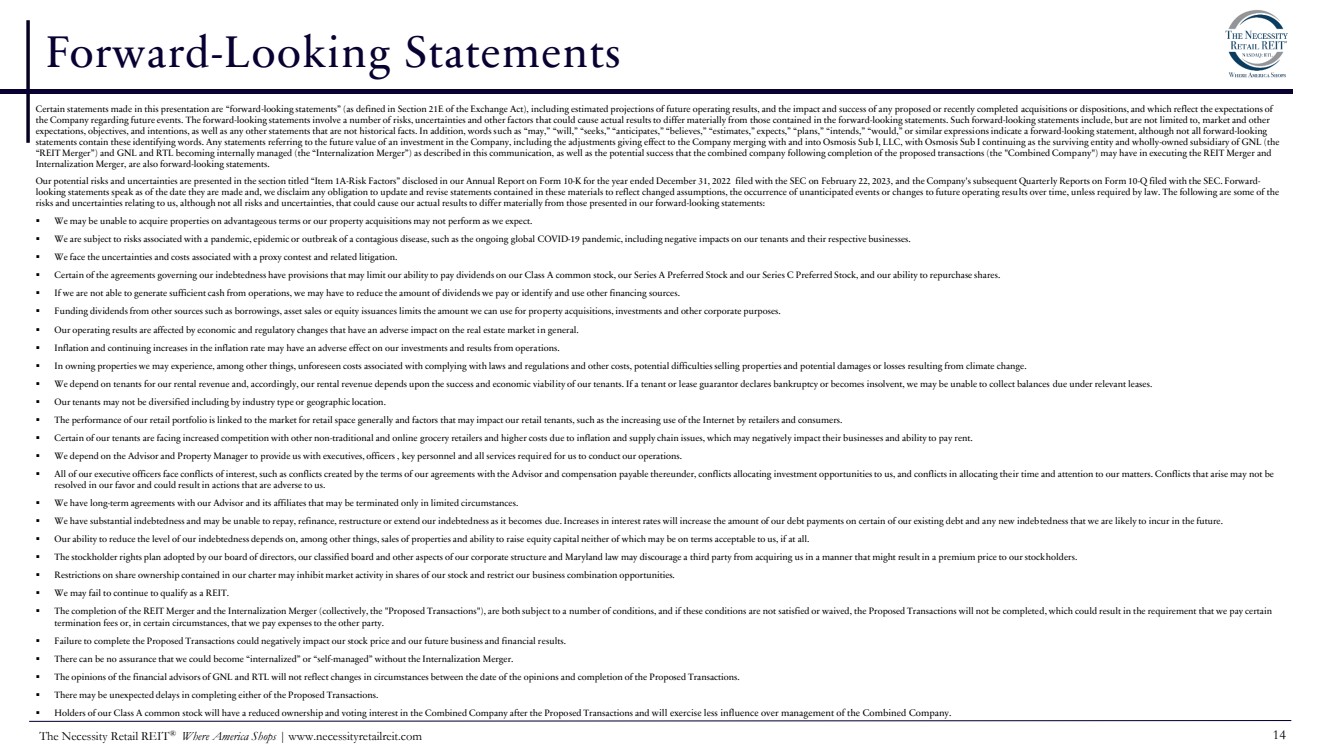
Forward-Looking Statements
Certain statements made in this presentation are “forward-looking statements” (as defined in Section 21E of the Exchange Act), including estimated projections of future operating results, and the impact and success of any proposed or recently completed acquisitions or dispositions, and which reflect the expectations of
the Company regarding future events. The forward-looking statements involve a number of risks, uncertainties and other factors that could cause actual results to differ materially from those contained in the forward-looking statements. Such forward-looking statements include, but are not limited to, market and other
expectations, objectives, and intentions, as well as any other statements that are not historical facts. In addition, words such as “may,” “will,” “seeks,” “anticipates,” “believes,” “estimates,” expects,” “plans,” “intends,” “would,” or similar expressions indicate a forward-looking statement, although not all forward-looking
statements contain these identifying words. Any statements referring to the future value of an investment in the Company, including the adjustments giving effect to the Company merging with and into Osmosis Sub I, LLC, with Osmosis Sub I continuing as the surviving entity and wholly-owned subsidiary of GNL (the
“REIT Merger”) and GNL and RTL becoming internally managed (the “Internalization Merger”) as described in this communication, as well as the potential success that the combined company following completion of the proposed transactions (the "Combined Company") may have in executing the REIT Merger and
Internalization Merger, are also forward-looking statements.
Our potential risks and uncertainties are presented in the section titled “Item 1A-Risk Factors” disclosed in our Annual Report on Form 10-K for the year ended December 31, 2022 filed with the SEC on February 22, 2023, and the Company's subsequent Quarterly Reports on Form 10-Q filed with the SEC. Forward-looking statements speak as of the date they are made and, we disclaim any obligation to update and revise statements contained in these materials to reflect changed assumptions, the occurrence of unanticipated events or changes to future operating results over time, unless required by law. The following are some of the
risks and uncertainties relating to us, although not all risks and uncertainties, that could cause our actual results to differ materially from those presented in our forward-looking statements:
▪ We may be unable to acquire properties on advantageous terms or our property acquisitions may not perform as we expect.
▪ We are subject to risks associated with a pandemic, epidemic or outbreak of a contagious disease, such as the ongoing global COVID-19 pandemic, including negative impacts on our tenants and their respective businesses.
▪ We face the uncertainties and costs associated with a proxy contest and related litigation.
▪ Certain of the agreements governing our indebtedness have provisions that may limit our ability to pay dividends on our Class A common stock, our Series A Preferred Stock and our Series C Preferred Stock, and our ability to repurchase shares.
▪ If we are not able to generate sufficient cash from operations, we may have to reduce the amount of dividends we pay or identify and use other financing sources.
▪ Funding dividends from other sources such as borrowings, asset sales or equity issuances limits the amount we can use for property acquisitions, investments and other corporate purposes.
▪ Our operating results are affected by economic and regulatory changes that have an adverse impact on the real estate market in general.
▪ Inflation and continuing increases in the inflation rate may have an adverse effect on our investments and results from operations.
▪ In owning properties we may experience, among other things, unforeseen costs associated with complying with laws and regulations and other costs, potential difficulties selling properties and potential damages or losses resulting from climate change.
▪ We depend on tenants for our rental revenue and, accordingly, our rental revenue depends upon the success and economic viability of our tenants. If a tenant or lease guarantor declares bankruptcy or becomes insolvent, we may be unable to collect balances due under relevant leases.
▪ Our tenants may not be diversified including by industry type or geographic location.
▪ The performance of our retail portfolio is linked to the market for retail space generally and factors that may impact our retail tenants, such as the increasing use of the Internet by retailers and consumers.
▪ Certain of our tenants are facing increased competition with other non-traditional and online grocery retailers and higher costs due to inflation and supply chain issues, which may negatively impact their businesses and ability to pay rent.
▪ We depend on the Advisor and Property Manager to provide us with executives, officers , key personnel and all services required for us to conduct our operations.
▪ All of our executive officers face conflicts of interest, such as conflicts created by the terms of our agreements with the Advisor and compensation payable thereunder, conflicts allocating investment opportunities to us, and conflicts in allocating their time and attention to our matters. Conflicts that arise may not be
resolved in our favor and could result in actions that are adverse to us.
▪ We have long-term agreements with our Advisor and its affiliates that may be terminated only in limited circumstances.
▪ We have substantial indebtedness and may be unable to repay, refinance, restructure or extend our indebtedness as it becomes due. Increases in interest rates will increase the amount of our debt payments on certain of our existing debt and any new indebtedness that we are likely to incur in the future.
▪ Our ability to reduce the level of our indebtedness depends on, among other things, sales of properties and ability to raise equity capital neither of which may be on terms acceptable to us, if at all.
▪ The stockholder rights plan adopted by our board of directors, our classified board and other aspects of our corporate structure and Maryland law may discourage a third party from acquiring us in a manner that might result in a premium price to our stockholders.
▪ Restrictions on share ownership contained in our charter may inhibit market activity in shares of our stock and restrict our business combination opportunities.
▪ We may fail to continue to qualify as a REIT.
▪ The completion of the REIT Merger and the Internalization Merger (collectively, the "Proposed Transactions"), are both subject to a number of conditions, and if these conditions are not satisfied or waived, the Proposed Transactions will not be completed, which could result in the requirement that we pay certain
termination fees or, in certain circumstances, that we pay expenses to the other party.
▪ Failure to complete the Proposed Transactions could negatively impact our stock price and our future business and financial results.
▪ There can be no assurance that we could become “internalized” or “self-managed” without the Internalization Merger.
▪ The opinions of the financial advisors of GNL and RTL will not reflect changes in circumstances between the date of the opinions and completion of the Proposed Transactions.
▪ There may be unexpected delays in completing either of the Proposed Transactions.
▪ Holders of our Class A common stock will have a reduced ownership and voting interest in the Combined Company after the Proposed Transactions and will exercise less influence over management of the Combined Company. |

| The Necessity Retail REIT 15 ® Where America Shops | www.necessityretailreit.com
Appendix |
| The Necessity Retail REIT 16 ® Where America Shops | www.necessityretailreit.com
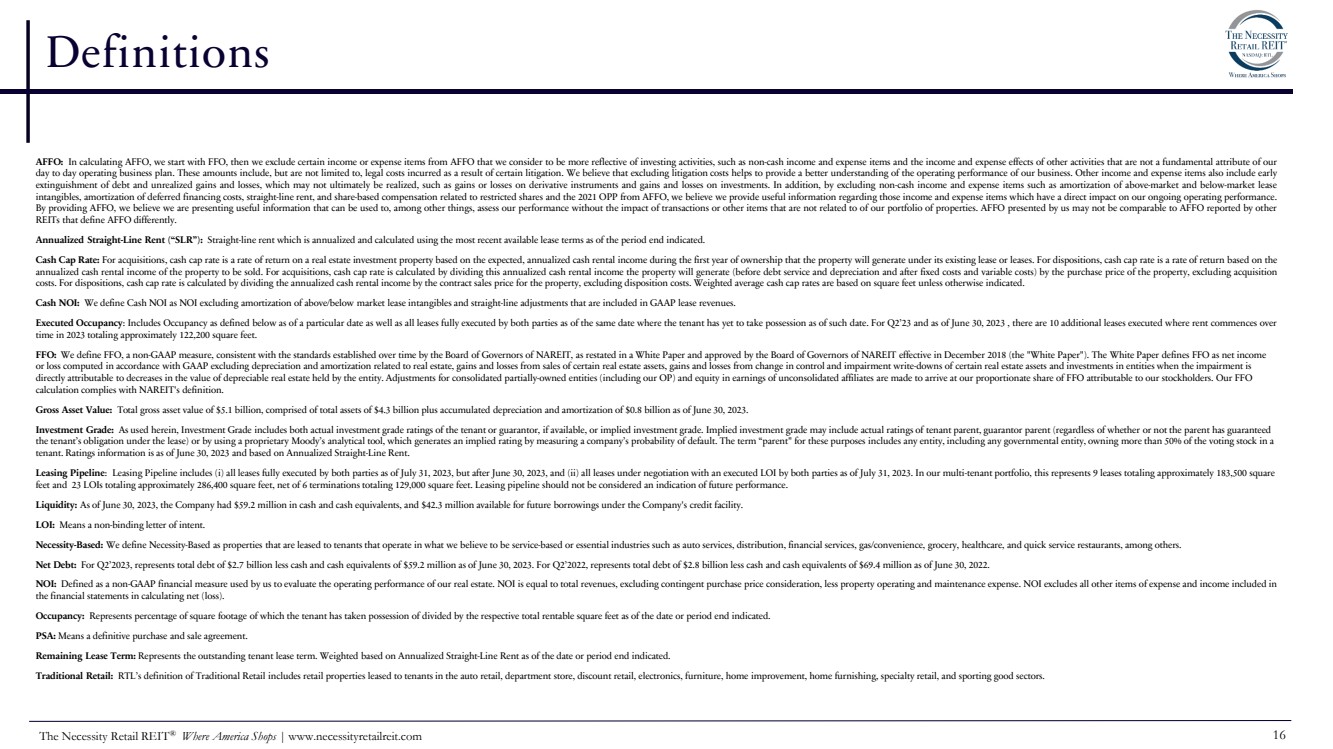
Definitions
AFFO: In calculating AFFO, we start with FFO, then we exclude certain income or expense items from AFFO that we consider to be more reflective of investing activities, such as non-cash income and expense items and the income and expense effects of other activities that are not a fundamental attribute of our
day to day operating business plan. These amounts include, but are not limited to, legal costs incurred as a result of certain litigation. We believe that excluding litigation costs helps to provide a better understanding of the operating performance of our business. Other income and expense items also include early
extinguishment of debt and unrealized gains and losses, which may not ultimately be realized, such as gains or losses on derivative instruments and gains and losses on investments. In addition, by excluding non-cash income and expense items such as amortization of above-market and below-market lease
intangibles, amortization of deferred financing costs, straight-line rent, and share-based compensation related to restricted shares and the 2021 OPP from AFFO, we believe we provide useful information regarding those income and expense items which have a direct impact on our ongoing operating performance.
By providing AFFO, we believe we are presenting useful information that can be used to, among other things, assess our performance without the impact of transactions or other items that are not related to of our portfolio of properties. AFFO presented by us may not be comparable to AFFO reported by other
REITs that define AFFO differently.
Annualized Straight-Line Rent (“SLR”): Straight-line rent which is annualized and calculated using the most recent available lease terms as of the period end indicated.
Cash Cap Rate: For acquisitions, cash cap rate is a rate of return on a real estate investment property based on the expected, annualized cash rental income during the first year of ownership that the property will generate under its existing lease or leases. For dispositions, cash cap rate is a rate of return based on the
annualized cash rental income of the property to be sold. For acquisitions, cash cap rate is calculated by dividing this annualized cash rental income the property will generate (before debt service and depreciation and after fixed costs and variable costs) by the purchase price of the property, excluding acquisition
costs. For dispositions, cash cap rate is calculated by dividing the annualized cash rental income by the contract sales price for the property, excluding disposition costs. Weighted average cash cap rates are based on square feet unless otherwise indicated.
Cash NOI: We define Cash NOI as NOI excluding amortization of above/below market lease intangibles and straight-line adjustments that are included in GAAP lease revenues.
Executed Occupancy: Includes Occupancy as defined below as of a particular date as well as all leases fully executed by both parties as of the same date where the tenant has yet to take possession as of such date. For Q2’23 and as of June 30, 2023 , there are 10 additional leases executed where rent commences over
time in 2023 totaling approximately 122,200 square feet.
FFO: We define FFO, a non-GAAP measure, consistent with the standards established over time by the Board of Governors of NAREIT, as restated in a White Paper and approved by the Board of Governors of NAREIT effective in December 2018 (the "White Paper"). The White Paper defines FFO as net income
or loss computed in accordance with GAAP excluding depreciation and amortization related to real estate, gains and losses from sales of certain real estate assets, gains and losses from change in control and impairment write-downs of certain real estate assets and investments in entities when the impairment is
directly attributable to decreases in the value of depreciable real estate held by the entity. Adjustments for consolidated partially-owned entities (including our OP) and equity in earnings of unconsolidated affiliates are made to arrive at our proportionate share of FFO attributable to our stockholders. Our FFO
calculation complies with NAREIT's definition.
Gross Asset Value: Total gross asset value of $5.1 billion, comprised of total assets of $4.3 billion plus accumulated depreciation and amortization of $0.8 billion as of June 30, 2023.
Investment Grade: As used herein, Investment Grade includes both actual investment grade ratings of the tenant or guarantor, if available, or implied investment grade. Implied investment grade may include actual ratings of tenant parent, guarantor parent (regardless of whether or not the parent has guaranteed
the tenant’s obligation under the lease) or by using a proprietary Moody’s analytical tool, which generates an implied rating by measuring a company’s probability of default. The term “parent" for these purposes includes any entity, including any governmental entity, owning more than 50% of the voting stock in a
tenant. Ratings information is as of June 30, 2023 and based on Annualized Straight-Line Rent.
Leasing Pipeline: Leasing Pipeline includes (i) all leases fully executed by both parties as of July 31, 2023, but after June 30, 2023, and (ii) all leases under negotiation with an executed LOI by both parties as of July 31, 2023. In our multi-tenant portfolio, this represents 9 leases totaling approximately 183,500 square
feet and 23 LOIs totaling approximately 286,400 square feet, net of 6 terminations totaling 129,000 square feet. Leasing pipeline should not be considered an indication of future performance.
Liquidity: As of June 30, 2023, the Company had $59.2 million in cash and cash equivalents, and $42.3 million available for future borrowings under the Company's credit facility.
LOI: Means a non-binding letter of intent.
Necessity-Based: We define Necessity-Based as properties that are leased to tenants that operate in what we believe to be service-based or essential industries such as auto services, distribution, financial services, gas/convenience, grocery, healthcare, and quick service restaurants, among others.
Net Debt: For Q2’2023, represents total debt of $2.7 billion less cash and cash equivalents of $59.2 million as of June 30, 2023. For Q2’2022, represents total debt of $2.8 billion less cash and cash equivalents of $69.4 million as of June 30, 2022.
NOI: Defined as a non-GAAP financial measure used by us to evaluate the operating performance of our real estate. NOI is equal to total revenues, excluding contingent purchase price consideration, less property operating and maintenance expense. NOI excludes all other items of expense and income included in
the financial statements in calculating net (loss).
Occupancy: Represents percentage of square footage of which the tenant has taken possession of divided by the respective total rentable square feet as of the date or period end indicated.
PSA: Means a definitive purchase and sale agreement.
Remaining Lease Term: Represents the outstanding tenant lease term. Weighted based on Annualized Straight-Line Rent as of the date or period end indicated.
Traditional Retail: RTL’s definition of Traditional Retail includes retail properties leased to tenants in the auto retail, department store, discount retail, electronics, furniture, home improvement, home furnishing, specialty retail, and sporting good sectors. |
| The Necessity Retail REIT 17 ® Where America Shops | www.necessityretailreit.com
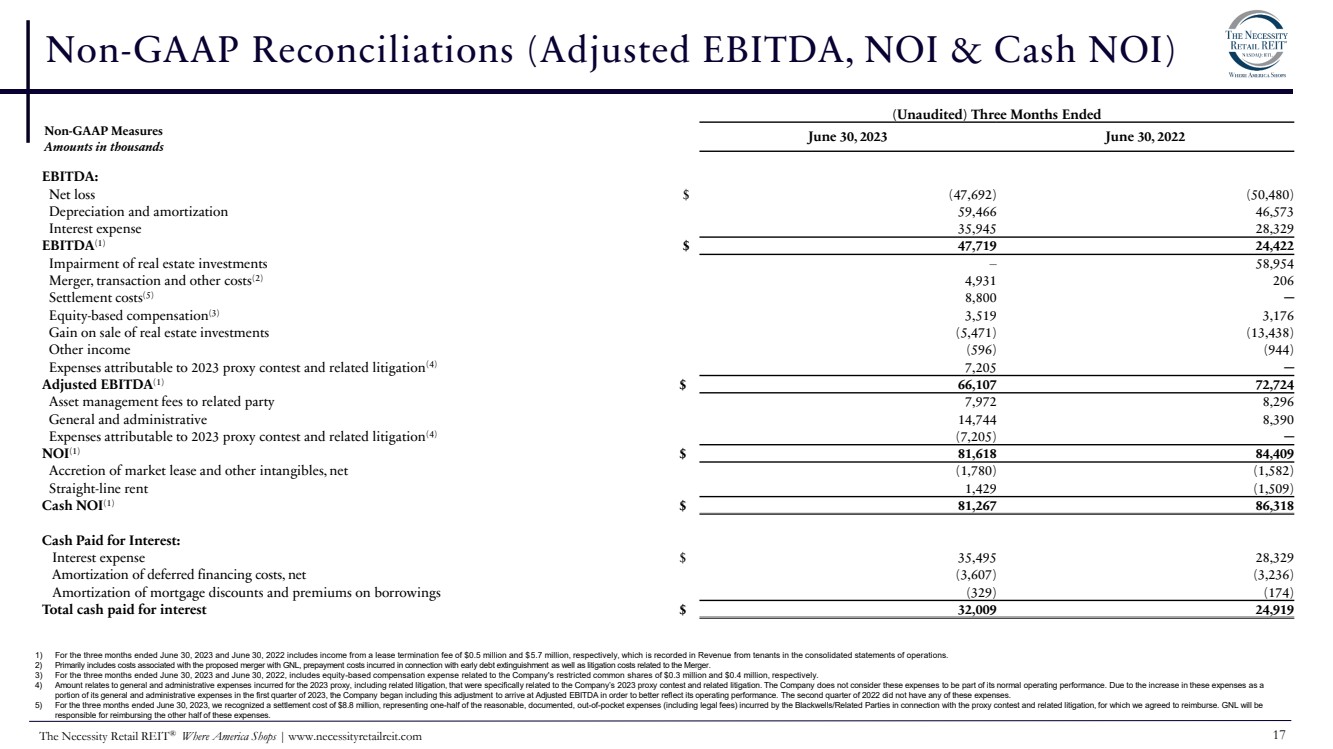
Non-GAAP Reconciliations (Adjusted EBITDA, NOI & Cash NOI)
(Unaudited) Three Months Ended
June 30, 2023 June 30, 2022
EBITDA:
Net loss $ (47,692) (50,480)
Depreciation and amortization 59,466 46,573
Interest expense 35,945 28,329
EBITDA(1) $ 47,719 24,422
Impairment of real estate investments – 58,954
Merger, transaction and other costs(2) 4,931 206
Settlement costs(5) 8,800 ─
Equity-based compensation(3) 3,519 3,176
Gain on sale of real estate investments (5,471) (13,438)
Other income (596) (944)
Expenses attributable to 2023 proxy contest and related litigation(4) 7,205 ─
Adjusted EBITDA(1) $ 66,107 72,724
Asset management fees to related party 7,972 8,296
General and administrative 14,744 8,390
Expenses attributable to 2023 proxy contest and related litigation(4) (7,205) ─
NOI(1) $ 81,618 84,409
Accretion of market lease and other intangibles, net (1,780) (1,582)
Straight-line rent 1,429 (1,509)
Cash NOI(1) $ 81,267 86,318
Cash Paid for Interest:
Interest expense $ 35,495 28,329
Amortization of deferred financing costs, net (3,607) (3,236)
Amortization of mortgage discounts and premiums on borrowings (329) (174)
Total cash paid for interest $ 32,009 24,919
Non-GAAP Measures
Amounts in thousands
1) For the three months ended June 30, 2023 and June 30, 2022 includes income from a lease termination fee of $0.5 million and $5.7 million, respectively, which is recorded in Revenue from tenants in the consolidated statements of operations.
2) Primarily includes costs associated with the proposed merger with GNL, prepayment costs incurred in connection with early debt extinguishment as well as litigation costs related to the Merger.
3) For the three months ended June 30, 2023 and June 30, 2022, includes equity-based compensation expense related to the Company's restricted common shares of $0.3 million and $0.4 million, respectively.
4) Amount relates to general and administrative expenses incurred for the 2023 proxy, including related litigation, that were specifically related to the Company’s 2023 proxy contest and related litigation. The Company does not consider these expenses to be part of its normal operating performance. Due to the increase in these expenses as a
portion of its general and administrative expenses in the first quarter of 2023, the Company began including this adjustment to arrive at Adjusted EBITDA in order to better reflect its operating performance. The second quarter of 2022 did not have any of these expenses.
5) For the three months ended June 30, 2023, we recognized a settlement cost of $8.8 million, representing one-half of the reasonable, documented, out-of-pocket expenses (including legal fees) incurred by the Blackwells/Related Parties in connection with the proxy contest and related litigation, for which we agreed to reimburse. GNL will be
responsible for reimbursing the other half of these expenses. |
| The Necessity Retail REIT 18 ® Where America Shops | www.necessityretailreit.com
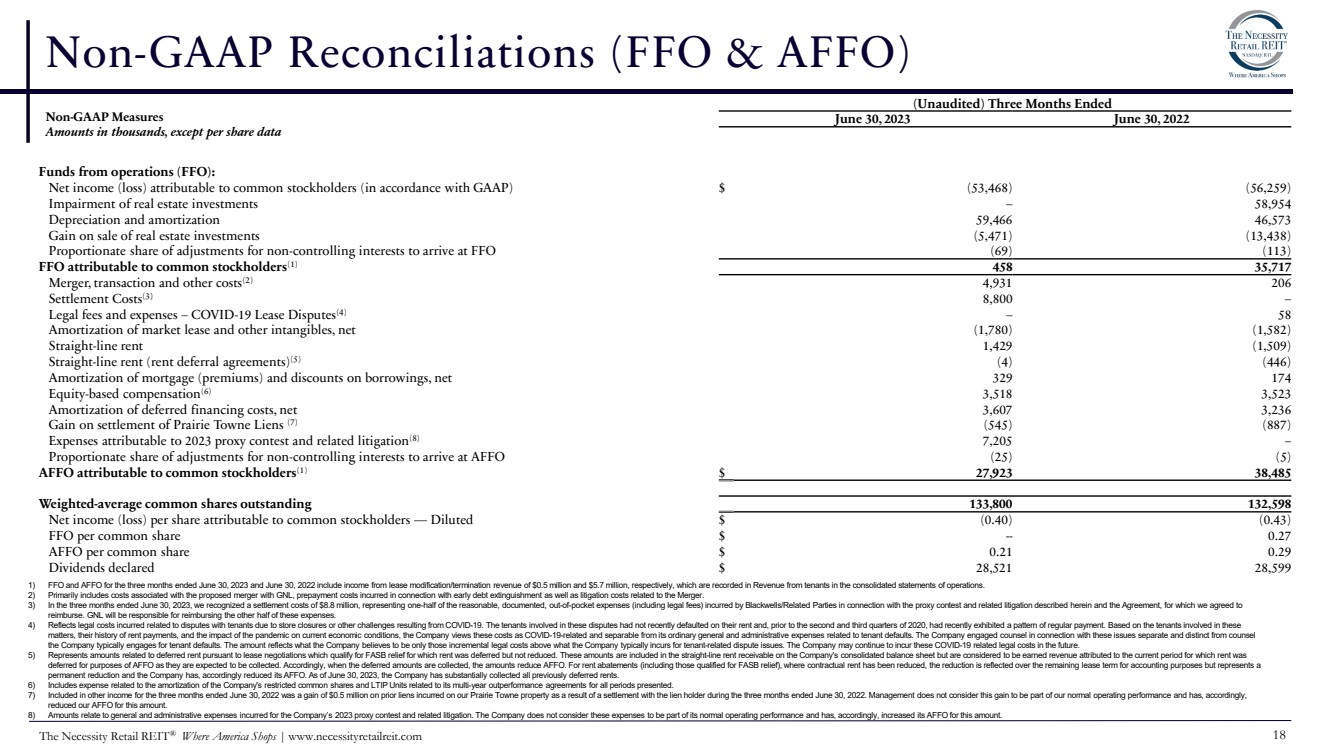
Non-GAAP Reconciliations (FFO & AFFO)
Non-GAAP Measures
Amounts in thousands, except per share data
(Unaudited) Three Months Ended
June 30, 2023 June 30, 2022
Funds from operations (FFO):
Net income (loss) attributable to common stockholders (in accordance with GAAP) $ (53,468) (56,259)
Impairment of real estate investments – 58,954
Depreciation and amortization 59,466 46,573
Gain on sale of real estate investments (5,471) (13,438)
Proportionate share of adjustments for non-controlling interests to arrive at FFO (69) (113)
FFO attributable to common stockholders(1) 458 35,717
Merger, transaction and other costs(2) 4,931 206
Settlement Costs(3) 8,800 –
Legal fees and expenses – COVID-19 Lease Disputes(4) – 58
Amortization of market lease and other intangibles, net (1,780) (1,582)
Straight-line rent 1,429 (1,509)
Straight-line rent (rent deferral agreements)(5) (4) (446)
Amortization of mortgage (premiums) and discounts on borrowings, net 329 174
Equity-based compensation(6) 3,518 3,523
Amortization of deferred financing costs, net 3,607 3,236
Gain on settlement of Prairie Towne Liens (7) (545) (887)
Expenses attributable to 2023 proxy contest and related litigation(8) 7,205 –
Proportionate share of adjustments for non-controlling interests to arrive at AFFO (25) (5)
AFFO attributable to common stockholders(1) $ 27,923 38,485
Weighted-average common shares outstanding 133,800 132,598
Net income (loss) per share attributable to common stockholders — Diluted $ (0.40) (0.43)
FFO per common share $ -- 0.27
AFFO per common share $ 0.21 0.29
Dividends declared $ 28,521 28,599
1) FFO and AFFO for the three months ended June 30, 2023 and June 30, 2022 include income from lease modification/termination revenue of $0.5 million and $5.7 million, respectively, which are recorded in Revenue from tenants in the consolidated statements of operations.
2) Primarily includes costs associated with the proposed merger with GNL, prepayment costs incurred in connection with early debt extinguishment as well as litigation costs related to the Merger.
3) In the three months ended June 30, 2023, we recognized a settlement costs of $8.8 million, representing one-half of the reasonable, documented, out-of-pocket expenses (including legal fees) incurred by Blackwells/Related Parties in connection with the proxy contest and related litigation described herein and the Agreement, for which we agreed to
reimburse. GNL will be responsible for reimbursing the other half of these expenses.
4) Reflects legal costs incurred related to disputes with tenants due to store closures or other challenges resulting from COVID-19. The tenants involved in these disputes had not recently defaulted on their rent and, prior to the second and third quarters of 2020, had recently exhibited a pattern of regular payment. Based on the tenants involved in these
matters, their history of rent payments, and the impact of the pandemic on current economic conditions, the Company views these costs as COVID-19-related and separable from its ordinary general and administrative expenses related to tenant defaults. The Company engaged counsel in connection with these issues separate and distinct from counsel
the Company typically engages for tenant defaults. The amount reflects what the Company believes to be only those incremental legal costs above what the Company typically incurs for tenant-related dispute issues. The Company may continue to incur these COVID-19 related legal costs in the future.
5) Represents amounts related to deferred rent pursuant to lease negotiations which qualify for FASB relief for which rent was deferred but not reduced. These amounts are included in the straight-line rent receivable on the Company's consolidated balance sheet but are considered to be earned revenue attributed to the current period for which rent was
deferred for purposes of AFFO as they are expected to be collected. Accordingly, when the deferred amounts are collected, the amounts reduce AFFO. For rent abatements (including those qualified for FASB relief), where contractual rent has been reduced, the reduction is reflected over the remaining lease term for accounting purposes but represents a
permanent reduction and the Company has, accordingly reduced its AFFO. As of June 30, 2023, the Company has substantially collected all previously deferred rents.
6) Includes expense related to the amortization of the Company's restricted common shares and LTIP Units related to its multi-year outperformance agreements for all periods presented.
7) Included in other income for the three months ended June 30, 2022 was a gain of $0.5 million on prior liens incurred on our Prairie Towne property as a result of a settlement with the lien holder during the three months ended June 30, 2022. Management does not consider this gain to be part of our normal operating performance and has, accordingly,
reduced our AFFO for this amount.
8) Amounts relate to general and administrative expenses incurred for the Company’s 2023 proxy contest and related litigation. The Company does not consider these expenses to be part of its normal operating performance and has, accordingly, increased its AFFO for this amount. |
Cover
|
Aug. 02, 2023 |
| Document Information [Line Items] |
|
| Document Type |
8-K
|
| Amendment Flag |
false
|
| Document Period End Date |
Aug. 02, 2023
|
| Entity File Number |
001-38597
|
| Entity Registrant Name |
The Necessity Retail REIT, Inc.
|
| Entity Central Index Key |
0001568162
|
| Entity Tax Identification Number |
90-0929989
|
| Entity Incorporation, State or Country Code |
MD
|
| Entity Address, Address Line One |
650 Fifth Avenue
|
| Entity Address, Address Line Two |
30th Floor
|
| Entity Address, City or Town |
New York
|
| Entity Address, State or Province |
NY
|
| Entity Address, Postal Zip Code |
10019
|
| City Area Code |
212
|
| Local Phone Number |
415-6500
|
| Written Communications |
false
|
| Soliciting Material |
false
|
| Pre-commencement Tender Offer |
false
|
| Pre-commencement Issuer Tender Offer |
false
|
| Entity Emerging Growth Company |
false
|
| Common Stock [Member] |
|
| Document Information [Line Items] |
|
| Title of 12(b) Security |
Class
A Common Stock, $0.01 par value per share
|
| Trading Symbol |
RTL
|
| Security Exchange Name |
NASDAQ
|
| Series A Preferred Stock [Member] |
|
| Document Information [Line Items] |
|
| Title of 12(b) Security |
7.50% Series A Cumulative Redeemable
Perpetual Preferred Stock, $0.01 par value per share
|
| Trading Symbol |
RTLPP
|
| Security Exchange Name |
NASDAQ
|
| Series C Preferred Stock [Member] |
|
| Document Information [Line Items] |
|
| Title of 12(b) Security |
7.375% Series C Cumulative Redeemable Perpetual Preferred Stock, $0.01 par value per share
|
| Trading Symbol |
RTLPO
|
| Security Exchange Name |
NASDAQ
|
| Preferred Stock Purchase Rights [Member] |
|
| Document Information [Line Items] |
|
| Title of 12(b) Security |
Preferred Stock Purchase Rights
|
| No Trading Symbol Flag |
true
|
| Security Exchange Name |
NASDAQ
|
| X |
- DefinitionBoolean flag that is true when the XBRL content amends previously-filed or accepted submission.
| Name: |
dei_AmendmentFlag |
| Namespace Prefix: |
dei_ |
| Data Type: |
xbrli:booleanItemType |
| Balance Type: |
na |
| Period Type: |
duration |
|
| X |
- DefinitionFor the EDGAR submission types of Form 8-K: the date of the report, the date of the earliest event reported; for the EDGAR submission types of Form N-1A: the filing date; for all other submission types: the end of the reporting or transition period. The format of the date is YYYY-MM-DD.
| Name: |
dei_DocumentPeriodEndDate |
| Namespace Prefix: |
dei_ |
| Data Type: |
xbrli:dateItemType |
| Balance Type: |
na |
| Period Type: |
duration |
|
| X |
- DefinitionThe type of document being provided (such as 10-K, 10-Q, 485BPOS, etc). The document type is limited to the same value as the supporting SEC submission type, or the word 'Other'.
| Name: |
dei_DocumentType |
| Namespace Prefix: |
dei_ |
| Data Type: |
dei:submissionTypeItemType |
| Balance Type: |
na |
| Period Type: |
duration |
|
| X |
- DefinitionAddress Line 1 such as Attn, Building Name, Street Name
| Name: |
dei_EntityAddressAddressLine1 |
| Namespace Prefix: |
dei_ |
| Data Type: |
xbrli:normalizedStringItemType |
| Balance Type: |
na |
| Period Type: |
duration |
|
| X |
- DefinitionAddress Line 2 such as Street or Suite number
| Name: |
dei_EntityAddressAddressLine2 |
| Namespace Prefix: |
dei_ |
| Data Type: |
xbrli:normalizedStringItemType |
| Balance Type: |
na |
| Period Type: |
duration |
|
| X |
- Definition
+ References
+ Details
| Name: |
dei_EntityAddressCityOrTown |
| Namespace Prefix: |
dei_ |
| Data Type: |
xbrli:normalizedStringItemType |
| Balance Type: |
na |
| Period Type: |
duration |
|
| X |
- DefinitionCode for the postal or zip code
| Name: |
dei_EntityAddressPostalZipCode |
| Namespace Prefix: |
dei_ |
| Data Type: |
xbrli:normalizedStringItemType |
| Balance Type: |
na |
| Period Type: |
duration |
|
| X |
- DefinitionName of the state or province.
| Name: |
dei_EntityAddressStateOrProvince |
| Namespace Prefix: |
dei_ |
| Data Type: |
dei:stateOrProvinceItemType |
| Balance Type: |
na |
| Period Type: |
duration |
|
| X |
- DefinitionA unique 10-digit SEC-issued value to identify entities that have filed disclosures with the SEC. It is commonly abbreviated as CIK. Reference 1: http://www.xbrl.org/2003/role/presentationRef
-Publisher SEC
-Name Exchange Act
-Number 240
-Section 12
-Subsection b-2
| Name: |
dei_EntityCentralIndexKey |
| Namespace Prefix: |
dei_ |
| Data Type: |
dei:centralIndexKeyItemType |
| Balance Type: |
na |
| Period Type: |
duration |
|
| X |
- DefinitionIndicate if registrant meets the emerging growth company criteria. Reference 1: http://www.xbrl.org/2003/role/presentationRef
-Publisher SEC
-Name Exchange Act
-Number 240
-Section 12
-Subsection b-2
| Name: |
dei_EntityEmergingGrowthCompany |
| Namespace Prefix: |
dei_ |
| Data Type: |
xbrli:booleanItemType |
| Balance Type: |
na |
| Period Type: |
duration |
|
| X |
- DefinitionCommission file number. The field allows up to 17 characters. The prefix may contain 1-3 digits, the sequence number may contain 1-8 digits, the optional suffix may contain 1-4 characters, and the fields are separated with a hyphen.
| Name: |
dei_EntityFileNumber |
| Namespace Prefix: |
dei_ |
| Data Type: |
dei:fileNumberItemType |
| Balance Type: |
na |
| Period Type: |
duration |
|
| X |
- DefinitionTwo-character EDGAR code representing the state or country of incorporation.
| Name: |
dei_EntityIncorporationStateCountryCode |
| Namespace Prefix: |
dei_ |
| Data Type: |
dei:edgarStateCountryItemType |
| Balance Type: |
na |
| Period Type: |
duration |
|
| X |
- DefinitionThe exact name of the entity filing the report as specified in its charter, which is required by forms filed with the SEC. Reference 1: http://www.xbrl.org/2003/role/presentationRef
-Publisher SEC
-Name Exchange Act
-Number 240
-Section 12
-Subsection b-2
| Name: |
dei_EntityRegistrantName |
| Namespace Prefix: |
dei_ |
| Data Type: |
xbrli:normalizedStringItemType |
| Balance Type: |
na |
| Period Type: |
duration |
|
| X |
- DefinitionThe Tax Identification Number (TIN), also known as an Employer Identification Number (EIN), is a unique 9-digit value assigned by the IRS. Reference 1: http://www.xbrl.org/2003/role/presentationRef
-Publisher SEC
-Name Exchange Act
-Number 240
-Section 12
-Subsection b-2
| Name: |
dei_EntityTaxIdentificationNumber |
| Namespace Prefix: |
dei_ |
| Data Type: |
dei:employerIdItemType |
| Balance Type: |
na |
| Period Type: |
duration |
|
| X |
- DefinitionLocal phone number for entity.
| Name: |
dei_LocalPhoneNumber |
| Namespace Prefix: |
dei_ |
| Data Type: |
xbrli:normalizedStringItemType |
| Balance Type: |
na |
| Period Type: |
duration |
|
| X |
- DefinitionBoolean flag that is true only for a security having no trading symbol.
| Name: |
dei_NoTradingSymbolFlag |
| Namespace Prefix: |
dei_ |
| Data Type: |
dei:trueItemType |
| Balance Type: |
na |
| Period Type: |
duration |
|
| X |
- DefinitionBoolean flag that is true when the Form 8-K filing is intended to satisfy the filing obligation of the registrant as pre-commencement communications pursuant to Rule 13e-4(c) under the Exchange Act. Reference 1: http://www.xbrl.org/2003/role/presentationRef
-Publisher SEC
-Name Exchange Act
-Number 240
-Section 13e
-Subsection 4c
| Name: |
dei_PreCommencementIssuerTenderOffer |
| Namespace Prefix: |
dei_ |
| Data Type: |
xbrli:booleanItemType |
| Balance Type: |
na |
| Period Type: |
duration |
|
| X |
- DefinitionBoolean flag that is true when the Form 8-K filing is intended to satisfy the filing obligation of the registrant as pre-commencement communications pursuant to Rule 14d-2(b) under the Exchange Act. Reference 1: http://www.xbrl.org/2003/role/presentationRef
-Publisher SEC
-Name Exchange Act
-Number 240
-Section 14d
-Subsection 2b
| Name: |
dei_PreCommencementTenderOffer |
| Namespace Prefix: |
dei_ |
| Data Type: |
xbrli:booleanItemType |
| Balance Type: |
na |
| Period Type: |
duration |
|
| X |
- DefinitionTitle of a 12(b) registered security. Reference 1: http://www.xbrl.org/2003/role/presentationRef
-Publisher SEC
-Name Exchange Act
-Number 240
-Section 12
-Subsection b
| Name: |
dei_Security12bTitle |
| Namespace Prefix: |
dei_ |
| Data Type: |
dei:securityTitleItemType |
| Balance Type: |
na |
| Period Type: |
duration |
|
| X |
- DefinitionName of the Exchange on which a security is registered. Reference 1: http://www.xbrl.org/2003/role/presentationRef
-Publisher SEC
-Name Exchange Act
-Number 240
-Section 12
-Subsection d1-1
| Name: |
dei_SecurityExchangeName |
| Namespace Prefix: |
dei_ |
| Data Type: |
dei:edgarExchangeCodeItemType |
| Balance Type: |
na |
| Period Type: |
duration |
|
| X |
- DefinitionBoolean flag that is true when the Form 8-K filing is intended to satisfy the filing obligation of the registrant as soliciting material pursuant to Rule 14a-12 under the Exchange Act. Reference 1: http://www.xbrl.org/2003/role/presentationRef
-Publisher SEC
-Name Exchange Act
-Section 14a
-Number 240
-Subsection 12
| Name: |
dei_SolicitingMaterial |
| Namespace Prefix: |
dei_ |
| Data Type: |
xbrli:booleanItemType |
| Balance Type: |
na |
| Period Type: |
duration |
|
| X |
- DefinitionTrading symbol of an instrument as listed on an exchange.
| Name: |
dei_TradingSymbol |
| Namespace Prefix: |
dei_ |
| Data Type: |
dei:tradingSymbolItemType |
| Balance Type: |
na |
| Period Type: |
duration |
|
| X |
- DefinitionBoolean flag that is true when the Form 8-K filing is intended to satisfy the filing obligation of the registrant as written communications pursuant to Rule 425 under the Securities Act. Reference 1: http://www.xbrl.org/2003/role/presentationRef
-Publisher SEC
-Name Securities Act
-Number 230
-Section 425
| Name: |
dei_WrittenCommunications |
| Namespace Prefix: |
dei_ |
| Data Type: |
xbrli:booleanItemType |
| Balance Type: |
na |
| Period Type: |
duration |
|
| X |
- Details
| Name: |
us-gaap_StatementClassOfStockAxis=us-gaap_CommonStockMember |
| Namespace Prefix: |
|
| Data Type: |
na |
| Balance Type: |
|
| Period Type: |
|
|
| X |
- Details
| Name: |
us-gaap_StatementClassOfStockAxis=us-gaap_SeriesAPreferredStockMember |
| Namespace Prefix: |
|
| Data Type: |
na |
| Balance Type: |
|
| Period Type: |
|
|
| X |
- Details
| Name: |
us-gaap_StatementClassOfStockAxis=us-gaap_SeriesCPreferredStockMember |
| Namespace Prefix: |
|
| Data Type: |
na |
| Balance Type: |
|
| Period Type: |
|
|
| X |
- Details
| Name: |
us-gaap_StatementClassOfStockAxis=RTL_PreferredStockPurchaseRightsMember |
| Namespace Prefix: |
|
| Data Type: |
na |
| Balance Type: |
|
| Period Type: |
|
|
Grafico Azioni Necessity Retail REIT (NASDAQ:RTLPP)
Storico
Da Apr 2024 a Mag 2024

Grafico Azioni Necessity Retail REIT (NASDAQ:RTLPP)
Storico
Da Mag 2023 a Mag 2024
