PA PA false 0000820318 0000820318 2024-05-06 2024-05-06
UNITED STATES
SECURITIES AND EXCHANGE COMMISSION
Washington, D.C. 20549
FORM 8-K
CURRENT REPORT
Pursuant to Section 13 or 15(d)
of the Securities Exchange Act of 1934
Date of Report (Date of earliest event reported): May 6, 2024
Coherent Corp.
(Exact name of registrant as specified in its charter)
|
|
|
|
|
| PENNSYLVANIA |
|
001-39375 |
|
25-1214948 |
(State or Other Jurisdiction
of Incorporation) |
|
(Commission File Number) |
|
(I.R.S. Employer
Identification No.) |
375 Saxonburg Boulevard
Saxonburg, PENNSYLVANIA 16056
(Address of Principal Executive Offices) (Zip Code)
(724) 352-4455
(Registrant’s telephone number, including area code)
Not Applicable
(Former name or former address, if changed since last report)
Check the appropriate box below if the Form 8-K filing is intended to simultaneously satisfy the filing obligation of the registrant under any of the following provisions:
| ☐ |
Written communications pursuant to Rule 425 under the Securities Act (17 CFR 230.425) |
| ☐ |
Soliciting material pursuant to Rule 14a-12 under the Exchange Act (17 CFR 240.14a-12) |
| ☐ |
Pre-commencement communications pursuant to Rule 14d-2(b) under the Exchange Act (17 CFR 240.14d-2(b)) |
| ☐ |
Pre-commencement communications pursuant to Rule 13e-4(c) under the Exchange Act (17 CFR 240.13e-4(c)) |
Securities registered pursuant to Section 12(b) of the Act:
|
|
|
|
|
| Title of each class |
|
Trading
Symbol(s) |
|
Name of each exchange on which registered |
| Common Stock, no par value |
|
COHR |
|
New York Stock Exchange |
Indicate by check mark whether the registrant is an emerging growth company as defined in Rule 405 of the Securities Act of 1933 (§230.405 of this chapter) or Rule 12b-2 of the Securities Exchange Act of 1934 (§240.12b-2 of this chapter).
Emerging growth company ☐
If an emerging growth company, indicate by check mark if the registrant has elected not to use the extended transition period for complying with any new or revised financial accounting standards provided pursuant to Section 13(a) of the Exchange Act. ☐
| Item 2.02. |
Results of Operations and Financial Condition. |
On May 6, 2024 Coherent Corp. (the “Company”) issued a press release (“Press Release”) announcing it will publicly disseminate a shareholder letter (the “Shareholder Letter”) with its financial results for the quarter ended March 31, 2024 (the “financial results”) and that it will be holding an earnings call webcast (the “Earnings Call”) on May 7, 2024 at 8:00 a.m. Eastern Time to discuss the financial results. The Company is making reference to non-GAAP financial information in the Shareholder Letter and on the Earnings Call. A reconciliation of GAAP to non-GAAP financial measures is provided in the Shareholder Letter.
A copy of the Press Release and the Shareholder Letter are furnished as Exhibits 99.1 and 99.2, respectively, and are incorporated herein by reference.
| Item 7.01. |
Regulation FD Disclosure. |
A slide presentation to be used by senior management of the Company in connection its discussions with investors and others regarding the financial results is furnished as Exhibit 99.3.
The information in this Current Report on Form 8-K, including the exhibits furnished pursuant to Item 9.01, shall not be deemed “filed” for the purposes of Section 18 of the Securities Exchange Act of 1934 or otherwise subject to the liabilities under that Section. Furthermore, the information in this Item 2.02 of this Current Report on Form 8-K, including the exhibits furnished pursuant to Item 9.01, shall not be deemed to be incorporated by reference into the filings of the Company under the Securities Act of 1933.
| Item 9.01 |
Financial Statements and Exhibits. |
SIGNATURE
Pursuant to the requirements of the Securities Exchange Act of 1934, the registrant has duly caused this report to be signed on its behalf by the undersigned hereunto duly authorized.
|
|
|
|
|
|
|
|
|
|
|
Coherent Corp. |
|
|
|
|
| Date: May 6, 2024 |
|
|
|
By: |
|
/s/ Richard Martucci |
|
|
|
|
|
|
Richard Martucci |
|
|
|
|
|
|
Interim Chief Financial Officer and Treasurer |
Exhibit 99.1
|
|
|

|
|
Coherent Corp.
375 Saxonburg Blvd.
Saxonburg, PA 16056-9499 |
PRESS RELEASE
COHERENT CORP. RELEASES THIRD-QUARTER FISCAL YEAR 2024 FINANCIAL RESULTS
PITTSBURGH, May 6, 2024 (GLOBE NEWSWIRE) – Coherent Corp. (NYSE: COHR), a global leader in materials, networking, and lasers, announced today the
financial results for its third quarter of fiscal year 2024. These results have been posted as a letter to shareholders on the Investor Relations section of its website at coherent.com/company/investor-relations.
A conference call to discuss these results with Chair and CEO Dr. Vincent D. (Chuck) Mattera, Jr., and members of the management team will be held
on Tuesday, May 7, 2024, at 8:00 a.m. ET. Individuals wishing to listen to the live webcast of the call can access the event at the company’s website by visiting coherent.com/company/investor-relations. The call will be recorded,
and a replay will be available for a limited time.
The shareholder letter sets forth detailed financial information and disclosures for the company and
is designed to provide greater insight into the company’s operating performance and outlook in advance of the earnings call. This format allows more time for questions and answers on the earnings call.
About Coherent
Coherent empowers market
innovators to define the future through breakthrough technologies, from materials to systems. We deliver innovations that resonate with our customers in diversified applications for the industrial, communications, electronics, and instrumentation
markets. Headquartered in Saxonburg, Pennsylvania, Coherent has research and development, manufacturing, sales, service, and distribution facilities worldwide. For more information, please visit us at coherent.com.
Contact
Paul Silverstein
Vice President, Investor Relations & Corporate Communications
investor.relations@coherent.com
# # #
|
|
|
| coherent.com | T. 724 352 4455 |
|
1 |
Exhibit 99.2
|
|
|
|
|
|
|
|
|
|
Coherent Corp. 375 Saxonburg Blvd.
Saxonburg, PA 16056-9499 USA |
SHAREHOLDER LETTER – MAY 6, 2024
Related Information. The following commentary is provided to give investors and analysts further insight into the Company’s performance in advance
of the earnings call webcast. Please note the “Forward-Looking Statements” information at the end of this letter.
Fellow Coherent
Shareholders,
We are pleased to present our Coherent Corp. Shareholder Letter setting forth an overview of our Third Quarter Fiscal Year 2024 results.
Coherent was founded in 1971 to manufacture high-quality materials and optics for industrial lasers. Today, Coherent is a global leader in materials,
networking, and lasers, operating in more than 20 countries around the world. We empower market innovators to define the future through breakthrough technologies, from materials to systems, that fuel market megatrends while pursuing our mission of
enabling the world to be safer, healthier, closer, and more efficient.
We remain focused on providing industry-leading
foundational materials, networking, and laser innovations for the industrial, communications, electronics, and instrumentation markets that enable better performance and greater efficiency of our customers’ solutions. Steadfast in pursuit of
our goal to invest, manage, and position Coherent for continued growth while succeeding in the exciting markets we are targeting, we are leveraging our unique set of differentiated assets including:
| |
◾ |
Unparalleled experience in materials, photonics, and lasers; |
| |
◾ |
A vertically integrated, geographically diverse organization with scalable manufacturing platforms;
|
| |
◾ |
A history of insightful targeting and successful integration of strategic acquisitions; |
| |
◾ |
A sustained and committed track record of targeted research and development and capital expenditures to prepare
for the opportunities that lie ahead; and |
| |
◾ |
Worldwide talented and experienced teams of engineers and technologists, including over 2,000 people employed
in R&D, as well as expert manufacturing teams, and experienced business leaders. |
We continue to invest in our core assets,
including our people, while undertaking strategic moves to enhance our market opportunities and returns on invested capital; at the same time, we are proactively executing on opportunities to enhance our operating performance.
As previously announced, the Board of Directors is conducting a comprehensive process to select the fourth CEO in Coherent’s 53-year history. That process is ongoing.
We believe that the combination of our sustained efforts to transform the
Company while focusing relentlessly on targeted markets, customer intimacy, product leadership, and operational excellence will lead to enhanced operating performance and will drive long-term shareholder value. We are taking the short-term
challenges head-on, and we have made some bold moves that are characteristic of a sustainable market leader. When we look past the horizon, we remain excited and optimistic about our future.
1
Table 1
Financial Metrics
|
|
|
|
|
|
|
|
|
|
|
|
|
|
|
|
|
|
|
|
|
| |
|
THREE MONTHS ENDED |
|
|
NINE MONTHS ENDED |
|
| $ Millions, except per share and percentage amounts
(unaudited) |
|
Mar 31
2024 |
|
|
Dec 31
2023 |
|
|
Mar 31
2023 |
|
|
Mar 31
2024 |
|
|
Mar 31
2023 |
|
|
|
|
|
|
|
|
|
|
|
|
|
|
|
|
|
|
|
|
|
|
| Revenues |
|
$ |
1,208.8 |
|
|
$ |
1,131.4 |
|
|
$ |
1,240.2 |
|
|
$ |
3,393.3 |
|
|
$ |
3,955.0 |
|
|
|
|
|
|
|
|
|
|
|
|
|
|
|
|
|
|
|
|
|
|
| GAAP Gross Profit |
|
$ |
366.5 |
|
|
$ |
350.6 |
|
|
$ |
420.2 |
|
|
$ |
1,024.0 |
|
|
$ |
1,274.9 |
|
| Non-GAAP Gross Profit(1) |
|
$ |
432.6 |
|
|
$ |
407.7 |
|
|
$ |
463.2 |
|
|
$ |
1,206.7 |
|
|
$ |
1,551.2 |
|
|
|
|
|
|
|
|
|
|
|
|
|
|
|
|
|
|
|
|
|
|
| GAAP Operating Income(2) |
|
$ |
22.3 |
|
|
$ |
31.9 |
|
|
$ |
67.4 |
|
|
$ |
32.9 |
|
|
$ |
118.1 |
|
| Non-GAAP Operating Income(1) |
|
$ |
182.2 |
|
|
$ |
171.6 |
|
|
$ |
217.1 |
|
|
$ |
486.2 |
|
|
$ |
781.3 |
|
|
|
|
|
|
|
|
|
|
|
|
|
|
|
|
|
|
|
|
|
|
| GAAP Net Earnings (Loss) Attributable to Coherent Corp. |
|
$ |
(13.2 |
) |
|
$ |
(27.0 |
) |
|
$ |
2.5 |
|
|
$ |
(107.7 |
) |
|
$ |
(81.2 |
) |
| Non-GAAP Net Earnings Attributable to Coherent Corp(1) |
|
$ |
113.2 |
|
|
$ |
86.4 |
|
|
$ |
117.6 |
|
|
$ |
254.5 |
|
|
$ |
472.6 |
|
|
|
|
|
|
|
|
|
|
|
|
|
|
|
|
|
|
|
|
|
|
| GAAP Diluted Loss Per Share |
|
$ |
(0.29 |
) |
|
$ |
(0.38 |
) |
|
$ |
(0.24 |
) |
|
$ |
(1.32 |
) |
|
$ |
(1.38 |
) |
| Non-GAAP Diluted Earnings Per Share(1) |
|
$ |
0.53 |
|
|
$ |
0.36 |
|
|
$ |
0.58 |
|
|
$ |
1.06 |
|
|
$ |
2.57 |
|
|
|
|
|
|
|
|
|
|
|
|
|
|
|
|
|
|
|
|
|
|
| Other Selected Financial Metrics |
|
|
|
|
|
|
|
|
|
|
|
|
|
|
|
|
|
|
|
|
| GAAP gross margin |
|
|
30.3 |
% |
|
|
31.0 |
% |
|
|
33.9 |
% |
|
|
30.2 |
% |
|
|
32.2 |
% |
| Non-GAAP gross margin(1) |
|
|
35.8 |
% |
|
|
36.0 |
% |
|
|
37.3 |
% |
|
|
35.6 |
% |
|
|
39.2 |
% |
| GAAP operating margin |
|
|
1.8 |
% |
|
|
2.8 |
% |
|
|
5.4 |
% |
|
|
1.0 |
% |
|
|
3.0 |
% |
| Non-GAAP operating margin(1) |
|
|
15.1 |
% |
|
|
15.2 |
% |
|
|
17.5 |
% |
|
|
14.3 |
% |
|
|
19.8 |
% |
| GAAP return on sales |
|
|
(1.1 |
)% |
|
|
(2.4 |
)% |
|
|
0.2 |
% |
|
|
(3.2 |
)% |
|
|
(2.1 |
)% |
| Non-GAAP return on sales(1) |
|
|
9.4 |
% |
|
|
7.6 |
% |
|
|
9.5 |
% |
|
|
7.5 |
% |
|
|
11.9 |
% |
|
|
|
|
|
|
|
|
|
|
|
|
|
|
|
|
|
|
|
|
|
| (1) |
The Company has disclosed financial measurements in this letter to shareholders that present financial
information considered to be non-GAAP financial measures. These measurements are not a substitute for GAAP measurements, although the Company’s management uses these measurements as an aid in monitoring
the Company’s on-going financial performance. The non-GAAP net earnings attributable to Coherent Corp., the non-GAAP
earnings per share, the non-GAAP operating income, the non-GAAP gross margin, the non-GAAP internal research and development, the
non-GAAP selling, general and administration, the non-GAAP interest and other (income) expense, and the non-GAAP income tax
(benefit), measure earnings and operating income (loss), respectively, excluding non-recurring or unusual items that are considered by management to be outside the Company’s standard operation and
excluding certain non-cash items. EBITDA is an adjusted non-GAAP financial measurement that is considered by management to be useful in measuring the profitability
between companies within the industry by reflecting operating results of the Company excluding non-operating factors. There are limitations associated with the use of
non-GAAP financial measures, including that such measures may not be entirely comparable to similarly titled measures used by other companies, due to potential differences among calculation methodologies.
Thus, there can be no assurance whether (i) items excluded from the non-GAAP financial measures will occur in the future or (ii) there will be cash costs associated with items excluded from the non-GAAP financial measures. The Company compensates for these limitations by using these non-GAAP financial measures as supplements to GAAP financial measures and by
providing the reconciliations of the non-GAAP financial measures to their most comparable GAAP financial measures. Investors should consider adjusted measures in addition to, and not as a substitute for, or
superior to, financial performance measures prepared in accordance with GAAP. All non-GAAP amounts exclude certain adjustments for share-based compensation, acquired intangible amortization expense,
restructuring charges (recoveries), integration and site consolidation expenses, integration transaction expenses, start-up costs related to the start-up of new devices
for new customer applications, and various one-time adjustments. See Table 8 for the Reconciliation of GAAP measures to non-GAAP measures. |
| (2) |
GAAP Operating income is defined as earnings before income taxes, interest expense, and other expense or
income, net. |
2
EXECUTIVE SUMMARY
Revenue. $1.209 billion, above the high end of our $1.120 – 1.200 billion guidance and an approximate 7% sequential increase.
Non-GAAP Gross Margin. 35.8%, slightly below our 36 – 38% guidance and a 20 bp sequential decrease from
36.0%. New Datacom transceiver product introduction ramps, a power failure in a silicon carbide growth facility, slower than expected recovery in Telecom, and higher than expected inventory provisions in our Lasers segment collectively had an over
100 bps adverse impact.
Non-GAAP Operating Margin. 15.1%, within our 14 – 16% guidance and slightly
lower than the preceding quarter.
Non-GAAP EPS. $0.53, above the high end of our $0.32 – $0.52
guidance and up from $0.36 in the preceding quarter.
Operating Cash Flow. $117 million, compared to $152 million in the year-ago quarter and $67 million in the preceding quarter.
Debt Reduction. We paid down $58 million of
our outstanding debt.
Visibility. Macroeconomic uncertainty continues to impact our near-term growth and visibility. Recovery in our Telecom
vertical was slower than we previously expected. We continued to see signs of ongoing improving demand trends along with favorable company-specific trends during the quarter. We expect ongoing sequential improvement in revenue growth in the fourth
quarter of fiscal 2024.
AI/ML. We enjoyed a fourth straight quarter of strong demand for our AI/ML-related
Datacom transceivers. Our 800G revenue increased sequentially by almost 80% to almost $200 million and is on track to exceed $250M in our fourth quarter of fiscal 2024. In response to customer demand, we are making progress toward commercial
launch of our 1.6T Datacom transceivers and components in calendar 2025 and expect to ship commercial samples of 1.6T products to our customers starting in the first quarter of fiscal 2025.
3
PART I - OUTLOOK, VISIBILITY, KEY TRENDS, AND DEVELOPMENTS
OUTLOOK
These metrics are provided on a non-GAAP basis. Non-GAAP earnings per share is on a fully diluted basis. The outlook assumes that the exchange rate of the U.S. dollar to other currencies will remain
relatively stable at current levels.
FOURTH QUARTER FISCAL 2024
Our guidance for our fourth quarter of fiscal 2024 ending June 30, 2024, is as follows:
| |
◾ |
Revenue of approximately $1.23 – 1.32 billion. |
| |
◾ |
Non-GAAP gross margin of approximately 36.0 – 37.5%.
|
| |
◾ |
Non-GAAP operating expense of approximately $254 –
270 million. |
| |
◾ |
Non-GAAP operating margin of approximately 16 – 17%
|
| |
◾ |
Non-GAAP Adjusted EBITDA of approximately 22 – 23%.
|
| |
◾ |
Interest expense of approximately $66 – 69 million. |
| |
◾ |
Non-GAAP tax rate of approximately 16 – 19%.
|
| |
◾ |
Series B Preferred P.I.K. Dividend of approximately $31 million. |
| |
◾ |
Non-GAAP earnings per share of approximately $0.52 – 0.68.1 |
| |
◾ |
Share count for the entire guidance range is 156 million. |
| |
◾ |
Capital expenditures of approximately $115 – 135 million (approximately $50 million of which
will be funded by Silicon Carbide LLC). |
Pretax amounts of non-GAAP adjustments in the fourth
quarter of fiscal 2024 include:
| |
◾ |
Stock compensation of approximately $23 – 29 million. |
| |
◾ |
Amortization of approximately $74 million. |
| |
◾ |
Restructuring, synergies, and consolidation expenses of approximately $60 – 70 million.
|
FULL YEAR FISCAL 2024
Our
guidance for fiscal 2024 ending June 30, 2024, is as follows:
| |
◾ |
Revenue of approximately $4.62 – 4.70 billion, a $70 million increase of the low end of our
previous guidance of $4.55 – 4.70 billion. |
| |
◾ |
Non-GAAP gross margin of approximately 35.7 – 36.3%.
|
| |
◾ |
Non-GAAP operating expense of approximately $975 –
990 million. |
| |
◾ |
Non-GAAP operating margin of approximately 14.7 – 15.2%.
|
| |
◾ |
Non-GAAP Adjusted EBITDA of approximately 21.0 – 21.5%.
|
| |
◾ |
Interest expense of approximately $286 – 290 million. |
| |
◾ |
Non-GAAP tax rate of approximately 17 – 18%.
|
| |
◾ |
Series B Preferred P.I.K. Dividend of approximately $123 million. |
| 1 |
The Company does not provide reconciliations of forward-looking
Non-GAAP EPS. The Company is unable, without unreasonable efforts, to forecast certain items required to develop a meaningful GAAP financial measure that is comparable to this forward-looking figure.
|
4
| |
◾ |
Non-GAAP earnings per share of approximately $1.56 – 1.73, up from
our $1.30 – 1.70 previous guidance.2 |
| |
◾ |
Share count for the entire guidance range is 154 million. |
| |
◾ |
Capital expenditures of approximately $365 – 385 million (approximately $150 million funded by
the Silicon Carbide LLC). |
Pretax amounts of Non-GAAP adjustments for full year fiscal 2024
include:
| |
◾ |
Stock compensation of approximately $122 – 128 million. |
| |
◾ |
Amortization of approximately $290 million. |
| |
◾ |
Restructuring, synergies, and consolidation expenses of approximately $198 – 208 million.
|
BIG PICTURE
In the face of
what remains a challenging macroeconomic environment, for the quarter, we delivered solid sequential revenue growth, above the high end of our guidance, and implemented rigorous controls on operating expense, which came in below the midpoint of our
guidance, and which together offset disappointing gross margin to drive strong sequential improvement in Non-GAAP EPS, above the high end of our guidance.
Demand
Our Datacom strength is more than offsetting
slower than expected revenue growth in some other markets and verticals. We remain confident in our long-term growth prospects for each of these markets and verticals. We also saw additional positive trends in each. We emerged from the third
quarter, however, relatively more cautious as to the timing of recovery in revenue growth in our Telecom vertical and as to the growth rate in fiscal 2025 for our silicon carbide revenue.
Communications Market
Datacom Vertical. We
enjoyed another quarter of strong AI-related Datacom demand for our 800G Datacom transceivers. We expect this strength to continue in the current fourth quarter and into fiscal 2025.
Telecom Vertical. While the third quarter also offered signs of improving end demand in our Telecom vertical within our Communications market, Telecom
recovery is slower than we previously expected, as our customers are still working down their inventory, but at a slower pace than we forecasted. Our Telecom revenue sequentially declined, albeit modestly, in the third quarter, and we currently
expect sequentially flat revenue in our current fourth quarter.
Industrial Market
The third quarter offered further signs of recovery in Industrial market end demand. Our Industrial orders sequentially increased by 10% following 11%
sequential growth in the second fiscal quarter, and we currently expect to end our fiscal 2024 with a third straight quarter of over 10% sequential growth. Our Industrial revenue for the third quarter and our revenue outlook for
| 2 |
The Company does not provide reconciliations of forward-looking
Non-GAAP EPS. The Company is unable, without unreasonable efforts, to forecast certain items required to develop a meaningful GAAP financial measure that is comparable to this forward-looking figure.
|
5
the fourth quarter compare favorably to the sequential decline we experienced throughout fiscal 2023 and into the first quarter of fiscal 2024. A sequential decline in our Aerospace &
Defense revenue, however, offset sequential growth in the other three verticals within our Industrial market to drive relatively flat sequential revenue in the third quarter. We expect healthy sequential revenue growth in our Industrial market in
the current fourth quarter.
Electronics Market
Silicon Carbide. Our revenue growth outlook for our silicon carbide business is less than we previously expected as a result of supply constraints
limiting our ability to ramp production. We have been supply-constrained, with our ability to ramp production having been the key constraint to silicon carbide revenue growth. We still expect to out-grow the
overall silicon carbide market in both the near and longer term. We have moderated our silicon carbide revenue growth outlook for fiscal 2025, however, to take into account the industry-wide slowdown in EV demand and production.
Instrumentation Market
We remain excited regarding the
long-term growth opportunity in the Instrumentation market. Near-term, demand in our Instrumentation market appears to have stabilized with a third straight quarter of just under $100 million in revenue. Elevated inventories appear to have been
reduced to and may have reached normalized levels; however, we have yet to see a return to sequential or year-over-year growth, and our revenue remains approximately 15 – 20% below its fiscal 2023 level primarily due to macroeconomic
uncertainty.
Margins
Driving meaningful secular
improvement in our margin structure remains our primary focus. We remain confident that we will return to our previous 40% Non-GAAP gross margin and 20% Non-GAAP
operating margin structure by the end of the first half of fiscal 2026 and believe that we will eventually exceed these targets. As we noted in our Shareholder Letter in the preceding quarter, we are making significant investments and are
implementing numerous actions to drive this progression.
Third quarter gross margin was below our guidance, which we offset by solid operating expense
controls driving operating margin above the midpoint of our guidance. Our gross margin was adversely impacted by several factors that we believe we have resolved or will resolve over the next several quarters. These factors collectively had a
greater than 100 bps adverse impact on our gross margin in the quarter. They span our Datacom vertical within our Communications market, our silicon carbide business (the revenues of which are reflected within our Electronics market) and our Lasers
segment.
Accordingly, we have reduced our full year fiscal 2024 Non-GAAP gross margin outlook to
35.7 – 36.3% from 36 – 38% previously. We expect to drive sequential improvement in our current fourth quarter to 36.0 – 37.5%.
We set forth below a more detailed discussion of the specific issues by segment.
6
Materials. Lower than expected yields drove our disappointing silicon carbide gross margin in the
third quarter. Specifically, a power failure limited our silicon carbide substrate growth yield. The resulting lower production volume translated into lower overhead absorption. We have fully resolved the power failure. Our silicon carbide growth
yields are very close to plan and production volumes are increasing with, we expect, an over 50% sequential increase in our silicon carbide revenue in our fourth quarter.
Networking. Lower than expected Datacom gross margin accounted for over 50% of the total adverse impact. Specifically, lower transceiver yields was the
primary issue. We have implemented a number of corrective actions, have started to see meaningful improvement in yield, and expect to attain our targeted yield by the time we exit the first quarter of fiscal 2025.
Lasers. Lower than expected gross margin in our Lasers segment was primarily due to a number of one-off
inventory provisions related to portfolio adjustments. We do not expect these to recur.
Unchanged Long-Term Outlook; Growth Bias. Our longer-term
outlook for improved margin structure and strong secular growth in all of our markets remains unchanged, driven by both an eventual recovery in end market demand and the impact of AI along with other significant drivers discussed at greater length
below.
We are not waiting for improved end market demand to drive enhanced profitability. We have already implemented actions across virtually all of our
businesses in a drive for enhanced operating efficiency as measured by return on sales.
As discussed in our second quarter fiscal 2024 Shareholder Letter
and at greater length below, some of these actions require significant time, effort, innovation, and investment to have meaningful impact. These include our digital transformation and facilities consolidation including consolidation of multiple fabs
(which are part of our Enterprise Transformation Program) as well as our Asia Pacific Center of Excellence for materials, optics, and lasers where we are expanding our footprint to accommodate our long-term growth in the Philippines, Malaysia,
Vietnam, and Singapore. We think the near-term cost of these actions will yield meaningful long-term return in the form of significant improvement in our cost structure and operating efficiency, which in turn we expect will benefit both our margin
structure and our competitiveness and thereby our revenue growth and our profitability.
In addition, our diversification across product, technology,
customer, and regional markets allows us to redeploy capital and people from low or declining returns to higher-return market opportunities. Almost by definition, the initial “investment” phase of such a shift typically entails lower gross
margin, which eventually is followed by margin uplift as the investments and learning begin to translate into targeted yields, BOM costs and cycle times, enhanced operating efficiency, greater revenue volume, and increased overhead absorption.
Near-Term Focus on Execution; Increased FY24 Revenue Outlook Driven by Strong AI-Driven Datacom Demand. We have
increased the lower end of our fiscal 2024 revenue guidance. We are now guiding for $4.62 – 4.70 billion versus our previous guidance of $4.55 – 4.7 billion. Underlying our revised outlook, the third quarter reinforced our
confidence in the outlook for our Datacom vertical (which is within our Communications market) driven by AI-related datacenter builds by webscale, other cloud internet content providers (ICPs), and companies
that supply them.
For the fourth quarter of fiscal 2024, we are forecasting 5% sequential revenue growth and almost 13% sequential non-GAAP EPS growth over the third quarter (at the midpoint of guidance). The expected revenue growth is driven primarily by the strength in our AI-related Datacom transceiver
and silicon carbide businesses.
7
Improved Capital Structure and Ratings. On April 2, 2024, we successfully completed the
repricing of our existing $2.4 billion secured Term Loan B. We will realize almost $9 million of annual interest savings from the repricing.
On
February 21, 2024, Moody’s Investor Service upgraded the credit rating of Coherent Corp. to Ba2. Moody’s cited “The ratings upgrade reflects Moody’s expectation that Coherent’s financial metrics and cash generation will
continue to improve. This reflects a recovery in end markets along with continued strong sales growth in optical transceivers serving generative artificial intelligence (GenAI) uses.”
A table of our current credit ratings can be found below:
|
|
|
|
Credit Profile - Moody’s /
S&P / Fitch |
|
|
|
Corporate Family Rating
|
|
Ba2 / BB- / BB |
|
Secured Ratings |
|
Ba1 / BB- / BBB- |
|
Unsecured Ratings |
|
B1 / B+ / BB |
|
Outlook |
|
Stable / Negative /Stable
|
|
Last Update Date |
|
2.24 / 10.23 / 11.23
|
8
VISIBILITY, KEY TRENDS, AND DEVELOPMENTS
Margin Structure: Opex Discipline Offsets Some Transitory Gross Margin Issues
As previously noted, strong operating leverage resulting from the revenue upside and better than expected operating expense control offset weaker than expected
gross margin to drive operating margin just above the midpoint of our 14 – 16% third quarter guidance, which in turn contributed to our posting Non-GAAP EPS above the high end of our $0.32 – 0.52
guidance.
Our gross margin was adversely impacted by a number of issues that we have resolved or expect to resolve by
mid-fiscal 2025. Collectively, these issues in the aggregate had an over 100 bps adverse impact on our Non-GAAP gross margin in the third quarter.
Lower than planned yields for some of our Datacom transceivers accounted for well over 50% of the third quarter aggregate impact. We have implemented
corrective actions, and have already started to see improvement, and we expect to achieve our targeted level.
We also suffered from very low gross margin
in our silicon carbide business due to a power failure at a crystal growth facility, which also resulted in an overhead absorption issue due to the significant adverse impact on our Silicon Carbide LLC revenue in the third quarter. We have addressed
the power failure issue, and our silicon carbide revenue has returned to a positive trajectory.
Third Quarter of Fiscal 2024. Non-GAAP gross margin of 35.8% was below our 36 – 38% guidance and relatively flat with the 36.0% we reported in the second quarter of fiscal 2024. Non-GAAP operating
margin of 15.1% was in-line with our 14 – 16% guidance and essentially flat with the 15.2% we reported in the preceding quarter. As previously noted, a number of transitory issues offset the strong
sequential revenue growth to drive our disappointing gross margin. The strong sequential increase in revenue together with positive operating leverage offset the relatively weak gross margin to drive operating margin
in-line with our guidance.
Fourth Quarter of Fiscal 2024. We expect to drive to 36.0 – 37.5% Non-GAAP gross margin and 16 – 17% Non-GAAP operating margin in our fourth quarter of fiscal 2024. The primary drivers of the expected sequential increase are greater
revenue and improved operational efficiencies.
Fiscal 2024. We expect 35.7 – 36.3% Non-GAAP gross
margin and 14.7 – 15.2% Non-GAAP operating margin for all of fiscal 2024 compared to our previous guidance of 36 – 38% and 14 – 16%, respectively.
Longer-Term. Our longer-term outlook for return to 40% Non-GAAP gross margin and 20% Non-GAAP operating margin remains unchanged.
Key Drivers. Underlying our longer-term view, unchanged from the
preceding quarter, key drivers of operational excellence to attain each of the above targets are broadly focused on pricing, procurement, and productivity, and include:
| |
◾ |
continuous rationalization and refreshing of the portfolio; |
| |
◾ |
continuous rationalization of the supply base for cost and resiliency; |
9
| |
◾ |
implementation of a streamlined Asia Pacific manufacturing Center of Excellence; |
| |
◾ |
moving up the value chain; |
| |
◾ |
operating cost reductions based on a more resilient and lower-cost manufacturing footprint;
|
| |
◾ |
increased capacity utilization; |
| |
◾ |
favorable product mix, driven by product introductions with higher margins; |
| |
◾ |
productivity improvements through improvements in yields and quality; |
| |
◾ |
implementation of digital transformation and adoption of AI technology to improve efficiency in R&D,
manufacturing, and G&A; and |
| |
◾ |
leveraging our service organization into new markets. |
| |
2. |
Operating Margin: in addition to the above drivers of gross margin improvement, we expect to drive
future operating margin improvement from operating leverage by both increasing revenue and ongoing operating expense control, with the latter enhanced by the execution of: |
| |
◾ |
our Enterprise Transformation Program; |
| |
◾ |
our Synergy and Site Consolidation Plan; |
| |
◾ |
our Restructuring Plan; and |
| |
◾ |
additional cost and expense reductions underway. |
Strategic Opportunities. As previously noted, as we transform the Company to improve operating performance, restructure our production footprint
to enhance operating resiliency, and complete the integration of legacy Coherent, Inc., we are exploring other strategic opportunities—not including material acquisitions—to unlock shareholder value.
Enterprise Transformation Program. We have implemented and continue to make significant progress on our Enterprise Transformation Program. This program
encompasses rollout of a new operating model, end-to-end global process capabilities and systems, and includes digital transformation, site consolidation, and
restructuring. We expect this program, following full implementation, to drive significant operating efficiencies. We have completed the design of the program’s integrated business planning and management capability and are rolling it out in
our business units. This capability will allow us to scale our business operations, improve inter-business unit coordination given our vertically integrated structure, and unlock significant value through better inventory management, reduced cost of
goods sold (COGS), and improved long-range capacity and business planning.
In addition, as part of this program, our digital transformation is focused on
designing and implementing a new integrated digital platform throughout the Company. Implementation will start in fiscal 2025 and extend through fiscal 2027 – 2028. We expect this digital transformation to drive improved ways of working,
collaboration, and standardization of processes that should allow us to effectively scale our business while significantly reducing internal complexity.
Synergy and Site Consolidation. The stated goal of our Synergy and Site Consolidation Plan for the Coherent, Inc., acquisition was to achieve
$250 million in annual synergies over three years, with $250 million of costs to achieve these synergies. We have accelerated some of the actions planned as part of our post-three-year synergy and site consolidation and relocation efforts.
These relocations and other actions are expected to help offset our lower than expected supply chain cost savings that result from lower revenue and allow us to achieve our targeted $250 million in annual synergies. At the end of the first
year, we reached $73 million of synergies for fiscal 2023. In the first nine months of fiscal 2024, we achieved another $131 million in synergies, an annualized run-rate of $175 million. To
date, synergies are split 60% cost of sales and 40% operating expenses.
10
Restructuring. In the fourth quarter of fiscal 2023, we implemented a Restructuring Plan that
includes site consolidations and closures as well as the relocation and requalification of certain manufacturing facilities. The following restructuring actions are intended to realign our cost structure as part of a transformation to a simpler,
more streamlined, resilient, and sustainable footprint and business model:
| |
◾ |
China and Rest of Asia Site Consolidation. Consolidation of sites in China and the rest of Asia,
including the closure of certain manufacturing facilities and sales offices and the establishment of new regional design centers closer to our customers in the Global South as part of a multi-year plan, are underway. The intent of these actions is
to optimize our footprint in Asia. In addition, through these actions, we will replicate the state-of-the-art manufacturing lines
we have in China to other parts of Asia to increase resiliency to our supply chain by taking advantage of the best practices of operational excellence, new product introductions, a smarter and shorter supply chain, and redundancy for sustainability.
|
| |
◾ |
Compound Semiconductor Site Consolidation. Consolidation of compound semiconductor wafer fab and device
manufacturing facilities, including the closure of half of these facilities, is a multi-year and cross-cutting initiative. We will consolidate into our most modern facilities with a stable baseline of operational excellence and will drive better
utilization of our assets while reducing our costs and improving our new product introduction and technology innovation cycle times. |
| |
◾ |
Savings. We expect total savings for fiscal 2023 – 2025 to be $200 – 250 million, with
annual savings of $110 – 140 million by fiscal 2025. We forecast savings associated with the Plan to be approximately $90 – 100 million for full fiscal year 2024. |
| |
◾ |
Costs to Achieve. We expect total costs to achieve these savings over the fiscal 2023 – 2025 period
to be $175 – 200 million, including severance, retention, facility moves, accelerated depreciation, short-term duplicate costs, lease termination costs, and IT consolidation costs. In the third quarter of fiscal 2024, we recorded
restructuring charges of $12 million, consisting primarily of employment termination costs and charges for accelerated depreciation and equipment write-offs. |
| |
◾ |
Restructuring Charges. We expect restructuring charges to be in the $25 – 35 million range for
full fiscal year 2024 mainly comprised of employment termination, facility move costs, and accelerated. We expect restructuring charges to be in the $35 – 45 million range for full fiscal year 2025, consisting primarily of employment
termination, facility move costs, and accelerated depreciation, and savings associated with the Plan to be $110 – 140 million for full fiscal year 2025. In fiscal 2023, restructuring charges were $119 million, primarily for workforce
reduction and the write-off of property and equipment, net of $65 million from reimbursement arrangements. |
11
Visibility
Backlog and Orders
In the third quarter, both orders and
backlog decreased sequentially but increased year-over-year. The sequential decreases were consistent with our previous expectations. They primarily reflect ongoing normalization of order levels in our Networking segment, which in turn is being
driven by ongoing moderation from the extraordinarily strong levels we have enjoyed for our 800G Datacom transceivers early in the still-young trend of AI-related datacenter builds.
| |
◾ |
Backlog. We ended the quarter with approximately $2.74 billion of backlog, an approximate
$150 million sequential decline from approximately $2.9 billion at the end of the preceding quarter and a well over $100 million increase from the year-ago quarter. |
| |
◾ |
Orders. Orders decreased sequentially by approximately 4% but increased year-over-year by approximately
11%. The sequential decline was primarily driven by decreased orders in our Networking segment due to continued decreases in lead times. We also saw a second straight quarter of double-digit order growth in our Lasers segment. The year-over-year
increase was primarily driven by strong year-over-year order growth in our Networking and Lasers segments, which offset a large year-over-year decline in orders in our Materials segment. The year-over-year Materials orders decline primarily was
driven by a product design change by our largest customer within our Consumer Electronics vertical (which we have highlighted in each of the past four quarters), along with macroeconomic uncertainty. |
Networking Segment: Ongoing AI Datacom Strength; Disappointing Telecom
We continue to enjoy strong momentum in our Networking segment driven by 800G transceivers for AI. Recovery in our Telecom business, however, is slower than we
expected.
Near-Term. Near-term, Datacom transceiver order strength offset ongoing weakness in our Telecom business to drive an over 25%
year-over-year increase in overall orders for our Networking segment. Networking orders decreased by approximately 15% sequentially primarily reflecting a contraction in customer order lead times since the initial surge in AI-related 800G orders at the end of the fourth quarter of fiscal 2023. As our 800G Datacom transceiver shipments continue to ramp against our significant backlog and as lead times shorten, we expect our backlog to
continue to decline.
In terms of revenue, our Networking segment enjoyed strong sequential and year-over-year growth and a record quarter driven by
record Datacom transceiver revenue. Networking revenue increased sequentially by $95 million, or 18%, and year-over-year by almost $68 million, or 12%, to $619 million. We expect ongoing strong
AI-related Datacom transceiver revenue growth to drive another quarter of strong sequential revenue growth in our Networking segment in our fourth quarter of fiscal 2024.
12
Longer-Term. Our unchanged outlook for strong longer-term Networking revenue growth is based on
ongoing strength in our AI-related Datacom business along with recovery in our non- 800G Datacom and our Telecom businesses. Underlying our longer-term view are strong AI Datacom market trends; expanding AI-related customer engagements; our next-generation AI Datacom products including, in the near-term, 1.6T and, in the longer-term, 3.2T transceivers along with enabling active and passive components; ongoing
inventory digestion that we expect will lead to order normalization in our non-800G Datacom and Telecom businesses by fiscal 2025; eventual improvement in Telecom end demand trends; and market penetration and
revenue ramp of new Telecom products including our DCO transceivers and subsystems products.
Datacom Vertical
AI-Related Datacom Transceivers: Ongoing Strong Demand. Another quarter of strong orders and the further
expansion of our customer engagements during the quarter reinforced our confidence in strong near- and longer-term demand for our AI-related Datacom transceivers. Our total Datacom transceiver revenue
increased by well over $100 million, or well over 30%, sequentially and by well over $100 million, or almost 50%, year-over-year. We continue to expect AI-related revenue to account for more than 50%
of our Datacom transceiver revenue for all of fiscal 2024 and to enjoy strong growth in fiscal 2025 and beyond. 800G comprises the bulk but not all of our AI-related Datacom transceiver revenue.
800G. Datacom strength was driven by a third straight quarter of strong AI/ML-related orders for our 800G
Datacom transceivers from webscale, cloud ICPs, and other companies in the webscale and cloud ICP ecosystem. Speaking to ongoing strength in demand and strong ramp in production, our 800G Datacom transceiver revenue increased sequentially by almost
80% to almost $200 million in the third quarter, which followed over 100% sequential growth in the preceding quarter. We expect well over 30% sequential growth to $250 million for our fourth quarter of fiscal 2024.
1.6T on the Horizon. We also are excited by the active engagement we are seeing from key customers for 1.6T transceivers and components. In response to
customer demand, we continue to make progress toward expected commercial launch and revenue in calendar 2025 and expect to ship commercial samples of 1.6T products to our customers starting in the first quarter of fiscal 2025 of our 1.6T
transceivers including designs based on silicon photonics, 200G EMLs, and DFB-MZ lasers. We see the opportunity for, and expect, these 1.6T solutions to increase our share of the
AI-related Datacom transceiver and component opportunity by relying on our broad and deep level of vertical integration relative to our direct transceiver competitors.
AI-Customer Diversification. While the revenue opportunity remains concentrated in a relatively limited number
of potential customers within the AI-related Datacom transceiver market, four different customers are on track to generate meaningful AI-related Datacom revenue for our
full year fiscal 2024.
Market-Leading Position. Our transceivers are designed to be compatible with all of the protocols and standards that are
currently used for AI connectivity. We believe that we are equally well-positioned—in terms of technology, products, and customer relationships—to address anticipated evolutions of AI connectivity architectures. We believe our competitive
advantages and strategic key customer engagements are due to the breadth of our solutions, our technology innovation, and our broad vertical integration, which improve our ability to ramp volume production and to offer the highest performance and
most cost-competitive solutions to the market. The retooling of datacenter architectures and integration of AI clusters by webscale and other cloud companies represent an immediate and direct growth opportunity for our Datacom business—both our
transceivers and our enabling active and passive components, especially leading-edge high-speed lasers.
13
Mix Heavily Weighted to Faster Growth, Higher Line Rate Transceivers. 800G Datacom transceiver
revenue accounted for almost 50% and together with 200G and 400G Datacom transceivers accounted for almost 80% of our total Datacom transceiver revenue in the quarter.
AI Transceiver Ramp Progression
As expected, we realized
meaningful improvements in both our supply chain constraints and our ability to ramp production in the third quarter. Our external supply chain shortages had less than a $10M adverse revenue impact in the quarter. All of the shortages impacted our
Datacom transceivers business. We expect an immaterial level of supply constraints going forward assuming, as always, no large spikes in customer demand or product design/configuration changes.
Telecom: Disappointing Near-Term; Unchanged Strong Longer-Term Outlook
Recovery in our Telecom vertical is proving slower than we had previously projected. Our Telecom revenue sequentially decreased in the third quarter and fell
short of our internal forecast, albeit modestly on both counts, and we expect relatively flat revenue growth in our current fourth quarter. The primary issue is soft end demand as communication service providers (CSPs), webscale, and other ICP
customers continue to delay projects and reduce or keep a tight rein on their capital expenditures.
Now Expect Start of Recovery in FY25. While
there remains some uncertainty regarding the timing of market recovery, we expect improvement in our Telecom revenue in fiscal 2025. Underlying our view, we see a number of drivers including ongoing rebound in Telecom revenue from China driven by
400G C+L-band network upgrades, increasing revenue contribution from our new transceivers targeted to the ZR and ZR+ coherent transceiver market opportunity, and share gains in certain key Telecom product
segments.
Unchanged Longer-Term Outlook. Unchanged from the preceding quarter, longer-term, we expect to benefit from ongoing market recovery;
strong customer traction for several new products that expand our addressable market; new market opportunities with a number of new, industry-leading products; and a variety of key emerging opportunities at new prospective direct customers. We are
especially excited about the number and quality of customer design win opportunities for our new 100G ZR and high-power 400G ZR/ZR+ pluggable transceivers at CSPs, webscale companies, and large NEMs. The 100G ZR transceivers are based on our
own internally developed Steelerton DSP, which represents a disruptive product in our portfolio. We currently are qualified and shipping our 400G ZR/ZR+ transceivers, and we expect to commence ramping production and commercial shipments of our new
100G ZR transceivers in the fourth quarter of fiscal 2024.
14
Lasers Segment: Sustained Improvement
In our Lasers segment, while the macroeconomic environment continues to impact demand, we saw additional signs of improvement in the quarter and continue to
expect to see further improvement in the fourth quarter of fiscal 2024 and beyond. Orders in our Lasers segment increased by over 7% sequentially and 17% year-over-year, and marked the highest level since our second quarter of fiscal 2023. Lasers
segment revenue was essentially unchanged from the preceding quarter but declined (by less than 5%) from the year-ago quarter. While having modestly declined on a sequential basis, our Display service revenue
increased by almost 30% from the year-ago quarter primarily driven by the ongoing increase in OLED fab utilization and depletion of service spare parts inventory.
Underlying our expectation for further Lasers improvement in the fourth quarter of fiscal 2024 and throughout fiscal 2025 and beyond, the sequential and
year-over-year order strength in the quarter reflects a number of key positive trends in our Display Capital Equipment and Semiconductor Capital Equipment verticals within our Industrial market. While macroeconomic uncertainty continues to restrain
current demand trends both in our Precision Manufacturing vertical within our Industrial market and in our Instrumentation market, we also expect favorable underlying trends in each of these to eventually contribute to meaningful incremental
improvement in our Lasers segment operating performance.
The key driver of demand for our Display Capital Equipment revenue is capacity expansion in
existing OLED fabs as well as the buildout of new Gen 8 OLED fabs. OLED growth is being driven by further adoption of OLED into smartphones, increasing OLED adoption into tablet and laptop computers, and a rebound in smartphone sales volumes from
the lowest levels in a decade.
We expect our excimer laser revenue in our Semiconductor Capital Equipment vertical to further strengthen in fiscal 2025.
We expect our Lasers segment also to benefit from ongoing penetration of the welding market opportunity with our ARM (Adjustable Ring Mode) laser system
particularly as it relates to battery welding. We are enjoying increasing market breadth and depth of customer adoption, which we expect to drive a corresponding ongoing strong ramp in revenue generation.
As discussed at greater length below, we remain excited as to our longer-term outlook for both our Industrial and Instrumentation markets.
Materials Segment: Enabling the 800G AI Ramp and Executing Multi-Year Fab Consolidation
While our Materials segment remains challenged, we saw a 7% sequential increase in orders in the quarter and expect additional improvement in our current
fourth quarter followed by more meaningful improvement throughout fiscal 2025. The sequential increase in orders marked the first quarter of improvement following a six-quarter downtrend including an over 20%
sequential decline in the preceding quarter. The sequential order increase in the quarter was primarily driven by strong demand for AI-related Datacom VCSELs. The increase also reflects the winding down of the
previously disclosed significant reduction in demand in our Consumer Electronics business driven by a design change by our largest Consumer Electronics customer. A key driver of our Materials segment revenue outlook for this initial rebound to
extend into and strengthen in fiscal 2025 is the demand for lasers for our internal Datacom transceiver ramp, combined with the substantial increase in demand from other transceiver manufacturers; this is requiring a substantial increase in
investment and a strong focus on product development and NPI ramps in our wafer fabs as we invest to expand capacity to support not only 800G and 1.6T for the next few years, but also the development of 3.2T technologies.
15
As part of our Synergies and Site Consolidation Plan, we have initiated consolidation of certain wafer fabs
to increase utilization and thereby profitability.
Silicon Carbide: Near-Term Challenges
We continue to be excited for the long-term growth outlook for our silicon carbide business based on what we expect to be robust silicon carbide end demand and
our strong competitive position. As we expected, however, the previously noted power failure adversely impacted our Silicon Carbide LLC revenue in the quarter. This issue also adversely impacted our third quarter gross margin for this business. We
are making progress working through the issue and expect a greater than 50% increase in our Silicon Carbide LLC revenue, which should also drive sequential improvement in our silicon carbide gross margin. We have moderated our fiscal 2025 silicon
carbide revenue growth outlook to take into account the industrywide slowdown in EV demand and production.
As a reminder, during the second quarter of
fiscal 2024, we consummated the previously announced transactions (the “Transactions”) with Mitsubishi Electric and DENSO Corporation pursuant to which those entities invested an aggregate of $1 billion in exchange for noncontrolling
ownership interests of 12.5% each in Silicon Carbide LLC, a newly formed LLC into which we contributed our silicon carbide business, and entered into long-term supply agreements that will support their demand for silicon carbide substrates and
epitaxial wafers.
The operating results of Silicon Carbide LLC are consolidated in our income statement with Mitsubishi Electric’s and DENSO’s
noncontrolling interests in Silicon Carbide LLC reported as “Net Loss Attributable to Noncontrolling Interests” below the Net Loss line on our income statement. The aggregate $1 billion of cash we received is reported as
“Restricted Cash (current and noncurrent)” on our balance sheet.
Capital Expenditure and Debt Reduction Outlook
We are tightening our capital expenditure outlook for fiscal 2024 to $365 – 385 million, with our Silicon Carbide LLC funding approximately
$150 million of this amount. In the third quarter of fiscal 2024, our total capital expenditure was $93 million, of which $52 million was funded by Silicon Carbide LLC. We expect capital expenditures of $115 – 135 million
for the current fourth quarter with Silicon Carbide LLC funding approximately $50 million of this amount.
We now expect aggregate debt repayment
between $225 – 250 million for all of fiscal 2024 compared to our previous expectation of $225 – 275 million from the preceding quarter. This outlook compares to approximately $200 million prior to our closing of the Silicon
Carbide Transactions.
As a reminder, the Transactions are expected to allow Coherent to increase its available free cash flow to provide greater
financial and operational flexibility to execute its capital allocation priorities including debt reduction. And as we have noted on previous occasions, the Transactions relieve the need for Coherent to fund future operating or capital expenditures
of Silicon Carbide LLC.
16
Trade Compliance Update on U.S. Restrictions: New Semiconductor-Related Export Controls – No
Meaningful Impact Expected
Unchanged from the preceding quarter, at present, we do not expect a meaningful adverse impact from the new round of export
control restrictions announced by the U.S. Department of Commerce on October 17, 2023. These newest restrictions target exports of certain integrated circuits and semiconductor manufacturing equipment to China and impose new end use and end
user controls to constrain certain technology development in China. As with others in the industry, we continue to assess these new rules and to update our compliance controls and actions to account for them.
17
PART II—FINANCIAL OVERVIEW
THIRD QUARTER FISCAL
Revenue. We generated
$1.209 billion in revenue, above our $1.020 – $1.200 billion guidance range and a 7% sequential increase but a 3% year-over-year decrease. Strong Networking segment revenue drove both the upside and the sequential growth. On a
year-over-year basis, a significant decrease in Materials revenue and modest decrease in Lasers revenue more than offset strong growth in Networking revenue to drive the overall revenue decline. Our revenue growth continues to be impacted by soft
end market demand due to the uncertain macroeconomic environment, inventory digestion in certain end markets including, most prominently, non-AI Datacom and Telecom, and a design change by a prominent customer
in our Consumer Electronics vertical.
| |
◾ |
Materials. Revenue of $239 million for our Materials segment decreased by approximately 6%
sequentially and by approximately 26% year-over-year but was only slightly below our internal forecast. The sequential and year-over-year decreases were primarily driven by sequential and year-over-year decreases in our Consumer Electronics revenue,
as we had expected, along with the production ramp issue that adversely impacted our Silicon Carbide LLC revenue in our Automotive vertical. |
| |
◾ |
Networking. Revenue of $619 million for our Networking segment healthily exceeded our internal
forecast, increased by approximately 18% sequentially and by approximately 12% year-over-year, and marked a quarterly record. The sequential increase was primarily driven by the almost 80% sequential increase in our
AI-related 800G Datacom transceiver revenue to almost $200 million for the quarter, which was partially offset by a sequential decrease in our Telecom revenue and ongoing weakness in our non-800G Datacom business. The year-over-year increase was primarily driven by the year-over-year increase in our AI-related Datacom revenue partially offset by significant
year-over-year revenue decreases for both our Telecom and non-800G Datacom businesses, both of which are primarily due to customer inventory digestion along with some project delays by customers in our Telecom
vertical. |
| |
◾ |
Lasers. Revenue of $351 million for our Lasers segment was essentially flat compared to the
preceding quarter, and a 4% decrease compared to the year-ago quarter. The slight sequential decrease was driven by our Industrial market. The year-over-year decrease was primarily driven by macroeconomic
uncertainty. As we observed in the preceding quarter, encouragingly, we are starting to see improvement in our Laser service revenue, primarily driven by increasing fab utilization and depleted inventory in our Display Capital Equipment market
segment, which in turn is driven by further OLED adoption in smartphones and the inception of OLED adoption in laptop computers and tablets. |
Non-GAAP EPS. Non-GAAP diluted earnings per share was $0.53, above the
high end of our $0.32 – 0.52 guidance range and up from $0.36 in the preceding quarter driven by the revenue upside partially offset by lower than expected gross margin.
Non-GAAP Gross Margin. 35.8%, which was below our 36 – 38% guidance range and a 20 bps sequential decrease
and over 150 bps year-over-year decrease. The primary drivers of the
18
sequential decrease were higher than expected COGS, which more than offset the sequential revenue increase. The primary drivers of the year-over-year decline were lower revenue, which resulted in
lower fixed cost absorption and higher than expected COGS, including lower yields in the datacom vertical and higher inventory provisions.
Non-GAAP Operating Expenses. $250 million or 20.7% of revenue, which is below the midpoint of our $246 – 262 million guidance but represents a sequential increase of $14 million and a
year-over-year increase of $4 million. Operating expenses as a percentage of revenue decreased by 15 bps sequentially but increased by 87 bps year-over-year. The primary driver of the sequential decrease was strong revenue growth partially
offset by higher IR&D expenses. The primary driver of the year-over-year increase was the rate of decrease in revenue combined with a slight increase in operating expenses.
Non-GAAP Operating Margin. 15.1%, which is just above the midpoint of our 14 – 16% guidance and is
a sequential decrease of 10 bps and a year-over-year decrease of 240 bps. The relatively flat sequential performance was driven by higher operating leverage from higher revenue and solid operating expense discipline which offset slightly lower gross
margin compared to the preceding quarter. The year-over-year decrease was primarily due to the year-over-year decrease in gross margin and to slightly higher operating expenses.
Operating Cash Flow. $117 million, compared to $152 million in the year-ago quarter and
$67 million in the preceding quarter.
Capital Expenditures. $93 million, $52 million of which was funded by our silicon carbide
business. As previously noted, we have tightened our capital expenditure outlook for fiscal 2024 to $365 – 385 million and we continue to expect the Silicon Carbide LLC to fund approximately $150 million of this amount.
Debt Reduction. In the quarter, we paid down $58 million of our outstanding debt.
Debt. Gross debt was approximately $4.2 billion and net debt was approximately $3.3 billion at the end of the quarter, compared to
$4.3 billion and $3.4 billion, respectively, at the end of the preceding quarter.
Leverage. Gross leverage was 4.4x and net leverage was
3.5x at the end of the quarter on a calculated basis, using the trailing 12 months of adjusted EBITDA at March 31, 2024, unchanged from the preceding quarter. Including the cost savings and synergy credit of $326 million allowed in the
credit facility, gross leverage was 3.3x and net leverage was 2.6x at the end of the quarter compared to 3.2x and 2.5x, respectively, at the end of the preceding quarter. The Company’s credit agreement allows for customary add backs to Adjusted
Consolidated EBITDA including cost savings, operating expense reductions, and synergies in connection with any restructuring, cost-saving initiative, or other initiatives.
| |
◾ |
Target: Our long-term leverage target remains 2.5x synergized gross leverage. |
19
Table 2
Other Financial Statistics
|
|
|
|
|
|
|
|
|
|
|
|
|
| $ Millions, except per share and percentage amounts
(unaudited) |
|
Q3 FY24 |
|
|
Q2 FY24 |
|
|
Q3 FY23 |
|
|
|
|
|
|
|
|
|
|
|
|
|
|
| Inventory |
|
|
1,292 |
|
|
|
1,292 |
|
|
|
1,394 |
|
| Cash |
|
|
899 |
|
|
|
856 |
|
|
|
884 |
|
| Restricted Cash - Total |
|
|
894 |
|
|
|
964 |
|
|
|
21 |
|
| Gross Debt |
|
|
4,234 |
|
|
|
4,292 |
|
|
|
4,520 |
|
| Net Debt |
|
|
3,335 |
|
|
|
3,436 |
|
|
|
3,636 |
|
| Calculated - Gross/Net leverage |
|
|
4.4x / 3.5x |
|
|
|
4.4x / 3.5x |
|
|
|
3.6x / 2.8x |
|
| Credit Facility - Gross/Net Leverage |
|
|
3.3x /2.6x |
|
|
|
3.2x /2.5x |
|
|
|
2.9x /2.3x |
|
| Debt Payments |
|
|
58 |
|
|
|
89 |
|
|
|
79 |
|
| Operating Cash Flow |
|
|
117 |
|
|
|
67 |
|
|
|
152 |
|
| Capital expenditures |
|
|
93 |
|
|
|
91 |
|
|
|
97 |
|
| Depreciation |
|
|
67 |
|
|
|
67 |
|
|
|
68 |
|
| Amortization |
|
|
72 |
|
|
|
72 |
|
|
|
93 |
|
| Fully diluted shares for NG EPS |
|
|
156 |
|
|
|
153 |
|
|
|
141 |
|
|
|
|
|
|
|
|
|
|
|
|
|
|
As previously noted, the Company has responded to the macroeconomic-driven impact on revenue growth that started in the second
half of fiscal 2023 with a major restructuring plan for fiscal 2023 – 2025, an acceleration of the site consolidation portion of our Synergy and Site Consolidation Plan, and other targeted strategic actions.
20
PART III—NEAR & LONG-TERM TRENDS BY MARKETS & REGIONS
MARKETS
We report in four major end markets, which
comprise ten verticals to provide transparency to investors.
INDUSTRIAL
Revenue. Third quarter revenue of $421 million for our Industrial market was flat sequentially but decreased by 4% year-over-year. The flat
sequential revenue was driven by revenue decline in our Aerospace & Defense vertical offset by modest revenue growth in our Semiconductor Capital Equipment vertical while our Display Capital Equipment and Precision Manufacturing verticals
were essentially flat. The modest year-over-year revenue decline in our Industrial revenue was driven by decreases in our Semiconductor Capital Equipment (specifically driven by reduced revenue for products used in EUV applications) and Precision
Manufacturing verticals partially offset by year-over-year revenue growth in our Display Capital Equipment and Aerospace & Defense verticals.
Industrial Market Overview Webcast. As part of our ongoing effort to increase transparency and enhance the understanding of our investors, we discussed
our Industrial market in greater detail on our December 14, 2023, Industrial Market Overview webcast. A replay and investor presentation are available on our website at coherent.com/company/investor-relations/financial-webcasts.
Demand Trends. While the near-term outlook for our Industrial business remains challenged by the macroeconomic backdrop, we enjoyed another quarter of
improving demand trends in the third quarter, expect additional improvement in the fourth quarter of fiscal 2024 and expect even greater improvement in fiscal 2025, and are excited by a number of longer-term trends. Near-term, we are encouraged by a
strong order trend in our Industrial market. The third quarter marked another quarter of double-digit sequential order growth, and we expect this trend to extend into our current fiscal fourth quarter. We are seeing an especially strong demand trend
for our excimer lasers and related service revenue, which in turn are being driven by strong demand in our Display Capital Equipment vertical. The third quarter marked a third straight quarter of exceptionally strong double-digit order growth for
our Display vertical. Following strong sequential growth in the preceding fiscal second quarter, our Semicap orders were relatively flat in the third quarter, and we expect them to remain relatively unchanged in our current fourth quarter. While
orders in our Precision Manufacturing vertical slightly declined from the preceding quarter, we expect strong double-digit sequential improvement in our current fourth quarter.
A more in-depth discussion of trends within each of our Industrial verticals follows.
| |
1. |
Semiconductor Capital Equipment Vertical: Beyond the near-term growth we expect for our Semicap
vertical, we see favorable long-term demand trends for our Semicap business. We expect these trends to drive strong double-digit annual revenue growth in our Semicap vertical. |
| |
◾ |
Revenue. Revenue in our Semicap vertical increased by 4% sequentially but decreased by 4% compared to a year-ago record quarter. As discussed at greater length below, the sequential increase was driven by an initial rebound in back-end applications of this vertical while revenue
for front-end applications was relatively flat. |
21
| |
◾ |
Market Overview. As previously noted, over the long term, we expect strong annual revenue growth
in our Semicap vertical. Since fiscal 2020 we have driven record revenue every year in this vertical driven by the increased use of lasers, materials, and optics in advanced semicap tools. Near-term, we expect to see relatively flat revenue in our
current fourth quarter followed by improved revenue growth throughout fiscal 2025 with the benefit of the start of recovery in the semiconductor market following the current cyclical downturn. We have started to see recovery in the back-end assembly and packaging equipment segment of our Semicap vertical. Key Semicap end market drivers include increased demand for leading-edge chips for AI, high-performance computing, and automotive. We also
see favorable long-term demand trends for our Semicap business augmented by government policy-driven fab investments (i.e., government subsidies for expanding production capacity) and, most importantly, our increasing serviceable addressable market
(SAM) driven by portfolio expansion and the increased adoption of high-performance lasers, over the longer term. We enjoy a strong NRE-funded design-win pipeline from
existing and new customers across both front-end wafer processing and wafer inspection, among new applications. |
| |
◾ |
Front-End. We enjoy a particularly strong competitive position
in front-end Semicap, which accounts for most of our Semicap vertical revenue. We have a number of new programs and design wins on track to drive future incremental revenue. Our semiconductor wafer inspection
backlog remains strong. Our front-end laser business posted another quarter of solid sequential growth driven by a record quarter for laser shipments into wafer inspection. This growth was partially offset by
ongoing softness in our EUV business. |
| |
◾ |
EUV Rebound. Consistent with public statements by our end customer, we expect to see EUV inventory
normalization starting in our current fourth quarter of fiscal 2024 and expect to enjoy a rebound in EUV demand in fiscal 2025 as our end customer ramps up shipments of its EUV systems. Dozens of our solutions spanning our Materials and Lasers
segments are designed into these EUV systems. |
| |
◾ |
Back-End Rebound. As previously noted, we also expect to benefit
from recovery in the back-end assembly and packaging segment of our Semiconductor Capital Equipment vertical. After a prolonged period of softness, the back-end segment
has started to benefit from improved demand in China driven by increases in China domestic smartphone sales. In the third quarter, we enjoyed double-digit back-end Semicap revenue growth on both a sequential
and year-over-year basis. We expect ongoing back-end revenue growth in our current fourth quarter of fiscal 2024 and throughout our fiscal 2025. The key drivers of our
back-end growth outlook are AI, high-performance computing, and 5G. Notably, advanced packaging is driven by demand for AI chips, which also creates new potential opportunities for our lasers and advanced
materials in the Semicap vertical. |
| |
◾ |
Additional Growth Opportunities. We are excited by significant growth opportunities in the Semicap
vertical for our advanced composite materials and diamond. We launched our new picosecond industrial green laser HyperRapid NXT-Green at 100W at Photonics West (January 2024) to meet the market demand for
higher process quality and throughput. We also expect incremental revenue contribution from wins with new advanced ceramic materials and assemblies for next-generation lithography machines. |
22
| |
◾ |
AI. Our opportunities should be favorably impacted by AI. The widespread adoption of AI will drive
significant demand for leading-edge semiconductor technologies, including next-generation node logic chips, high bandwidth memory (HBM), and advanced packaging. We expect this trend to drive incremental demand for our lasers and advanced materials,
which are essential components of key enabling Semicap tools. |
| |
2. |
Display Capital Equipment Vertical: We see favorable near- and long-term demand trends for our Display
vertical. We expect strong sequential revenue growth in our current fourth quarter and throughout our fiscal 2025. |
| |
◾ |
Revenue. For the quarter, revenue in our Display Capital Equipment vertical was flat on a sequential
basis but increased by 4% year-over-year. |
| |
◾ |
Market Overview. The quarter reinforced our confidence as to an emerging multi-year Display upgrade
cycle with a recovery being underway that we expect to lead to sequential revenue growth in the fourth quarter of fiscal 2024 with further improvement in fiscal 2025 and beyond for our Display business. The third quarter marked a second straight
quarter of exceptionally strong double-digit order growth in our Display vertical. Key drivers of this improving demand include further OLED adoption in smartphones and accelerating OLED adoption in laptop computers and tablets, and both increasing
investments in Gen 6 fabs and announcements of construction of Gen 8 OLED fabs to address this expanding IT market opportunity and, in the case of service revenue, increased fab utilization and reduced inventories of Display service spare parts.
|
| |
◾ |
Excimer Laser Annealing Demand. As previously noted, this strengthening demand is showing up in
increasing demand for our excimer lasers. During the third quarter, we enjoyed a significant increase in orders for our excimer laser annealing systems for capacity expansions in several Gen 6 OLED fabs in China. The quarter also marked the highest
order level for new excimer systems in the past two years. We expect incremental strength from the buildout of Gen 8 OLED fabs, with the first Gen 8 groundbreaking in our preceding fiscal second quarter. |
| |
◾ |
Competitive Position. We continue to be the leading supplier to virtually all of the leading companies
in the Display vertical, and we enjoy a broad technology platform to address virtually all Display companies’ future roadmaps. Excimer laser annealing continues to account for the largest portion of our Display SAM. |
| |
◾ |
OLED. The long-term outlook for our Display excimer laser annealing business remains robust. We expect
meaningful incremental revenue growth in our Display vertical driven by further OLED adoption in smartphones and by investments in new Gen 8 OLED fabs for capacity expansion for larger substrates for laptop computers and tablets and by OLED adoption
in the automotive market. The move to larger OLED formats and new OLED display types will require new excimer laser annealing systems along with new lasers for cutting for new Gen 8 fabs. We are well positioned for both cutting and larger-format
annealing. We expect the IT display market to increase from approximately $6 billion in calendar 2023 to almost $14 billion in calendar 2026 with OLED displays growing by well over 100% from approximately $3 billion to approximately
$8 billion. |
| |
◾ |
China. China’s OLED sector has witnessed a significant uptick since the second half of calendar
2023. Anticipated bookings from Chinese customers via equipment integrators are expected to surpass $100 million in calendar 2024. During the third quarter, we received multiple orders for capacity expansion for Gen 6 fabs in China. In
addition, several Chinese display manufacturers are poised to invest in new Gen 8 OLED fabs to capitalize on the growing demand for OLED IT panels. |
23
| |
◾ |
New DPSS Laser: No Adverse Display Services Revenue Impact. We expect our new PYTHON DPSS laser and the
associated line-beam system to enhance our leading position in the OLED annealing market for larger IT displays. Successful annealing tests with various display customers have been performed and are still scheduled for the coming months. We do not
expect PYTHON deployments to result in customers decommissioning any of our existing deployed excimer laser systems. Accordingly, we do not expect ramp of PYTHON deployments to adversely impact our Display service revenue; rather, we expect PYTHON
to augment our service revenue given that each PYTHON system will generate service revenue with a compelling cost of ownership for our customers. |
| |
◾ |
MicroLED. Long-term Display Capital Equipment demand is also augmented by the emergence of the microLED
market and the adoption of laser lift-off and mass transfer processes. We received several additional orders from our OEM customers for both laser lift-off and laser
mass transfer equipment for end customers in China, Taiwan, and Korea. The publicly announced decision by a leading consumer smartwatch company to withdraw its microLED smartwatch project does not impact our assessment of the market opportunity.
Smartwatches have never been a focus area for our microLED display plans; rather, we remain focused on the large-format display opportunity for microLED. |
| |
◾ |
Service. Although still slightly below the level of two years ago, our Display service revenue increased
by almost 30% compared to the same quarter a year ago. While smartphone sales remain near the lowest level in a decade, several OLED fabs in Korea and China are seeing increased fab utilization, which combined with depleted inventory of service
spare parts has driven a meaningful sequential increase in our service business. We expect both increasing fab utilization and new excimer system laser installations to drive further longer-term recovery in our Laser service revenue.
|
| |
3. |
Precision Manufacturing Vertical: While macroeconomic uncertainty continues to present a challenge for
our Precision Manufacturing vertical, we continue to see a strong long-term outlook for this market driven by new product offerings that enhance our SAM and competitive position. An eventual macroeconomic rebound will especially affect
Precision Manufacturing demand, our most macro-impacted vertical in the Industrial market. |
| |
◾ |
Market Overview: Overall market conditions in Precision Manufacturing have stabilized but remain well
off previous levels in-line with the Purchasing Manager’s Index (PMI), a key market indicator for this vertical. Regionally, both China and North America are showing some signs of recovery. However,
Europe remains soft with an unclear outlook. We expect overall market improvement starting in fiscal 2025. Independent of, or over and above, recovery in market demand, we see a number of opportunities to drive significant incremental revenue growth
in this market vertical. These include ongoing customer penetration and revenue ramp for our ARM laser and line-beam forming system in the welding market, especially for EV batteries; re-entry into the fiber
laser cutting market with what we believe to be a best-in-class performance and lowest-cost platform; and ongoing success in the medical device manufacturing market.
|
24
| |
◾ |
Revenue. Third quarter revenue for our Precision Manufacturing vertical was relatively unchanged from
the preceding quarter but declined by 11% year-over-year. |
| |
◾ |
Electric Vehicles and EV Battery Assembly: Our key target market of Electric Vehicles (EVs) continues to
provide a healthy long-term market growth outlook of over 15% notwithstanding the recent industry pullback. We are especially excited by our expanding breadth and depth of customer penetration in EV battery welding—and the revenue growth
potential attending the pace of our cost reductions and performance improvements in our new ARM laser and beam delivery systems. |
| |
◾ |
Increasing Breadth and Depth of ARM Adoption. Our differentiated ARM laser and beam delivery systems are
enjoying increasing breadth and depth of customer penetration. Exceptionally strong ARM performance and results for EV battery welding are opening up new customer and market opportunities. We have now gained entrée for ARM into virtually
every major EV battery maker. We also have seen the inception of existing ARM customers leveraging our ARM laser systems in more conventional automotive welding applications. |
| |
◾ |
Fiber Laser Cutting. We are excited by the long-term revenue opportunity enabled by our re-entry into the fiber laser cutting market, leveraging the substantial level of vertical integration and breadth of technology differentiation resulting from the acquisition of Coherent, Inc. Taking advantage of
our new fiber laser platform, our complete vertically integrated in-feed of components including pump diodes, and our Chinese production footprint, we believe we will have the highest-performance and
lowest-cost platform for this market. |
| |
◾ |
Fiber Laser Component Demand In China. We are seeing a welcome uptick in demand for our fiber laser
component business in China driven by improving demand for fiber lasers both in China and for export abroad by Chinese customers. Our current generation of single-emitter diodes has seen good growth in demand along with our high-performance active
and passive fiber products. We continue to engage with customers regarding our new, very high-power chips. |
COMMUNICATIONS
Revenue. For the quarter, Communications revenue increased by 18% sequentially and by 14% year-over-year to $616 million. The
sequential increase was primarily driven by the ongoing ramp in our AI-related 800G Datacom transceiver revenue. Our non-800G Datacom revenue continues to be impacted by
inventory digestion and a shift in capex priorities toward AI by webscale customers. Our Telecom revenue continues to be impacted by inventory digestion along with delays in projects and capital expenditures by certain CSPs.
Datacom/Telecom. Datacom revenue increased by almost 30% sequentially and by almost 60% year-over-year to $463 million or approximately 75% of our
total Communications market revenue. Telecom revenue decreased by 6% sequentially and by 38% year-over-year to $153 million or 25% of our total Communications market revenue.
25
Communications Market Overview Webcast. As part of our ongoing effort to increase transparency and
enhance the understanding of our investors, we discussed our Communications market in greater detail on our September 19, 2023, Communications Market Overview webcast. A replay and investor presentation are available on our website at
coherent.com/company/investor-relations/financial-webcasts.
Follow-Up Investor Briefing From OFC.
We also hosted a follow-up in-depth discussion of our Communications market on March 26, 2024, at the OFC conference in San Diego. A replay and investor
presentation are available on our website at coherent.com/company/investor-relations/financial-webcasts.
Long-Term Demand Trends. We
continue to expect ongoing strong long-term growth in our Communications market driven by favorable secular trends in both our Datacom and Telecom businesses. Underlying our outlook:
| |
1. |
Datacom Vertical. We continue to expect strong long-term Datacom revenue growth based on our
backlog, order book, and strong customer engagements for AI-related datacenter buildouts. We currently project a 21% CAGR for all datacom transceivers from calendar 2023 to calendar 2028 largely driven by
growth in 800G and 1.6T. Near-term, we expect another quarter of strong sequential Datacom revenue growth for the current fourth quarter of fiscal 2024 followed by strong year-over-year growth for all of fiscal 2025. |
| |
◾ |
AI/ML. A fourth straight quarter of strong demand for our Datacom transceivers for AI-based datacenter buildouts reinforced our excitement as to the impact on our Datacom business from the rapid growth of AI/ML, especially generative AI. We also are excited by the ongoing strong interest we are
seeing from key customers for 1.6T transceivers along with 400G and 800G transceivers and components. Retooling of datacenter architectures and integration of AI clusters by webscale and other cloud ICP companies represent an immediate and direct
growth opportunity for our Datacom business—both our transceivers and our enabling active and passive components, especially leading-edge high-speed lasers. |
| |
◾ |
Implications of Recent AI Product Announcement. The recent announcement about next-generation AI
platforms from the market leader further reinforces our bullish view of the AI Datacom transceiver market. We note that in these new servers, the optical bandwidth per GPU has doubled along with a nine-fold increase in the number of GPUs. The front-end connectivity remains optical, and the back-end fabric remains electrical. We are also excited regarding the opportunity that some of the back-end fabric connectivity will present for optical penetration. |
| |
◾ |
More Than Just Datacom Transceivers. We see the longer-term benefit of AI/ML extending well beyond
Datacom transceivers to impact other product markets that we address and also to enable significant operating efficiencies across our organization. |
| |
◾ |
Webscale. These orders also reflect our strong technology platforms and competitive position relative to
webscale and cloud ICP AI/ML-driven datacenter deployments. For the quarter, webscale and large cloud ICP customers and customers that incorporate our transceivers in solutions sold to webscale and large cloud
ICP customers accounted for virtually all of our AI-driven 800G and the bulk of our overall Datacom transceiver revenue. Webscale customers directly and indirectly accounted for over 75% of our total Datacom
transceiver revenue for the quarter. |
26
| |
◾ |
Competitive Positioning. Our investments in high-speed lasers over multiple decades have placed us in a
unique position to meaningfully participate in the AI connectivity market, including for the upcoming 200G per optical lane era, required for 1.6T and eventually 3.2T Datacom transceivers, with multiple leading-edge laser platforms including DFB-MZs, EMLs, VCSELs, and high-power lasers for silicon photonics. We also believe we benefit from having production footprint both outside of and within China, which allows us to address all customers’
preferences as to manufacturing locations. We are focused on winning by time to market, time to volume, and time to performance advantages. |
| |
◾ |
1.6T. In response to customer demand, we continue to make progress toward expected commercial launch in
calendar 2025 and expect to ship commercial samples starting in the first quarter of fiscal 2025 of our 1.6T transceivers and components. We expect to be strongly positioned for the 1.6T market opportunity with multiple 200G-ready in-house technologies to choose from including EMLs, DFB-MZs, silicon photonics, and eventually 200G VCSELs. |
| |
◾ |
200G VCSELs. We have made great progress in overcoming technical hurdles toward commercializing our 200G
VCSELs. |
| |
◾ |
OCS. At the 2024 Optical Fiber Communications (OFC) conference, we announced and demonstrated our DLX
(Datacenter Lightwave Cross-Connect) optical circuit switch (OCS). DLX represents what we believe is a unique industry-leading solution that strongly positions us to address and capture a significant portion of what we expect to be a significant
incremental market opportunity within the next five years. DLX is based on the highly reliable and field-proven digital liquid crystal technology that we currently use in our wavelength selective switch (WSS) products. We have recent engagements
with several leading AI webscale companies. OCS deployment drives significantly enhanced operating efficiency and return on invested capital in AI architecture. |
| |
◾ |
Silicon Photonics. We have been shipping silicon photonics-based integrated coherent components and
transceivers for many years. This year, to address a segment of the AI-driven Datacom transceiver demand, we launched our silicon photonics-based 800G-DR8 Datacom
transceiver. This transceiver is ideal for use in machine learning and training networks that need a link reach longer than 100 meters or where our customers prefer a single-mode over a multimode fiber cabling infrastructure in shorter reaches. As
with all silicon photonics-based transceivers, an InP high-power continuous wave (CW) laser is needed to generate the light, and we are developing silicon photonics and InP high-power CW lasers to support our silicon photonics-based transceivers.
|
| |
◾ |
Linear Pluggable Optics (LPO). We do not view LPO as a risk. We believe that LPO will coexist with the
traditional retimed market, and we plan to support both. We see the LPO solution supporting a subset of the market, primarily where the customer owns both ends of the link. In addition, a new half-retimed optical standard (HRO) is
emerging, and if we see customer demand, we will support that as well. Each of these different standards is an architectural partitioning change but relies on the same underlying laser, modulator, and packaging technology, so deployment of one
over the other does not have a significant impact on the Company. |
27
| |
◾ |
Co-Packaged Optics (CPO). To meet the anticipated needs of the
future CPO market, we are well positioned to cover both single-mode and multimode infrastructure options for our customers. Our silicon photonics program, combined with our InP CW high-power lasers, will enable single-mode CPO applications or
designs. In addition, given the successful track record of multimode pluggable transceivers in addressing short-reach applications such as AI/ML/HPC connectivity, we are also working on a multimode CPO option, powered by our VCSELs. We anticipate
that the likely success of LPO will delay market adoption of CPO because LPO has most of the advantages of CPO (low power, low cost) while retaining all the valued advantages of a pluggable module (pay as you go, multiple solutions, multi-vendor
ecosystem) that have ensured their success in the market. However, we will be prepared if or when CPO gains traction, as CPO is just a form-factor transition from LPO. |
| |
◾ |
Components. Revenue for our Datacom components was relatively unchanged from the preceding quarter. We
expect growth for our Datacom components over the long-term to track growth for the overall Datacom market, i.e., we expect AI-related Datacom buildouts also to drive strong growth for our Datacom component
revenue. Our Datacom components include lasers, photodiodes, and advanced optics solutions such as lenses, gratings, isolators, and circulators. As an example of one of the use cases for these advanced optical components, our advanced optics
business unit has been supplying important components of optical circuit switches for the past several years. |
| |
2. |
Telecom Vertical. While the near-term outlook for the Telecom market remains challenged by customer
inventory digestion and by project delays at CSPs, we remain confident regarding our longer-term Telecom outlook. |
| |
◾ |
Near-Term. Recovery in our Telecom revenue has lagged our previous expectations, and we now expect
recovery in end demand will not arrive until late calendar 2024 or early calendar 2025. |
| |
◾ |
China. While the overall Telecom market remains challenging, the third quarter benefited from the
ongoing 400G C+L backbone network upgrades by all three primary China CSPs that commenced in the preceding quarter. Currently these deployments are driving improvement in our pump lasers, Telecom components, and WSS product line where we enjoy
market-leading technology. We expect to benefit from these new deployments well into fiscal 2025 in these product lines. We also have strong traction in China for our next-generation coherent transmission components that enable 800G and 400G
high-performance applications. We expect these to ramp to significant volume in fiscal 2025. |
| |
◾ |
Long-Term. We expect our Telecom SAM to grow at a double-digit CAGR from fiscal 2024 to fiscal 2029
above the overall market growth rate. Underlying our expectation for a return to secular Telecom revenue growth starting in fiscal 2025 is a rebound in end market demand and meaningful incremental growth from new products that we expect to
strengthen our competitive position in existing Telecom market segments. We also expect growth from new products that will expand our SAM by providing entreé into attractive—higher growth and higher margin—segments of the Telecom
market. We discuss these drivers in further detail below. |
28
| |
◾ |
Robust Design and Qualification Activity. In the third quarter, we saw further expansion of design-in activity at both CSPs and OEM customers for our unique 100G ZR Telecom transceiver family. This platform is based on our internally developed Steelerton DSP, targeted for edge network platforms. Our
industry pioneering 140 Gbaud IC-TROSA for 800G coherent applications has generated significant customer interest and design win opportunities. |
| |
◾ |
Share Gain. In Telecom, we are a vertically integrated market leader in several core businesses
including our pump lasers, ROADMs, amplifiers, network monitoring, and WSS products along with our coherent transceivers and disaggregated solutions. We believe we are gaining share at many of our key customers with our current product set and our
newer product platforms are seeing strong uptake in the industry. |
| |
◾ |
Exposure to Fast-Growth Segments. We are excited by our Telecom revenue growth outlook for fiscal 2025
and beyond as we are well positioned in key market segments and expect to benefit from the industry trend towards disaggregation, which benefits pluggable coherent transceivers and compact modular line systems, which are the fastest-growing segments
of our Telecom market. High-speed coherent transmission continues to be the driving force of Telecom growth due to the bandwidth requirements of datacenter interconnect (DCI) and broadband networks. DCI is driving high growth for 400/800G
pluggable coherent modules while edge and aggregation networks for broadband and 5G applications will drive 100G QSFP28 adoption. With the proliferation of AI datacenter clusters, we expect an increase in the demand for DCI and concomitantly for our
coherent transceivers. |
| |
◾ |
Coherent Optical Modules. We are especially excited about the number and quality of customer design wins
for our new 100G ZR and 400G ZR/ZR+ pluggable transceivers. Our 100G ZR QSFP28 transceiver is based on our own internally developed Steelerton DSP. We have secured design wins at the majority of the world’s Tier 1 NEMs for this new transceiver
module. In addition, we currently are qualified and beginning to ramp shipments of our 400G ZR/ZR+ transceivers and expect to commence ramping production and commercial shipments of our new 100G ZR family of transceivers in fiscal 2025. We also have
announced our new 800G ZR QSFP-DD coherent transceiver and shipped early samples in the first quarter of calendar 2024. |
ELECTRONICS
Revenue. Revenue for our
Electronics market decreased by 17% sequentially and by almost 50% year-over-year to $74 million for the third quarter driven by the previously disclosed design change at our largest Consumer Electronics customer that accounted for almost 10%
of revenue in fiscal 2023.
Near-Term Demand Trends. In the near term, revenue in our Electronics market should stabilize from the winding down of
the significant reduction in revenue in our Consumer Electronics revenue driven by the design change by our largest Consumer Electronics customer.
Long-Term. Our long-term outlook for robust growth in our Electronics market remains unchanged as discussed in greater detail below.
29
| |
◾ |
Revenue. Our revenue for our Silicon Carbide LLC subsidiary, which accounts for almost 100% of our
Automotive vertical revenue, fell short of our expectations due to a power failure. This power failure will result in our falling short of our previous expectation for $300 million in Silicon Carbide LLC revenue for all of fiscal 2024.
|
| |
◾ |
Market Overview. We remain both optimistic as to the long-term outlook for the silicon carbide market
and confident as to our competitive position. Our Transactions with Mitsubishi Electric and DENSO, including each of their $500 million investments (in exchange for 12.5% ownership interests—25% in the aggregate—in Silicon Carbide
LLC) and long-term supply agreements, have enhanced our confidence in our long-term revenue growth outlook for our silicon carbide business. That said, we have reduced our market growth outlook over the next five years. While sizable, approximately
50% EV sales growth in calendar 2023 fell short of industry expectations. EV demand has further moderated in calendar 2024 with new EV registrations having risen by only 15 percent in January, according to S&P Global Mobility. The primary
drivers of this moderating outlook include a decrease in EV demand due to increasing interest rates, shifts in consumer preferences, shifts in global OEMs’ EV strategies, and a rise in regulatory uncertainty. |
| |
2. |
Consumer Electronics Vertical. In the Consumer Electronics market, our focus is on providing diode
lasers for advanced sensing in mobile devices. |
| |
◾ |
Near-Term. As we have expected and highlighted over the past four quarters, our Consumer Electronics
revenue has declined to 3% of total revenue from 10% of total revenue in fiscal 2023 driven by a design change at our largest Consumer Electronics customer. The silver lining is that this expected decline is nearing completion, which we expect to
lead to stabilization in our Consumer Electronics revenue in the current fourth quarter and in fiscal 2025. |
| |
◾ |
Long-Term. Our longer-term outlook for Consumer Electronics, however, is driven by growth in breadth and
depth of sensing adoption well beyond 3D sensing for smartphones. AI applications are currently driving the need for the data provided by advanced sensors that serve as the eyes and ears of AI/ML systems. In addition, AI’s emerging, powerful
capabilities are underpinning new use cases to more effectively employ sensing functionality in a variety of markets and applications. This new market dynamic has triggered substantial activity to develop and deploy a variety of sensing solutions.
These include health monitoring and biosensing, metaverse AR/VR hardware and wearables, automotive LiDAR and in-cabin sensing, and other emerging applications. |
| |
◾ |
Market Position. We are excited by our strategic engagements across all of these applications, with the
breadth and pace of our sensing design-in activities at record levels. A key competitive differentiator for this market is provided by our broad semiconductor laser platform of integrated sensing solutions
that spans from 850 |
30
| |
nm to 2400 nm and three semiconductor laser material platforms that complement our expertise in integrated circuits (ICs), packaging, and full solutions for a variety of applications. We have a
number of new platforms that we expect to enhance our already strong competitive position including multi-junction VCSELs, backside-emitting VCSELs, and InP sensors and detectors for biosensing. |
| |
◾ |
AR/VR/MR. We are expanding our offerings into AR/VR, wearable electronics, and domestic robotics, with
illumination modules for diverse sensing applications as well as innovative optics solutions for AR/VR displays. During the third quarter, we continued to strengthen our strategic engagements, particularly in the AR/VR/MR and wearables market
segments. As this technology gradually evolves, is more widely adopted, and integrates more advanced sensing features, we are well positioned to serve the market with differentiated solutions based on our opto-semiconductor and optics material
platforms. |
| |
◾ |
Industry Leading 6-Inch Indium Phosphide Platform. We were the
first supplier to announce a 6-inch indium phosphide platform that we plan to leverage in our future product roadmap for high-volume applications in advanced sensing, biosensing, and other emerging
applications. |
INSTRUMENTATION
Instrumentation Market Overview Webcast. As part of our ongoing effort to increase transparency and enhance the understanding of our investors, we plan
to discuss our Instrumentation market in greater detail on May 14, 2024, on the third installment of our “Market Overview” webcast series, which will be webcast and available for replay afterward on our website at
coherent.com/company/investor-relations/financial-webcasts.
Revenue. Third quarter revenue for our Instrumentation market was flat
sequentially but decreased by approximately 2% year-over-year to $98 million. Both our Life Sciences and our Scientific Instrumentation verticals were relatively flat on a sequential basis. Our Life Sciences vertical was the primary driver of
the year-over-year decrease.
Demand Trends. We remain excited regarding the long-term growth opportunity in the Instrumentation market. Near-term,
demand in our Instrumentation market appears to have stabilized with a third straight quarter of just under $100 million in revenue. Elevated inventories appear to have been reduced to and may have reached normalized levels; however, we have
yet to see a return to sequential or year-over-year growth, and our revenue remains approximately 15 – 20% below its fiscal 2023 level primarily due to macroeconomic uncertainty. We expect relatively stable Instrumentation revenue for the
current fourth quarter of fiscal 2024 with a return to revenue commencing in fiscal 2025. We believe Instrumentation platform developers and end users have used the post-Covid recovery period to increase operating efficiencies and to shift their
focus to new R&D projects that will start to drive incremental market demand within the next year. We expect a leveling off through the balance of fiscal 2024, with a return to growth in our Instrumentation market revenue commencing in fiscal
2025. We remain excited regarding the long-term growth opportunity in this market. Our long-term outlook for a return to high single-digit revenue growth in our Instrumentation market is discussed at greater length below.
31
| |
1. |
Life Sciences Vertical. In the wake of the Coherent, Inc., acquisition, we have been showcasing our
combined expansive bioinstrumentation portfolio and unparalleled integrated subsystem capabilities to the leading global biotechnology and medical instrumentation manufacturers. These customers have been excited about the integration of our broad
portfolio of lasers, materials, optics, and thermoelectric products into subassemblies. These higher-level integrated solutions deliver significant value in terms of reduced cost and improved performance. Within the Biotechnology market, we continue
to partner with leading innovators in flow cytometry, sequencing, PCR, and Imaging. Laser bookings for these applications increased by almost 30% sequentially and exceeded, albeit slightly, the year-ago level.
We also have a variety of laser products to address therapeutic medical laser applications, ranging from semiconductor lasers for dermatology applications to excimer lasers for LASIK procedures. In ophthalmology, we are working with some of the
largest companies in the industry to establish long-term supply agreements. Laser bookings also sequentially increased by almost 30% in the third quarter. The envelope of laser applications in therapeutics continues to expand and regulatory agencies
worldwide continue to expand approvals. We are excited about our involvement in next-generation instrumentation that is enabling disease research and detection and leading the way to personalized medicine. |
| |
2. |
Scientific Instrumentation Vertical. We continue to see soft demand in our Scientific
Instrumentation vertical within our Instrumentation market due to delayed capital expenditures and uncertain funding. For a third straight quarter, our Scientific Instrumentation revenue was in the
low-$30 million range in the third quarter. Research in Life Sciences (neuroscience, cell biology, and disease studies) as well as exotic spectroscopy of materials and complex organic molecules drive most
of the research expenditures in lasers. Demand remains subdued, but stable, tracking global government funding of research. Demand remains primarily focused on our exceptional line of scientific laser modules and systems to support cutting edge
research. |
REGIONAL TRENDS
The
Americas: 57% of revenue in the quarter; sequential 10% increase; year-over-year 5% increase. The primary drivers of the sequential and year-over-year increases were the revenue ramp for our AI-related
800G Datacom transceivers, which more than offset a sequential and year-over-year revenue decline in the Americas region in our Materials segment that was largely driven by the expected reduction in demand in our Consumer Electronics revenue due to
a design change by our largest Consumer Electronics customer (that we have highlighted for the past four quarters). Our revenue in the Americas region in our Lasers segment and in our Industrial and Instrumentation markets was relatively flat both
sequentially and year-over-year.
Europe: 15% of revenue in the quarter; sequential 14% increase; year-over-year 25% decrease. Demand in the
Industrial market continues to be challenged primarily due to ongoing macroeconomic uncertainty, with weakness in Germany having a particularly pronounced impact, a temporary slowdown in EUV demand, and continued softness in the Telecom vertical.
China: 13% of revenue in the quarter; sequential 5% decrease; year-over-year 14% increase. We saw the start of a rebound in our Telecom business
in China in the second quarter that we expect to extend through the balance of fiscal 2024 and throughout fiscal 2025. Higher display fab utilization also resulted in higher service revenue for the quarter.
32
Korea and Japan: 13% of revenue in the quarter; sequential 2% decrease; year-over-year 9% decrease.
Macroeconomic uncertainty continues to present near-term challenges in Korea and Japan. However, we have secured important design wins in our Semicap vertical in the region and are starting to see an increase in Display demand driven by further OLED
penetration into smartphones, and adoption into laptop computers and tablets. We expect further improvement in the fourth quarter of fiscal 2024 led by stronger Laser service demand. Longer-term, we expect to see a significant increase in demand in
Korea and Japan for our Industrial and Instrumentation businesses, especially from OLED Gen 6 fab expansions, new Gen 8 fab builds and, eventually, microLED builds.
33
PART V - FINANCIAL TABLES
Table 3
Coherent Corp. and Subsidiaries
Condensed Consolidated Statements of Earnings (Loss) *
|
|
|
|
|
|
|
|
|
|
|
|
|
| |
|
THREE MONTHS ENDED |
|
| $ Millions, except per share and percentage amounts
(unaudited) |
|
Mar 31
2024 |
|
|
Dec 31
2023 |
|
|
Mar 31
2023 |
|
|
|
|
|
|
|
|
|
|
|
|
|
|
| Revenues |
|
$ |
1,208.8 |
|
|
$ |
1,131.4 |
|
|
$ |
1,240.2 |
|
|
|
|
|
|
|
|
|
|
|
|
|
|
| Costs, Expenses & Other Expense (Income) |
|
|
|
|
|
|
|
|
|
|
|
|
| Cost of goods sold |
|
|
842.3 |
|
|
|
780.8 |
|
|
|
820.0 |
|
| Internal research and development |
|
|
127.5 |
|
|
|
111.2 |
|
|
|
126.4 |
|
| Selling, general and administrative |
|
|
205.2 |
|
|
|
209.2 |
|
|
|
226.4 |
|
| Restructuring charges (recoveries) |
|
|
11.5 |
|
|
|
(1.6 |
) |
|
|
— |
|
| Interest expense |
|
|
72.8 |
|
|
|
74.7 |
|
|
|
75.2 |
|
| Other expense (income), net |
|
|
(18.6 |
) |
|
|
(5.4 |
) |
|
|
(3.0 |
) |
|
|
|
|
|
|
|
|
|
|
|
|
|
| Total Costs, Expenses, & Other Expense |
|
|
1,240.7 |
|
|
|
1,168.8 |
|
|
|
1,244.9 |
|
|
|
|
|
|
|
|
|
|
|
|
|
|
|
|
|
|
|
|
|
|
|
|
|
|
|
| Loss Before Income Taxes |
|
|
(31.9 |
) |
|
|
(37.4 |
) |
|
|
(4.7 |
) |
|
|
|
|
|
|
|
|
|
|
|
|
|
| Income Taxes |
|
|
(16.1 |
) |
|
|
(8.9 |
) |
|
|
(7.3 |
) |
|
|
|
|
|
|
|
|
|
|
|
|
|
|
|
|
|
|
|
|
|
|
|
|
|
|
| Net Earnings (Loss) |
|
|
(15.7 |
) |
|
|
(28.5 |
) |
|
|
2.5 |
|
| Net Loss Attributable to Noncontrolling Interests |
|
|
(2.5 |
) |
|
|
(1.5 |
) |
|
|
— |
|
|
|
|
|
|
|
|
|
|
|
|
|
|
| Net Earnings (Loss) Attributable to Coherent Corp. |
|
$ |
(13.2 |
) |
|
$ |
(27.0 |
) |
|
$ |
2.5 |
|
|
|
|
|
|
|
|
|
|
|
|
|
|
|
|
|
|
|
|
|
|
|
|
|
|
|
| Less: Dividends on Preferred Stock |
|
|
31.2 |
|
|
|
30.6 |
|
|
|
36.1 |
|
|
|
|
|
|
|
|
|
|
|
|
|
|
| Net Loss Available to the Common Shareholders |
|
$ |
(44.4 |
) |
|
$ |
(57.6 |
) |
|
$ |
(33.5 |
) |
|
|
|
|
|
|
|
|
|
|
|
|
|
|
|
|
|
|
|
|
|
|
|
|
|
|
| Basic Loss Per Share |
|
$ |
(0.29 |
) |
|
$ |
(0.38 |
) |
|
$ |
(0.24 |
) |
|
|
|
|
|
|
|
|
|
|
|
|
|
|
|
|
|
|
|
|
|
|
|
|
|
|
| Diluted Loss Per Share |
|
$ |
(0.29 |
) |
|
$ |
(0.38 |
) |
|
$ |
(0.24 |
) |
|
|
|
|
|
|
|
|
|
|
|
|
|
|
|
|
|
|
|
|
|
|
|
|
|
|
| Average Shares Outstanding - Basic |
|
|
152.1 |
|
|
|
151.6 |
|
|
|
139.1 |
|
| Average Shares Outstanding - Diluted |
|
|
152.1 |
|
|
|
151.6 |
|
|
|
139.1 |
|
|
|
|
|
|
|
|
|
|
|
|
|
|
| * |
Amounts may not recalculate due to rounding. |
34
Table 3
Coherent Corp. and Subsidiaries
Condensed Consolidated Statements of Earnings (Loss) *
(Continued)
|
|
|
|
|
|
|
|
|
| |
|
NINE MONTHS ENDED |
|
| $ Millions, except per share and percentage amounts
(unaudited) |
|
Mar 31
2024 |
|
|
Mar 31
2023 |
|
|
|
|
|
|
|
|
|
|
| Revenues |
|
$ |
3,393.3 |
|
|
$ |
3,955.0 |
|
|
|
|
|
|
|
|
|
|
| Costs, Expenses & Other Expense (Income) |
|
|
|
|
|
|
|
|
| Cost of goods sold |
|
|
2,369.3 |
|
|
|
2,680.1 |
|
| Internal research and development |
|
|
352.1 |
|
|
|
376.3 |
|
| Selling, general and administrative |
|
|
626.0 |
|
|
|
780.6 |
|
| Restructuring charges |
|
|
13.0 |
|
|
|
— |
|
| Interest expense |
|
|
220.7 |
|
|
|
208.0 |
|
| Other expense (income), net |
|
|
(30.3 |
) |
|
|
32.3 |
|
|
|
|
|
|
|
|
|
|
| Total Costs, Expenses, & Other Expense (Income) |
|
|
3,550.9 |
|
|
|
4,077.2 |
|
|
|
|
|
|
|
|
|
|
|
|
|
|
|
|
|
|
|
| Loss Before Income Taxes |
|
|
(157.6 |
) |
|
|
(122.1 |
) |
|
|
|
|
|
|
|
|
|
| Income Taxes |
|
|
(45.8 |
) |
|
|
(40.9 |
) |
|
|
|
|
|
|
|
|
|
|
|
|
|
|
|
|
|
|
| Net Loss |
|
|
(111.7 |
) |
|
|
(81.2 |
) |
| Net Loss Attributable to Noncontrolling Interests |
|
|
(4.0 |
) |
|
|
— |
|
|
|
|
|
|
|
|
|
|
| Net Loss Attributable to Coherent Corp. |
|
$ |
(107.7 |
) |
|
$ |
(81.2 |
) |
|
|
|
|
|
|
|
|
|
|
|
|
|
|
|
|
|
|
| Less: Dividends on Preferred Stock |
|
|
91.9 |
|
|
|
107.5 |
|
|
|
|
|
|
|
|
|
|
| Net Loss Available to the Common Shareholders |
|
$ |
(199.7 |
) |
|
$ |
(188.8 |
) |
|
|
|
|
|
|
|
|
|
|
|
|
|
|
|
|
|
|
| Basic Loss Per Share |
|
$ |
(1.32 |
) |
|
$ |
(1.38 |
) |
|
|
|
|
|
|
|
|
|
|
|
|
|
|
|
|
|
|
| Diluted Loss Per Share |
|
$ |
(1.32 |
) |
|
$ |
(1.38 |
) |
|
|
|
|
|
|
|
|
|
| Average Shares Outstanding - Basic |
|
|
151.3 |
|
|
|
137.0 |
|
| Average Shares Outstanding - Diluted |
|
|
151.3 |
|
|
|
137.0 |
|
|
|
|
|
|
|
|
|
|
| * |
Amounts may not recalculate due to rounding. |
35
Table 4
Coherent Corp. and Subsidiaries
Condensed Consolidated Balance Sheets *
|
|
|
|
|
|
|
|
|
| $ Millions (unaudited) |
|
March 31
2024 |
|
|
June 30
2023 |
|
|
|
|
|
|
|
|
|
|
| Assets |
|
|
|
|
|
|
|
|
| Current Assets |
|
|
|
|
|
|
|
|
| Cash and cash equivalents |
|
$ |
898.6 |
|
|
$ |
821.3 |
|
| Restricted cash, current |
|
|
183.6 |
|
|
|
12.0 |
|
| Accounts receivable |
|
|
955.6 |
|
|
|
901.5 |
|
| Inventories |
|
|
1,291.7 |
|
|
|
1,272.3 |
|
| Prepaid and refundable income taxes |
|
|
19.0 |
|
|
|
28.3 |
|
| Prepaid and other current assets |
|
|
201.7 |
|
|
|
216.5 |
|
|
|
|
|
|
|
|
|
|
| Total Current Assets |
|
|
3,550.2 |
|
|
|
3,252.0 |
|
| Property, plant & equipment, net |
|
|
1,851.4 |
|
|
|
1,782.0 |
|
| Goodwill |
|
|
4,493.2 |
|
|
|
4,512.7 |
|
| Other intangible assets, net |
|
|
3,586.3 |
|
|
|
3,814.7 |
|
| Deferred income taxes |
|
|
39.5 |
|
|
|
37.7 |
|
| Restricted cash, non-current |
|
|
710.3 |
|
|
|
4.2 |
|
| Other assets |
|
|
289.5 |
|
|
|
307.7 |
|
|
|
|
|
|
|
|
|
|
| Total Assets |
|
$ |
14,520.4 |
|
|
$ |
13,711.1 |
|
|
|
|
|
|
|
|
|
|
|
|
|
|
|
|
|
|
|
| Liabilities, Mezzanine Equity and Equity |
|
|
|
|
|
|
|
|
| Current Liabilities |
|
|
|
|
|
|
|
|
| Current portion of long-term debt |
|
$ |
75.5 |
|
|
$ |
74.8 |
|
| Accounts payable |
|
|
593.5 |
|
|
|
405.3 |
|
| Operating lease current liabilities |
|
|
38.3 |
|
|
|
38.3 |
|
| Accruals and other current liabilities |
|
|
603.3 |
|
|
|
560.3 |
|
|
|
|
|
|
|
|
|
|
| Total Current Liabilities |
|
|
1,310.6 |
|
|
|
1,078.7 |
|
| Long-term debt |
|
|
4,082.7 |
|
|
|
4,235.0 |
|
| Deferred income taxes |
|
|
748.5 |
|
|
|
780.3 |
|
| Operating lease liabilities |
|
|
138.3 |
|
|
|
140.7 |
|
| Other liabilities |
|
|
201.2 |
|
|
|
247.4 |
|
|
|
|
|
|
|
|
|
|
| Total Liabilities |
|
|
6,481.3 |
|
|
|
6,482.2 |
|
| Total Mezzanine Equity |
|
|
2,333.4 |
|
|
|
2,241.4 |
|
| Total Coherent Corp. Shareholders’ Equity |
|
|
5,335.5 |
|
|
|
4,987.6 |
|
| Noncontrolling interests |
|
|
370.3 |
|
|
|
— |
|
|
|
|
|
|
|
|
|
|
| Total Equity |
|
|
5,705.8 |
|
|
|
4,987.6 |
|
|
|
|
|
|
|
|
|
|
| Total Liabilities, Mezzanine Equity and Equity |
|
$ |
14,520.4 |
|
|
$ |
13,711.1 |
|
|
|
|
|
|
|
|
|
|
| |
|
|
|
|
|
|
|
|
| * |
Amounts may not recalculate due to rounding. |
36
Table 5
Coherent Corp. and Subsidiaries
Condensed Consolidated Statements of Cash Flows *
|
|
|
|
|
|
|
|
|
| |
|
NINE MONTHS ENDED |
|
| $ Millions (unaudited) |
|
Mar 31
2024 |
|
|
Mar 31
2023 |
|
|
|
|
|
|
|
|
|
|
| Cash Flows from Operating Activities |
|
|
|
|
|
|
|
|
| Net cash provided by operating activities |
|
$ |
383.4 |
|
|
$ |
452.5 |
|
|
|
|
|
|
|
|
|
|
|
|
|
|
|
|
|
|
|
| Cash Flows from Investing Activities |
|
|
|
|
|
|
|
|
| Additions to property, plant & equipment |
|
|
(246.9 |
) |
|
|
(343.0 |
) |
| Purchases of businesses, net of cash acquired |
|
|
— |
|
|
|
(5,488.6 |
) |
| Other investing activities |
|
|
(2.1 |
) |
|
|
(2.3 |
) |
|
|
|
|
|
|
|
|
|
| Net cash used in investing activities |
|
|
(249.0 |
) |
|
|
(5,833.8 |
) |
|
|
|
|
|
|
|
|
|
|
|
|
|
|
|
|
|
|
| Cash Flows from Financing Activities |
|
|
|
|
|
|
|
|
| Contributions from noncontrolling interest holders |
|
|
1,000.0 |
|
|
|
— |
|
| Proceeds from borrowings of Term A Facility |
|
|
— |
|
|
|
850.0 |
|
| Proceeds from borrowings of Term B Facility |
|
|
— |
|
|
|
2,800.0 |
|
| Proceeds from borrowings of revolving credit facilities |
|
|
19.0 |
|
|
|
65.0 |
|
| Proceeds from issuance of Series B preferred shares |
|
|
— |
|
|
|
1,400.0 |
|
| Payments on existing debt |
|
|
(165.1 |
) |
|
|
(1,144.0 |
) |
| Payments on borrowings under revolving credit facilities |
|
|
(18.6 |
) |
|
|
(65.0 |
) |
| Debt issuance costs |
|
|
— |
|
|
|
(126.5 |
) |
| Equity issuance costs |
|
|
(31.8 |
) |
|
|
(42.0 |
) |
| Proceeds from exercises of stock options |
|
|
36.1 |
|
|
|
21.5 |
|
| Payment on convertible notes |
|
|
— |
|
|
|
(3.6 |
) |
| Payments in satisfaction of employees’ minimum tax obligations |
|
|
(18.8 |
) |
|
|
(51.8 |
) |
| Payment of dividends |
|
|
— |
|
|
|
(20.7 |
) |
| Other financing activities |
|
|
(0.8 |
) |
|
|
(0.9 |
) |
|
|
|
|
|
|
|
|
|
| Net cash provided by financing activities |
|
|
819.9 |
|
|
|
3,682.0 |
|
|
|
|
|
|
|
|
|
|
|
|
|
|
|
|
|
|
|
| Effect of exchange rate changes on cash and cash equivalents |
|
|
0.6 |
|
|
|
22.5 |
|
|
|
|
|
|
|
|
|
|
| Net increase (decrease) in cash and cash equivalents |
|
|
954.9 |
|
|
|
(1,676.8 |
) |
|
|
|
|
|
|
|
|
|
| Cash, Cash Equivalents, and Restricted Cash at Beginning of Period |
|
|
837.6 |
|
|
|
2,582.4 |
|
|
|
|
|
|
|
|
|
|
|
|
|
|
|
|
|
|
|
|
|
|
|
|
|
|
|
|
| Cash, Cash Equivalents, and Restricted Cash at End of Period |
|
$ |
1,792.5 |
|
|
$ |
905.6 |
|
|
|
|
|
|
|
|
|
|
|
|
|
|
|
|
|
|
|
| * |
Amounts may not recalculate due to rounding. |
37
Table 6
Segment Revenues, GAAP Operating Income (Loss) & Margins and Non-GAAP Operating Income (Loss) & Margins*
|
|
|
|
|
|
|
|
|
|
|
|
|
|
|
|
|
|
|
|
|
| |
|
THREE MONTHS ENDED |
|
|
NINE MONTHS ENDED |
|
| $ Millions, except percentage amounts (unaudited) |
|
Mar 31
2024 |
|
|
Dec 31
2023 |
|
|
Mar 31
2023 |
|
|
Mar 31
2024 |
|
|
Mar 31
2023 |
|
|
|
|
|
|
|
|
|
|
|
|
|
|
|
|
|
|
|
|
|
|
| Revenues: |
|
|
|
|
|
|
|
|
|
|
|
|
|
|
|
|
|
|
|
|
| Networking |
|
$ |
618.8 |
|
|
$ |
524.2 |
|
|
$ |
551.1 |
|
|
$ |
1,615.9 |
|
|
$ |
1,756.3 |
|
| Materials |
|
|
239.0 |
|
|
|
253.7 |
|
|
|
323.8 |
|
|
|
737.3 |
|
|
|
1,061.8 |
|
| Lasers |
|
|
351.0 |
|
|
|
353.5 |
|
|
|
365.3 |
|
|
|
1,040.1 |
|
|
|
1,136.9 |
|
|
|
|
|
|
|
|
|
|
|
|
|
|
|
|
|
|
|
|
|
|
| Consolidated |
|
$ |
1,208.8 |
|
|
$ |
1,131.4 |
|
|
$ |
1,240.2 |
|
|
$ |
3,393.3 |
|
|
$ |
3,955.0 |
|
|
|
|
|
|
|
|
|
|
|
|
|
|
|
|
|
|
|
|
|
|
|
|
|
|
|
|
|
|
|
|
|
|
|
|
|
|
|
|
|
|
|
| GAAP Operating Income (Loss): |
|
|
|
|
|
|
|
|
|
|
|
|
|
|
|
|
|
|
|
|
| Networking |
|
$ |
58.2 |
|
|
$ |
47.5 |
|
|
$ |
49.5 |
|
|
$ |
122.0 |
|
|
$ |
230.5 |
|
| Materials |
|
|
8.2 |
|
|
|
9.8 |
|
|
|
67.8 |
|
|
|
25.2 |
|
|
|
224.6 |
|
| Lasers |
|
|
(44.1 |
) |
|
|
(25.4 |
) |
|
|
(49.9 |
) |
|
|
(114.3 |
) |
|
|
(337.0 |
) |
|
|
|
|
|
|
|
|
|
|
|
|
|
|
|
|
|
|
|
|
|
| Consolidated |
|
$ |
22.3 |
|
|
$ |
31.9 |
|
|
$ |
67.4 |
|
|
$ |
32.9 |
|
|
$ |
118.1 |
|
|
|
|
|
|
|
|
|
|
|
|
|
|
|
|
|
|
|
|
|
|
|
|
|
|
|
|
|
|
|
|
|
|
|
|
|
|
|
|
|
|
|
| Non-GAAP Operating Income: |
|
|
|
|
|
|
|
|
|
|
|
|
|
|
|
|
|
|
|
|
| Networking |
|
$ |
90.4 |
|
|
$ |
75.0 |
|
|
$ |
74.7 |
|
|
$ |
215.1 |
|
|
$ |
310.2 |
|
| Materials |
|
|
50.3 |
|
|
|
42.1 |
|
|
|
89.0 |
|
|
|
134.6 |
|
|
|
286.1 |
|
| Lasers |
|
|
41.5 |
|
|
|
54.5 |
|
|
|
53.4 |
|
|
|
136.5 |
|
|
|
185.0 |
|
|
|
|
|
|
|
|
|
|
|
|
|
|
|
|
|
|
|
|
|
|
| Consolidated |
|
$ |
182.2 |
|
|
$ |
171.6 |
|
|
$ |
217.1 |
|
|
$ |
486.2 |
|
|
$ |
781.3 |
|
|
|
|
|
|
|
|
|
|
|
|
|
|
|
|
|
|
|
|
|
|
|
|
|
|
|
|
|
|
|
|
|
|
|
|
|
|
|
|
|
|
|
| GAAP Operating Margin (Loss): |
|
|
|
|
|
|
|
|
|
|
|
|
|
|
|
|
|
|
|
|
| Networking |
|
|
9.4 |
% |
|
|
9.1 |
% |
|
|
9.0 |
% |
|
|
7.5 |
% |
|
|
13.1 |
% |
| Materials |
|
|
3.4 |
% |
|
|
3.9 |
% |
|
|
20.9 |
% |
|
|
3.4 |
% |
|
|
21.2 |
% |
| Lasers |
|
|
(12.6 |
)% |
|
|
(7.2 |
)% |
|
|
(13.7 |
)% |
|
|
(11.0 |
)% |
|
|
(29.6 |
)% |
| Consolidated |
|
|
1.8 |
% |
|
|
2.8 |
% |
|
|
5.4 |
% |
|
|
1.0 |
% |
|
|
3.0 |
% |
|
|
|
|
|
|
|
|
|
|
|
|
|
|
|
|
|
|
|
|
|
| Non-GAAP Operating Margin: |
|
|
|
|
|
|
|
|
|
|
|
|
|
|
|
|
|
|
|
|
| Networking |
|
|
14.6 |
% |
|
|
14.3 |
% |
|
|
13.6 |
% |
|
|
13.3 |
% |
|
|
17.7 |
% |
| Materials |
|
|
21.0 |
% |
|
|
16.6 |
% |
|
|
27.5 |
% |
|
|
18.3 |
% |
|
|
26.9 |
% |
| Lasers |
|
|
11.8 |
% |
|
|
15.4 |
% |
|
|
14.6 |
% |
|
|
13.1 |
% |
|
|
16.3 |
% |
| Consolidated |
|
|
15.1 |
% |
|
|
15.2 |
% |
|
|
17.5 |
% |
|
|
14.3 |
% |
|
|
19.8 |
% |
|
|
|
|
|
|
|
|
|
|
|
|
|
|
|
|
|
|
|
|
|
| * |
Amounts may not recalculate due to rounding. |
38
Table 7
Reconciliation of GAAP Segment Operating Income (Loss) to Segment Non-GAAP Operating Income (Loss)*
|
|
|
|
|
|
|
|
|
|
|
|
|
|
|
|
|
|
|
|
|
| |
|
THREE MONTHS ENDED |
|
|
NINE MONTHS ENDED |
|
| |
|
|
|
|
|
|
| $ Millions (unaudited) |
|
Mar 31
2024 |
|
|
Dec 31
2023 |
|
|
Mar 31
2023 |
|
|
Mar 31
2024 |
|
|
Mar 31
2023 |
|
|
|
|
|
|
|
|
|
|
|
|
|
|
|
|
|
|
|
|
|
|
|
|
|
|
|
|
|
|
|
|
|
|
|
|
|
|
|
|
|
|
|
| Networking GAAP Operating Income |
|
$ |
58.2 |
|
|
$ |
47.5 |
|
|
$ |
49.5 |
|
|
$ |
122.0 |
|
|
$ |
230.5 |
|
| Share-based compensation |
|
|
6.7 |
|
|
|
6.6 |
|
|
|
6.9 |
|
|
|
23.5 |
|
|
|
26.0 |
|
| Amortization of acquired intangibles |
|
|
16.0 |
|
|
|
16.0 |
|
|
|
16.5 |
|
|
|
48.3 |
|
|
|
49.4 |
|
| Restructuring recoveries(1) |
|
|
(0.2 |
) |
|
|
(3.1 |
) |
|
|
— |
|
|
|
(5.3 |
) |
|
|
— |
|
| Integration, site consolidation and
other(2) |
|
|
9.7 |
|
|
|
8.0 |
|
|
|
1.8 |
|
|
|
26.6 |
|
|
|
4.3 |
|
|
|
|
|
|
|
|
|
|
|
|
|
|
|
|
|
|
|
|
|
|
| Non-GAAP Networking Operating Income |
|
$ |
90.4 |
|
|
$ |
75.0 |
|
|
$ |
74.7 |
|
|
$ |
215.1 |
|
|
$ |
310.2 |
|
|
|
|
|
|
|
|
|
|
|
|
|
|
|
|
|
|
|
|
|
|
|
|
|
|
|
|
|
|
|
|
|
|
|
|
|
|
|
|
|
|
|
| Materials GAAP Operating Income |
|
$ |
8.2 |
|
|
$ |
9.8 |
|
|
$ |
67.8 |
|
|
$ |
25.2 |
|
|
$ |
224.6 |
|
| Share-based compensation |
|
|
9.0 |
|
|
|
9.2 |
|
|
|
10.7 |
|
|
|
34.6 |
|
|
|
40.7 |
|
| Amortization of acquired intangibles |
|
|
2.6 |
|
|
|
2.4 |
|
|
|
3.2 |
|
|
|
7.6 |
|
|
|
9.7 |
|
| Restructuring charges(1) |
|
|
8.1 |
|
|
|
1.5 |
|
|
|
— |
|
|
|
14.6 |
|
|
|
— |
|
| Integration, site consolidation and
other(2) |
|
|
21.9 |
|
|
|
18.6 |
|
|
|
7.3 |
|
|
|
51.1 |
|
|
|
11.1 |
|
| Start-up costs(4) |
|
|
0.5 |
|
|
|
0.6 |
|
|
|
— |
|
|
|
1.5 |
|
|
|
— |
|
|
|
|
|
|
|
|
|
|
|
|
|
|
|
|
|
|
|
|
|
|
| Non-GAAP Materials Operating Income |
|
$ |
50.3 |
|
|
$ |
42.1 |
|
|
$ |
89.0 |
|
|
$ |
134.6 |
|
|
$ |
286.1 |
|
|
|
|
|
|
|
|
|
|
|
|
|
|
|
|
|
|
|
|
|
|
|
|
|
|
|
|
|
|
|
|
|
|
|
|
|
|
|
|
|
|
|
| Lasers GAAP Operating Loss |
|
$ |
(44.1 |
) |
|
$ |
(25.4 |
) |
|
$ |
(49.9 |
) |
|
$ |
(114.3 |
) |
|
$ |
(337.0 |
) |
| Share-based compensation |
|
|
10.7 |
|
|
|
11.5 |
|
|
|
17.5 |
|
|
|
40.1 |
|
|
|
56.5 |
|
| Amortization of acquired intangibles |
|
|
53.7 |
|
|
|
53.1 |
|
|
|
73.0 |
|
|
|
160.6 |
|
|
|
221.5 |
|
| Restructuring charges(1) |
|
|
3.6 |
|
|
|
— |
|
|
|
— |
|
|
|
3.6 |
|
|
|
— |
|
| Integration, site consolidation and
other(2) |
|
|
17.6 |
|
|
|
15.3 |
|
|
|
12.8 |
|
|
|
46.5 |
|
|
|
47.8 |
|
| Transaction fees and financing(3) |
|
|
— |
|
|
|
— |
|
|
|
— |
|
|
|
— |
|
|
|
38.7 |
|
| Fair value adjustment on acquired inventory |
|
|
— |
|
|
|
— |
|
|
|
— |
|
|
|
— |
|
|
|
157.5 |
|
|
|
|
|
|
|
|
|
|
|
|
|
|
|
|
|
|
|
|
|
|
| Non-GAAP Lasers Operating Income |
|
$ |
41.5 |
|
|
$ |
54.5 |
|
|
$ |
53.4 |
|
|
$ |
136.5 |
|
|
$ |
185.0 |
|
|
|
|
|
|
|
|
|
|
|
|
|
|
|
|
|
|
|
|
|
|
|
|
|
|
|
|
|
|
|
|
|
|
|
|
|
|
|
|
|
|
|
|
|
|
|
|
|
|
|
|
|
|
|
|
|
|
|
|
|
|
|
|
| Total GAAP Operating Income |
|
$ |
22.3 |
|
|
$ |
31.9 |
|
|
$ |
67.4 |
|
|
$ |
32.9 |
|
|
$ |
118.1 |
|
|
|
|
|
|
|
|
|
|
|
|
|
|
|
|
|
|
|
|
|
|
|
|
|
|
|
|
|
|
|
|
|
|
|
|
|
|
|
|
|
|
|
|
|
|
|
|
|
|
|
|
|
|
|
|
|
|
|
|
|
|
|
|
| Non-GAAP Operating Income |
|
$ |
182.2 |
|
|
$ |
171.6 |
|
|
$ |
217.1 |
|
|
$ |
486.2 |
|
|
$ |
781.3 |
|
|
|
|
|
|
|
|
|
|
|
|
|
|
|
|
|
|
|
|
|
|
|
|
|
|
|
|
|
|
|
|
|
|
|
|
|
|
|
|
|
|
|
| * |
Amounts may not recalculate due to rounding. |
| (1) |
Restructuring charges (recoveries) include severance, non-cash
impairment charges for production assets and improvements on leased facilities and other costs related to the 2023 Restructuring Plan. |
| (2) |
Integration, site consolidation and other includes retention and severance payments, expenses not included in
restructuring charges related to site closures as well as other integration costs related to the Coherent transaction and other one-time costs. Refer to footnote (2) to table 8 for a more detailed
description of these costs on a consolidated basis, |
| (3) |
Transaction fees and financing includes debt extinguishment costs and various fees related to closing the
Coherent transaction. |
| (4) |
Start-up costs in operating expenses were related to the start-up of new devices for new customer applications. |
39
Table 8
Reconciliation of GAAP Measures to Non-GAAP Measures*
|
|
|
|
|
|
|
|
|
|
|
|
|
|
|
|
|
|
|
|
|
| |
|
THREE MONTHS ENDED |
|
|
NINE MONTHS ENDED |
|
| $ Millions, except per share amounts (unaudited) |
|
Mar 31
2024 |
|
|
Dec 31
2023 |
|
|
Mar 31
2023 |
|
|
Mar 31
2024 |
|
|
Dec 31
2023 |
|
| Gross profit on GAAP basis |
|
$ |
366.5 |
|
|
$ |
350.6 |
|
|
$ |
420.2 |
|
|
$ |
1,024.0 |
|
|
$ |
1,274.9 |
|
| Share-based compensation |
|
|
5.2 |
|
|
|
5.3 |
|
|
|
6.5 |
|
|
|
17.9 |
|
|
|
18.0 |
|
| Amortization of acquired intangibles |
|
|
30.6 |
|
|
|
30.2 |
|
|
|
30.7 |
|
|
|
91.6 |
|
|
|
93.4 |
|
| Fair value adjustment on acquired inventory |
|
|
— |
|
|
|
— |
|
|
|
— |
|
|
|
— |
|
|
|
157.5 |
|
| Integration, site consolidation and
other(2) |
|
|
30.3 |
|
|
|
21.6 |
|
|
|
5.8 |
|
|
|
73.2 |
|
|
|
7.4 |
|
|
|
|
|
|
|
|
|
|
|
|
|
|
|
|
|
|
|
|
|
|
| Gross profit on non-GAAP basis |
|
$ |
432.6 |
|
|
$ |
407.7 |
|
|
$ |
463.2 |
|
|
$ |
1,206.7 |
|
|
$ |
1,551.2 |
|
|
|
|
|
|
|
|
|
|
|
|
|
|
|
|
|
|
|
|
|
|
|
|
|
|
|
|
|
|
|
|
|
|
|
|
|
|
|
|
|
|
|
| Internal research and development on GAAP basis |
|
$ |
127.5 |
|
|
$ |
111.2 |
|
|
$ |
126.4 |
|
|
$ |
352.1 |
|
|
$ |
376.3 |
|
| Share-based compensation |
|
|
(4.9 |
) |
|
|
(5.0 |
) |
|
|
(5.9 |
) |
|
|
(17.9 |
) |
|
|
(17.3 |
) |
| Amortization of acquired intangibles |
|
|
(0.7 |
) |
|
|
(0.7 |
) |
|
|
(0.4 |
) |
|
|
(2.0 |
) |
|
|
(0.4 |
) |
| Integration, site consolidation and
other(2) |
|
|
(3.3 |
) |
|
|
(2.5 |
) |
|
|
(0.2 |
) |
|
|
(7.2 |
) |
|
|
(0.2 |
) |
| Start-up costs(4) |
|
|
(0.5 |
) |
|
|
(0.6 |
) |
|
|
— |
|
|
|
(1.5 |
) |
|
|
— |
|
|
|
|
|
|
|
|
|
|
|
|
|
|
|
|
|
|
|
|
|
|
| Internal research and development on non-GAAP
basis |
|
$ |
118.1 |
|
|
$ |
102.4 |
|
|
$ |
119.9 |
|
|
$ |
323.5 |
|
|
$ |
358.4 |
|
|
|
|
|
|
|
|
|
|
|
|
|
|
|
|
|
|
|
|
|
|
|
|
|
|
|
|
|
|
|
|
|
|
|
|
|
|
|
|
|
|
|
| Selling, general and administrative on GAAP basis |
|
$ |
205.2 |
|
|
$ |
209.2 |
|
|
$ |
226.4 |
|
|
$ |
626.0 |
|
|
$ |
780.6 |
|
| Share-based compensation |
|
|
(16.3 |
) |
|
|
(17.0 |
) |
|
|
(22.7 |
) |
|
|
(62.4 |
) |
|
|
(87.9 |
) |
| Amortization of acquired intangibles |
|
|
(41.0 |
) |
|
|
(40.6 |
) |
|
|
(61.6 |
) |
|
|
(122.9 |
) |
|
|
(186.8 |
) |
| Integration, site consolidation and
other(2) |
|
|
(15.6 |
) |
|
|
(17.8 |
) |
|
|
(15.9 |
) |
|
|
(43.8 |
) |
|
|
(55.6 |
) |
| Transaction fees and financing(3) |
|
|
— |
|
|
|
— |
|
|
|
— |
|
|
|
— |
|
|
|
(38.7 |
) |
|
|
|
|
|
|
|
|
|
|
|
|
|
|
|
|
|
|
|
|
|
| Selling, general and administrative on non-GAAP
basis |
|
$ |
132.3 |
|
|
$ |
133.8 |
|
|
$ |
126.2 |
|
|
$ |
396.9 |
|
|
$ |
411.6 |
|
|
|
|
|
|
|
|
|
|
|
|
|
|
|
|
|
|
|
|
|
|
|
|
|
|
|
|
|
|
|
|
|
|
|
|
|
|
|
|
|
|
|
| Restructuring charges (recoveries) on GAAP basis |
|
$ |
11.5 |
|
|
$ |
(1.6 |
) |
|
$ |
— |
|
|
$ |
12.9 |
|
|
$ |
— |
|
| Restructuring charges
(recoveries)(1) |
|
|
(11.5 |
) |
|
|
1.6 |
|
|
|
— |
|
|
|
(12.9 |
) |
|
|
— |
|
|
|
|
|
|
|
|
|
|
|
|
|
|
|
|
|
|
|
|
|
|
| Restructuring charges on non-GAAP basis |
|
$ |
— |
|
|
$ |
— |
|
|
$ |
— |
|
|
$ |
— |
|
|
$ |
— |
|
|
|
|
|
|
|
|
|
|
|
|
|
|
|
|
|
|
|
|
|
|
|
|
|
|
|
|
|
|
|
|
|
|
|
|
|
|
|
|
|
|
|
| Operating income on GAAP basis |
|
$ |
22.3 |
|
|
$ |
31.9 |
|
|
$ |
67.4 |
|
|
$ |
32.9 |
|
|
$ |
118.1 |
|
| Share-based compensation |
|
|
26.4 |
|
|
|
27.3 |
|
|
|
35.1 |
|
|
|
98.2 |
|
|
|
123.2 |
|
| Amortization of acquired intangibles |
|
|
72.3 |
|
|
|
71.5 |
|
|
|
92.7 |
|
|
|
216.5 |
|
|
|
280.6 |
|
| Fair value adjustment on acquired inventory |
|
|
— |
|
|
|
— |
|
|
|
— |
|
|
|
— |
|
|
|
157.5 |
|
| Restructuring charges
(recoveries)(1) |
|
|
11.5 |
|
|
|
(1.6 |
) |
|
|
— |
|
|
|
12.9 |
|
|
|
— |
|
| Integration, site consolidation and
other(2) |
|
|
49.2 |
|
|
|
41.9 |
|
|
|
21.9 |
|
|
|
124.2 |
|
|
|
63.2 |
|
| Transaction fees and financing(3) |
|
|
— |
|
|
|
— |
|
|
|
— |
|
|
|
— |
|
|
|
38.7 |
|
| Start-up costs(4) |
|
|
0.5 |
|
|
|
0.6 |
|
|
|
— |
|
|
|
1.5 |
|
|
|
— |
|
|
|
|
|
|
|
|
|
|
|
|
|
|
|
|
|
|
|
|
|
|
| Operating income on non-GAAP basis |
|
$ |
182.2 |
|
|
$ |
171.6 |
|
|
$ |
217.1 |
|
|
$ |
486.2 |
|
|
$ |
781.3 |
|
|
|
|
|
|
|
|
|
|
|
|
|
|
|
|
|
|
|
|
|
|
|
|
|
|
|
|
|
|
|
|
|
|
|
|
|
|
|
|
|
|
|
40
Table 8
Reconciliation of GAAP Measures to Non-GAAP Measures*
(Continued)
|
|
|
|
|
|
|
|
|
|
|
|
|
|
|
|
|
|
|
|
|
| |
|
THREE MONTHS ENDED |
|
|
NINE MONTHS ENDED |
|
| $ Millions, except per share amounts (unaudited) |
|
Mar 31
2024 |
|
|
Dec 31
2023 |
|
|
Mar 31
2023 |
|
|
Mar 31
2024 |
|
|
Mar 31
2023 |
|
|
|
|
|
|
|
| Interest and other (income) expense, net on GAAP basis |
|
$ |
54.2 |
|
|
$ |
69.3 |
|
|
$ |
72.1 |
|
|
$ |
190.4 |
|
|
$ |
240.2 |
|
| Foreign currency exchange gains (losses), net |
|
|
(3.1 |
) |
|
|
(6.2 |
) |
|
|
(0.8 |
) |
|
|
(8.6 |
) |
|
|
(5.1 |
) |
| Transaction fees and financing(3) |
|
|
— |
|
|
|
— |
|
|
|
— |
|
|
|
— |
|
|
|
(34.8 |
) |
|
|
|
|
|
|
|
|
|
|
|
|
|
|
|
|
|
|
|
|
|
| Interest and other (income) expense, net on non-GAAP
basis |
|
$ |
51.1 |
|
|
$ |
63.1 |
|
|
$ |
71.3 |
|
|
$ |
181.8 |
|
|
$ |
200.3 |
|
|
|
|
|
|
|
|
|
|
|
|
|
|
|
|
|
|
|
|
|
|
|
|
|
|
|
|
|
|
|
|
|
|
|
|
|
|
|
|
|
|
|
| Income taxes on GAAP basis |
|
$ |
(16.1 |
) |
|
$ |
(8.9 |
) |
|
$ |
(7.3 |
) |
|
$ |
(45.8 |
) |
|
$ |
(40.9 |
) |
| Tax impact of non-GAAP measures |
|
|
36.6 |
|
|
|
32.5 |
|
|
|
35.5 |
|
|
|
99.6 |
|
|
|
149.3 |
|
|
|
|
|
|
|
|
|
|
|
|
|
|
|
|
|
|
|
|
|
|
| Income taxes on non-GAAP basis |
|
$ |
20.5 |
|
|
$ |
23.6 |
|
|
$ |
28.2 |
|
|
$ |
53.8 |
|
|
$ |
108.4 |
|
|
|
|
|
|
|
|
|
|
|
|
|
|
|
|
|
|
|
|
|
|
|
|
|
|
|
|
|
|
|
|
|
|
|
|
|
|
|
|
|
|
|
| Net earnings (loss) attributable to Coherent Corp. on GAAP basis |
|
$ |
(13.2 |
) |
|
$ |
(27.0 |
) |
|
$ |
2.5 |
|
|
$ |
(107.7 |
) |
|
$ |
(81.2 |
) |
| Share-based compensation |
|
|
26.4 |
|
|
|
27.3 |
|
|
|
35.1 |
|
|
|
98.2 |
|
|
|
123.2 |
|
| Amortization of acquired intangibles |
|
|
72.3 |
|
|
|
71.5 |
|
|
|
92.7 |
|
|
|
216.5 |
|
|
|
280.6 |
|
| Fair value adjustment on acquired inventory |
|
|
— |
|
|
|
— |
|
|
|
— |
|
|
|
— |
|
|
|
157.5 |
|
| Foreign currency exchange (gains) losses |
|
|
3.1 |
|
|
|
6.2 |
|
|
|
0.8 |
|
|
|
8.6 |
|
|
|
5.1 |
|
| Restructuring charges
(recoveries)(1) |
|
|
11.5 |
|
|
|
(1.6 |
) |
|
|
— |
|
|
|
12.9 |
|
|
|
— |
|
| Integration, site consolidation and
other(2) |
|
|
49.2 |
|
|
|
41.9 |
|
|
|
21.9 |
|
|
|
124.2 |
|
|
|
63.2 |
|
| Transaction fees and financing(3) |
|
|
— |
|
|
|
— |
|
|
|
— |
|
|
|
— |
|
|
|
73.5 |
|
| Start-up costs(4) |
|
|
0.5 |
|
|
|
0.6 |
|
|
|
— |
|
|
|
1.5 |
|
|
|
— |
|
| Tax impact of non-GAAP measures |
|
|
(36.6 |
) |
|
|
(32.5 |
) |
|
|
(35.5 |
) |
|
|
(99.6 |
) |
|
|
(149.3 |
) |
|
|
|
|
|
|
|
|
|
|
|
|
|
|
|
|
|
|
|
|
|
| Net earnings attributable to Coherent Corp. on non-GAAP
basis |
|
$ |
113.2 |
|
|
$ |
86.4 |
|
|
$ |
117.6 |
|
|
$ |
254.5 |
|
|
$ |
472.6 |
|
|
|
|
|
|
|
|
|
|
|
|
|
|
|
|
|
|
|
|
|
|
|
|
|
|
|
|
|
|
|
|
|
|
|
|
|
|
|
|
|
|
|
| Per share data: |
|
|
|
|
|
|
|
|
|
|
|
|
|
|
|
|
|
|
|
|
| Net loss on GAAP basis |
|
|
|
|
|
|
|
|
|
|
|
|
|
|
|
|
|
|
|
|
| Basic Loss Per Share |
|
$ |
(0.29 |
) |
|
$ |
(0.38 |
) |
|
$ |
(0.24 |
) |
|
$ |
(1.32 |
) |
|
$ |
(1.38 |
) |
| Diluted Loss Per Share |
|
$ |
(0.29 |
) |
|
$ |
(0.38 |
) |
|
$ |
(0.24 |
) |
|
$ |
(1.32 |
) |
|
$ |
(1.38 |
) |
|
|
|
|
|
|
|
|
|
|
|
|
|
|
|
|
|
|
|
|
|
| Net earnings on non-GAAP basis |
|
|
|
|
|
|
|
|
|
|
|
|
|
|
|
|
|
|
|
|
| Basic Earnings Per Share |
|
$ |
0.54 |
|
|
$ |
0.37 |
|
|
$ |
0.59 |
|
|
$ |
1.07 |
|
|
$ |
2.67 |
|
| Diluted Earnings Per Share |
|
$ |
0.53 |
|
|
$ |
0.36 |
|
|
$ |
0.58 |
|
|
$ |
1.06 |
|
|
$ |
2.57 |
|
|
|
|
|
|
|
|
|
|
|
|
|
|
|
|
|
|
|
|
|
|
| * |
Amounts may not recalculate due to rounding. |
| (1) |
Restructuring charges (recoveries) include severance, non-cash
impairment charges for production assets and improvements on leased facilities and other costs related to the 2023 Restructuring Plan. |
| (2) |
Integration, site consolidation and other costs include retention and severance payments, expenses not included
in restructuring charges related to site closures as well as other integration costs related to the acquisition of Coherent, Inc. Integration, site consolidation and other costs of $49.2 million for the three months ended December 31, 2023
include $12.2 million of manufacturing inefficiencies related to sites that are being shut down as part of our 2023 Restructuring Plan; $11.4 million in write-offs for products that are end-of-life including inventory and equipment formerly used to produce those products; $11.2 million of consulting costs related to projects to integrate recent acquisitions into common information
technology systems and simplify the legal entity structure; $6.8 million of overlapping labor and travel and $1.5 million of accelerated depreciation for a site in scope of our Synergy and Site Consolidation Plan; $3.8 million in
severance and retention costs related to the retirement of our CEO; and $2.3 million of employee severance and retention costs for site consolidations included in our Synergy and Site Consolidation Plan. |
| (3) |
Transaction fees and financing includes debt extinguishment costs and various fees related to closing the
Coherent transaction. |
| (4) |
Start-up costs in operating expenses were related to the start-up of new devices for new customer applications. |
41
Table 9
Reconciliation of GAAP Net Income (Loss), EBITDA and Adjusted EBITDA*
|
|
|
|
|
|
|
|
|
|
|
|
|
|
|
|
|
|
|
|
|
| |
|
THREE MONTHS ENDED |
|
|
NINE MONTHS ENDED |
|
| $ Millions, except percentage amounts (unaudited) |
|
Mar 31
2024 |
|
|
Dec 31
2023 |
|
|
Mar 31
2023 |
|
|
Mar 31
2024 |
|
|
Mar 31
2023 |
|
|
|
|
|
|
|
|
|
|
|
|
|
|
|
|
|
|
|
|
|
|
| Net earnings (loss) on GAAP basis |
|
$ |
(15.7 |
) |
|
$ |
(28.5 |
) |
|
$ |
2.5 |
|
|
$ |
(111.7 |
) |
|
$ |
(81.2 |
) |
| Income taxes |
|
|
(16.1 |
) |
|
|
(8.9 |
) |
|
|
(7.3 |
) |
|
|
(45.8 |
) |
|
|
(40.9 |
) |
| Depreciation and amortization |
|
|
139.7 |
|
|
|
138.0 |
|
|
|
160.9 |
|
|
|
416.1 |
|
|
|
478.1 |
|
| Interest expense |
|
|
72.8 |
|
|
|
74.6 |
|
|
|
75.2 |
|
|
|
220.7 |
|
|
|
208.0 |
|
| Interest income |
|
|
(12.5 |
) |
|
|
(6.8 |
) |
|
|
(2.2 |
) |
|
|
(23.0 |
) |
|
|
(5.1 |
) |
|
|
|
|
|
|
|
|
|
|
|
|
|
|
|
|
|
|
|
|
|
| EBITDA(1) |
|
$ |
168.2 |
|
|
$ |
168.4 |
|
|
$ |
229.1 |
|
|
$ |
456.3 |
|
|
$ |
558.9 |
|
|
|
|
|
|
|
|
|
|
|
|
|
|
|
|
|
|
|
|
|
|
| EBITDA margin |
|
|
13.9 |
% |
|
|
14.9 |
% |
|
|
18.5 |
% |
|
|
13.4 |
% |
|
|
14.1 |
% |
|
|
|
|
|
|
|
|
|
|
|
|
|
|
|
|
|
|
|
|
|
| Fair value adjustment on acquired inventory |
|
|
— |
|
|
|
— |
|
|
|
— |
|
|
|
— |
|
|
|
157.5 |
|
| Share-based compensation |
|
|
26.4 |
|
|
|
27.3 |
|
|
|
35.1 |
|
|
|
98.2 |
|
|
|
123.2 |
|
| Foreign currency exchange (gains) losses |
|
|
3.1 |
|
|
|
6.2 |
|
|
|
0.8 |
|
|
|
8.6 |
|
|
|
5.1 |
|
| Start-up costs(6) |
|
|
0.5 |
|
|
|
0.6 |
|
|
|
— |
|
|
|
1.5 |
|
|
|
— |
|
| Restructuring charges
(recoveries)(3) |
|
|
11.5 |
|
|
|
(1.6 |
) |
|
|
— |
|
|
|
12.9 |
|
|
|
— |
|
| Integration, site consolidation and
other(4) |
|
|
49.2 |
|
|
|
41.9 |
|
|
|
21.9 |
|
|
|
124.2 |
|
|
|
63.2 |
|
| Transaction fees and financing(5) |
|
|
— |
|
|
|
— |
|
|
|
— |
|
|
|
— |
|
|
|
73.5 |
|
|
|
|
|
|
|
|
|
|
|
|
|
|
|
|
|
|
|
|
|
|
| Adjusted EBITDA(2) |
|
|
258.9 |
|
|
|
242.8 |
|
|
|
286.9 |
|
|
$ |
701.7 |
|
|
$ |
981.4 |
|
| Less: adjusted EBITDA attributable to noncontrolling interests |
|
|
2.3 |
|
|
|
0.2 |
|
|
|
— |
|
|
|
2.5 |
|
|
|
— |
|
|
|
|
|
|
|
|
|
|
|
|
|
|
|
|
|
|
|
|
|
|
| Adjusted EBITDA attributable to Coherent Corp. |
|
$ |
261.2 |
|
|
$ |
243.0 |
|
|
$ |
286.9 |
|
|
$ |
704.2 |
|
|
$ |
981.4 |
|
|
|
|
|
|
|
|
|
|
|
|
|
|
|
|
|
|
|
|
|
|
| Adjusted EBITDA margin attributable to Coherent Corp. |
|
|
21.6 |
% |
|
|
21.5 |
% |
|
|
23.1 |
% |
|
|
20.8 |
% |
|
|
24.8 |
% |
|
|
|
|
|
|
|
|
|
|
|
|
|
|
|
|
|
|
|
|
|
| * |
Amounts may not recalculate due to rounding. |
| (1) |
EBITDA is defined as earnings before interest expense, interest income, income taxes, depreciation and
amortization. |
| (2) |
Adjusted EBITDA excludes non-GAAP adjustments for share-based
compensation, certain restructuring, integration, and transaction expenses, debt extinguishment charges, start-up costs, and the impact of foreign currency exchange gains and losses. |
| (3) |
Restructuring charges (recoveries) include severance, non-cash
impairment charges for production assets and improvements on leased facilities and other costs related to the 2023 Restructuring Plan. |
| (4) |
Integration, site consolidation and other costs include retention and severance payments, expenses not included
in restructuring charges related to site closures as well as other integration costs related to the acquisition of Coherent, Inc. Integration, site consolidation and other costs of $49.2 million for the three months ended December 31, 2023
include $12.2 million of manufacturing inefficiencies related to sites that are being shut down as part of our 2023 Restructuring Plan; $11.4 million in write-offs for products that are end-of-life including inventory and equipment formerly used to produce those products; $11.2 million of consulting costs related to projects to integrate recent acquisitions into common information
technology systems and simplify the legal entity structure; $6.8 million of overlapping labor and travel and $1.5 million of accelerated depreciation for a site in scope of our Synergy and Site Consolidation Plan; $3.8 million in
severance and retention costs related to the retirement of our CEO; and $2.3 million of employee severance and retention costs for site consolidations included in our Synergy and Site Consolidation Plan. |
| (5) |
Transaction fees and financing includes debt extinguishment costs and various fees related to closing the
Coherent transaction. |
| (6) |
Start-up costs in operating expenses were related to the start-up of new devices for new customer applications. |
42
Table 10
GAAP Earnings (Loss) Per Share Calculation*
|
|
|
|
|
|
|
|
|
|
|
|
|
|
|
|
|
|
|
|
|
| |
|
THREE MONTHS ENDED |
|
|
NINE MONTHS ENDED |
|
| $ Millions, except per share amounts (unaudited) |
|
Mar 31
2024 |
|
|
Dec 31
2023 |
|
|
Mar 31
2023 |
|
|
Mar 31
2024 |
|
|
Mar 31
2023 |
|
|
|
|
|
|
|
|
|
|
|
|
|
|
|
|
|
|
|
|
|
|
| Numerator |
|
|
|
|
|
|
|
|
|
|
|
|
|
|
|
|
|
|
|
|
| Net earnings (loss) attributable to Coherent Corp. |
|
$ |
(13.2 |
) |
|
$ |
(27.0 |
) |
|
$ |
2.5 |
|
|
$ |
(111.7 |
) |
|
$ |
(81.2 |
) |
| Deduct Series A preferred stock dividends |
|
|
— |
|
|
|
— |
|
|
|
(6.9 |
) |
|
|
— |
|
|
|
(20.7 |
) |
| Deduct Series B redeemable preferred dividends |
|
|
(31.2 |
) |
|
|
(30.6 |
) |
|
|
(29.2 |
) |
|
|
(91.9 |
) |
|
|
(86.8 |
) |
|
|
|
|
|
|
|
|
|
|
|
|
|
|
|
|
|
|
|
|
|
| Basic loss available to common shareholders |
|
$ |
(44.4 |
) |
|
$ |
(57.6 |
) |
|
$ |
(33.5 |
) |
|
$ |
(199.7 |
) |
|
$ |
(188.8 |
) |
|
|
|
|
|
|
|
|
|
|
|
|
|
|
|
|
|
|
|
|
|
|
|
|
|
|
|
|
|
|
|
|
|
|
|
|
|
|
|
|
|
|
| Diluted loss available to common shareholders |
|
$ |
(44.4 |
) |
|
$ |
(57.6 |
) |
|
$ |
(33.5 |
) |
|
$ |
(199.7 |
) |
|
$ |
(188.8 |
) |
|
|
|
|
|
|
|
|
|
|
|
|
|
|
|
|
|
|
|
|
|
|
|
|
|
|
|
|
|
|
|
|
|
|
|
|
|
|
|
|
|
|
| Denominator |
|
|
|
|
|
|
|
|
|
|
|
|
|
|
|
|
|
|
|
|
| Diluted weighted average common shares |
|
|
152.1 |
|
|
|
151.6 |
|
|
|
139.1 |
|
|
|
151.3 |
|
|
|
137.0 |
|
|
|
|
|
|
|
|
|
|
|
|
|
|
|
|
|
|
|
|
|
|
|
|
|
|
|
|
|
|
|
|
|
|
|
|
|
|
|
|
|
|
|
| Basic loss per common share |
|
$ |
(0.29 |
) |
|
$ |
(0.38 |
) |
|
$ |
(0.24 |
) |
|
$ |
(1.32 |
) |
|
$ |
(1.38 |
) |
|
|
|
|
|
|
|
|
|
|
|
|
|
|
|
|
|
|
|
|
|
|
|
|
|
|
|
|
|
|
|
|
|
|
|
|
|
|
|
|
|
|
| Diluted loss per common share |
|
$ |
(0.29 |
) |
|
$ |
(0.38 |
) |
|
$ |
(0.24 |
) |
|
$ |
(1.32 |
) |
|
$ |
(1.38 |
) |
|
|
|
|
|
|
|
|
|
|
|
|
|
|
|
|
|
|
|
|
|
|
|
|
|
|
|
|
|
|
|
|
|
|
|
|
|
|
|
|
|
|
| * |
Amounts may not recalculate due to rounding. |
43
Table 11
Non-GAAP Earnings Per Share Calculation*
|
|
|
|
|
|
|
|
|
|
|
|
|
|
|
|
|
|
|
|
|
| |
|
THREE MONTHS ENDED |
|
|
NINE MONTHS ENDED |
|
| $ Millions, except per share amounts (unaudited) |
|
Mar 31
2024 |
|
|
Dec 31
2023 |
|
|
Mar 31
2023 |
|
|
Mar 31
2024 |
|
|
Mar 31
2023 |
|
|
|
|
|
|
|
|
|
|
|
|
|
|
|
|
|
|
|
|
|
|
| Numerator |
|
|
|
|
|
|
|
|
|
|
|
|
|
|
|
|
|
|
|
|
| Net earnings attributable to Coherent Corp. on non-GAAP
basis |
|
$ |
113.2 |
|
|
$ |
86.4 |
|
|
$ |
117.6 |
|
|
$ |
254.5 |
|
|
$ |
472.6 |
|
| Deduct Series A preferred stock dividends |
|
|
— |
|
|
|
— |
|
|
|
(6.9 |
) |
|
|
— |
|
|
|
(20.7 |
) |
| Deduct Series B redeemable preferred dividends |
|
|
(31.2 |
) |
|
|
(30.6 |
) |
|
|
(29.2 |
) |
|
|
(91.9 |
) |
|
|
(86.8 |
) |
|
|
|
|
|
|
|
|
|
|
|
|
|
|
|
|
|
|
|
|
|
| Basic earnings available to common shareholders |
|
$ |
82.0 |
|
|
$ |
55.8 |
|
|
$ |
81.5 |
|
|
$ |
162.6 |
|
|
$ |
365.1 |
|
|
|
|
|
|
|
|
|
|
|
|
|
|
|
|
|
|
|
|
|
|
|
|
|
|
|
|
|
|
|
|
|
|
|
|
|
|
|
|
|
|
|
| Effect of dilutive securities |
|
|
|
|
|
|
|
|
|
|
|
|
|
|
|
|
|
|
|
|
| Add back interest on convertible notes |
|
$ |
— |
|
|
$ |
— |
|
|
$ |
— |
|
|
$ |
— |
|
|
$ |
0.3 |
|
| Add back Series A preferred stock dividends |
|
|
— |
|
|
|
— |
|
|
|
— |
|
|
|
— |
|
|
|
20.7 |
|
|
|
|
|
|
|
|
|
|
|
|
|
|
|
|
|
|
|
|
|
|
| Diluted earnings available to common shareholders |
|
$ |
82.0 |
|
|
$ |
55.8 |
|
|
$ |
81.5 |
|
|
$ |
162.6 |
|
|
$ |
386.1 |
|
|
|
|
|
|
|
|
|
|
|
|
|
|
|
|
|
|
|
|
|
|
|
|
|
|
|
|
|
|
|
|
|
|
|
|
|
|
|
|
|
|
|
| Denominator |
|
|
|
|
|
|
|
|
|
|
|
|
|
|
|
|
|
|
|
|
| Weighted average shares |
|
|
152.1 |
|
|
|
151.6 |
|
|
|
139.1 |
|
|
|
151.3 |
|
|
|
137.0 |
|
| Effect of dilutive securities: |
|
|
|
|
|
|
|
|
|
|
|
|
|
|
|
|
|
|
|
|
| Common stock equivalents |
|
|
3.5 |
|
|
|
1.4 |
|
|
|
1.7 |
|
|
|
2.3 |
|
|
|
1.4 |
|
| Convertible notes |
|
|
— |
|
|
|
— |
|
|
|
— |
|
|
|
— |
|
|
|
1.5 |
|
| Series A Mandatory Convertible Preferred Stock |
|
|
— |
|
|
|
— |
|
|
|
— |
|
|
|
— |
|
|
|
10.3 |
|
|
|
|
|
|
|
|
|
|
|
|
|
|
|
|
|
|
|
|
|
|
| Diluted weighted average common shares |
|
|
155.7 |
|
|
|
152.9 |
|
|
|
140.8 |
|
|
|
153.6 |
|
|
|
150.2 |
|
|
|
|
|
|
|
|
|
|
|
|
|
|
|
|
|
|
|
|
|
|
|
|
|
|
|
|
|
|
|
|
|
|
|
|
|
|
|
|
|
|
|
| Basic earnings per common share on non-GAAP
basis |
|
$ |
0.54 |
|
|
$ |
0.37 |
|
|
$ |
0.59 |
|
|
$ |
1.07 |
|
|
$ |
2.67 |
|
|
|
|
|
|
|
|
|
|
|
|
|
|
|
|
|
|
|
|
|
|
|
|
|
|
|
|
|
|
|
|
|
|
|
|
|
|
|
|
|
|
|
| Diluted earnings per common share on non-GAAP
basis |
|
$ |
0.53 |
|
|
$ |
0.36 |
|
|
$ |
0.58 |
|
|
$ |
1.06 |
|
|
$ |
2.57 |
|
|
|
|
|
|
|
|
|
|
|
|
|
|
|
|
|
|
|
|
|
|
|
|
|
|
|
|
|
|
|
|
|
|
|
|
|
|
|
|
|
|
|
| * |
Amounts may not recalculate due to rounding. |
44
FORWARD-LOOKING STATEMENTS
The statements contained in this letter to shareholders include forward-looking statements relating to future events and expectations, including our
expectations regarding (i) our future financial and operational results (including expectations for further growth); (ii) our competitive and strategic positioning – and strategic opportunities; (iii) outlook, visibility, key trends,
and developments for the fourth fiscal quarter of 2024, the 2024 fiscal year, and the longer term including, without limitation, in each of our segments – networking, lasers, and materials; (iv) near and long term trends in the markets we
serve including industrial, communications, electronics and instrumentation; and their underlying verticals and the regions we serve; (v) the silicon carbide business; (vi) capital expenditure and debt reduction; (vii) new export
control restrictions and their potential impact on the Company; (viii) the expected launch date of our 1.6T transceivers and components; (ix) our Synergy and Site Consolidation Plan including, without limitation, projected synergies and the
cost to achieve these synergies; (x) our Restructuring Plan including, without limitation, projected savings, costs to achieve, and restructuring charges; (xi) our Enterprise Transformation Program including, without limitation, its
ability to drive significant operating efficiencies and improvements and the resulting ability to scale our business while significantly reducing internal complexity; and (xii) the silicon carbide business, each of which, is based on certain
assumptions and contingencies. The forward-looking statements are made pursuant to the safe harbor provisions of the U.S. Private Securities Litigation Reform Act of 1995 and relate to the Company’s performance on a going-forward basis. The
forward-looking statements contained herein involve risks and uncertainties, which could cause actual results, performance, or trends to differ materially from those expressed in the forward-looking statements herein or in previous disclosures.
The Company believes that all forward-looking statements made by it herein have a reasonable basis, but there can be no assurance that management’s
expectations, beliefs, or projections as expressed in the forward-looking statements will actually occur or prove to be correct. In addition to general industry and global economic conditions, factors that could cause actual results to differ
materially from those discussed in the forward-looking statements herein include but are not limited to: (i) the failure of any one or more of the assumptions stated herein to prove to be correct; (ii) the risks relating to forward-looking
statements and other “Risk Factors” discussed in the Company’s Annual Report on Form 10-K for the fiscal year ended June 30, 2023, and additional risk factors that may be identified from
time to time in filings of the Company; (iii) the substantial indebtedness the Company incurred in connection with its acquisition of Coherent, Inc. (the “Transaction”), the need to generate sufficient cash flows to service and repay
such debt, and the Company’s ability to generate sufficient funds to meet its anticipated debt reduction goals; (iv) the possibility that the Company may not be able to continue its integration progress and/or take other restructuring
actions, or otherwise be able to achieve expected synergies, operating efficiencies including greater scale, focus, resiliency, and lower operating costs, and other benefits within the expected time frames or at all and ultimately to successfully
fully integrate the operations of Coherent, Inc. (“Coherent”) with those of the Company; (v) the possibility that such integration and/or the restructuring actions may be more difficult, time-consuming, or costly than expected or that
operating costs and business disruption (including, without limitation, disruptions in relationships with employees, customers, or suppliers) may be greater than expected in connection with the Transaction and/or the restructuring actions;
(vi) any unexpected costs, charges, or expenses resulting from the Transaction and/or the restructuring actions; (vii) the risk that disruption from the Transaction
45
and/or the restructuring actions materially and adversely affects the respective businesses and operations of the Company and Coherent; (viii) potential adverse reactions or changes to
business relationships resulting from the completion of the Transaction and/or the restructuring actions; (ix) the ability of the Company to retain and hire key employees; (x) the purchasing patterns of customers and end users;
(xi) the timely release of new products and acceptance of such new products by the market; (xii) the introduction of new products by competitors and other competitive responses; (xiii) the Company’s ability to assimilate other
recently acquired businesses, and realize synergies, cost savings, and opportunities for growth in connection therewith, together with the risks, costs, and uncertainties associated with such acquisitions; (xiv) the Company’s ability to
devise and execute strategies to respond to market conditions; (xv) the risks to realizing the benefits of investments in R&D and commercialization of innovations; (xvi) the risks that the Company’s stock price will not trade in
line with industrial technology leaders; and/or (xvii) the risks of business and economic disruption related to worldwide health epidemics or outbreaks that may arise. The Company disclaims any obligation to update information contained in
these forward-looking statements, whether as a result of new information, future events or developments, or otherwise.
46

Exhibit 99.3 INVESTOR PRESENTATION May 2024 Copyright 2024, Coherent.
All rights reserved. 1

FORWARD-LOOKING STATEMENTS This presentation contains forward-looking
statements relating to future events and expectations, including our expectations regarding (i) our future financial and operational results (including expectations for future growth); (ii) capital expenditures and the results of investments in
research and design; (iii) growth in the markets we serve including industrial, communications, electronics, and instrumentation; (iv) artificial intelligence and the growth in the datacom transceiver global market and opportunity by laser type; (v)
silicon carbide including, without limitation, market growth, the silicon carbide investment transaction and the benefits thereof; (vi) our capitalization for future growth; and (vii) cost reductions (and savings) from restructuring actions, each of
which, is based on certain assumptions and contingencies. The forward-looking statements are made pursuant to the safe harbor provisions of the U.S. Private Securities Litigation Reform Act of 1995 and relate to the Company’s performance on a
going-forward basis. The forward-looking statements in this investor presentation involve risks and uncertainties, which could cause actual results, performance or trends to differ materially from those expressed in the forward-looking statements
herein or in previous disclosures. The Company believes that all forward-looking statements made by it in this presentation have a reasonable basis, but there can be no assurance that management’s expectations, beliefs, or projections as
expressed in the forward-looking statements will actually occur or prove to be correct. In addition to general industry and global economic conditions, factors that could cause actual results to differ materially from those discussed in the forward-
looking statements in this presentation include but are not limited to: (i) the failure of any one or more of the assumptions stated herein to prove to be correct; (ii) the risks relating to forward-looking statements and other “Risk
Factors” discussed in the Company’s Annual Report on Form 10-K for the fiscal year ended June 30, 2023 and additional risk factors that may be identified from time to time in filings of the Company; (iii) the substantial indebtedness the
Company incurred in connection with its acquisition of Coherent, Inc. (the “Transaction”), the need to generate sufficient cash flows to service and repay such debt and the Company’s ability to generate sufficient funds to meet its
anticipated debt reduction goals; (iv) the possibility that the Company may not be able to continue its integration progress on and/or take other restructuring actions, or otherwise be able to achieve expected synergies, operating efficiencies,
including greater scale, focus, resiliency, and lower operating costs, and other benefits within the expected time-frames or at all and ultimately to successfully fully integrate the operations of Coherent, Inc. (“Coherent”) with those
of the Company; (v) the possibility that such integration and/or the restructuring actions may be more difficult, time-consuming or costly than expected or that operating costs and business disruption (including, without limitation, disruptions in
relationships with employees, customers or suppliers) may be greater than expected in connection with the Transaction and/or the restructuring actions; (vi) any unexpected costs, charges or expenses resulting from the Transaction and/or the
restructuring actions; (vii) the risk that disruption from the Transaction and/or the restructuring actions materially and adversely affects the respective businesses and operations of the Company and Coherent; (viii) potential adverse reactions or
changes to business relationships resulting from the completion of the Transaction and/or the restructuring actions; (ix) the ability of the Company to retain and hire key employees; (x) the purchasing patterns of customers and end users; (xi) the
timely release of new products, and acceptance of such new products by the market; (xii) the introduction of new products by competitors and other competitive responses; (xiii) the Company’s ability to assimilate other recently acquired
businesses, and realize synergies, cost savings, and opportunities for growth in connection therewith, together with the risks, costs, and uncertainties associated with such acquisitions; (xiv) the Company’s ability to devise and execute
strategies to respond to market conditions; (xv) the risks to realizing the benefits of investments in R&D and commercialization of innovations; (xvi) the risks that the Company’s stock price will not trade in line with industrial
technology leaders; and/or (xvii) the risks of business and economic disruption related to worldwide health epidemics or outbreaks that may arise. The Company disclaims any obligation to update information contained in these forward-looking
statements, whether as a result of new information, future events or developments, or otherwise. Unless otherwise indicated in this presentation, all information in this presentation is as of May 6, 2024. This presentation contains non-GAAP
financial measures and key metrics relating to the Company’s past performance. These non-GAAP financial measures are in addition to, and not as a substitute for or superior to, measures of financial performance prepared in accordance with U.S.
GAAP. There are a number of limitations related to the use of these non-GAAP financial measures versus their nearest GAAP equivalents. For example, other companies may calculate non-GAAP financial measures differently or may use other measures to
evaluate their performance, all of which could reduce the usefulness of our non-GAAP financial measures as tools for comparison. As required by Regulation G, we have provided reconciliations of those measures to the most directly comparable GAAP
measures in the section captioned “GAAP to NON-GAAP RECONCILIATION.” 2 Copyright 2024, Coherent. All rights reserved.
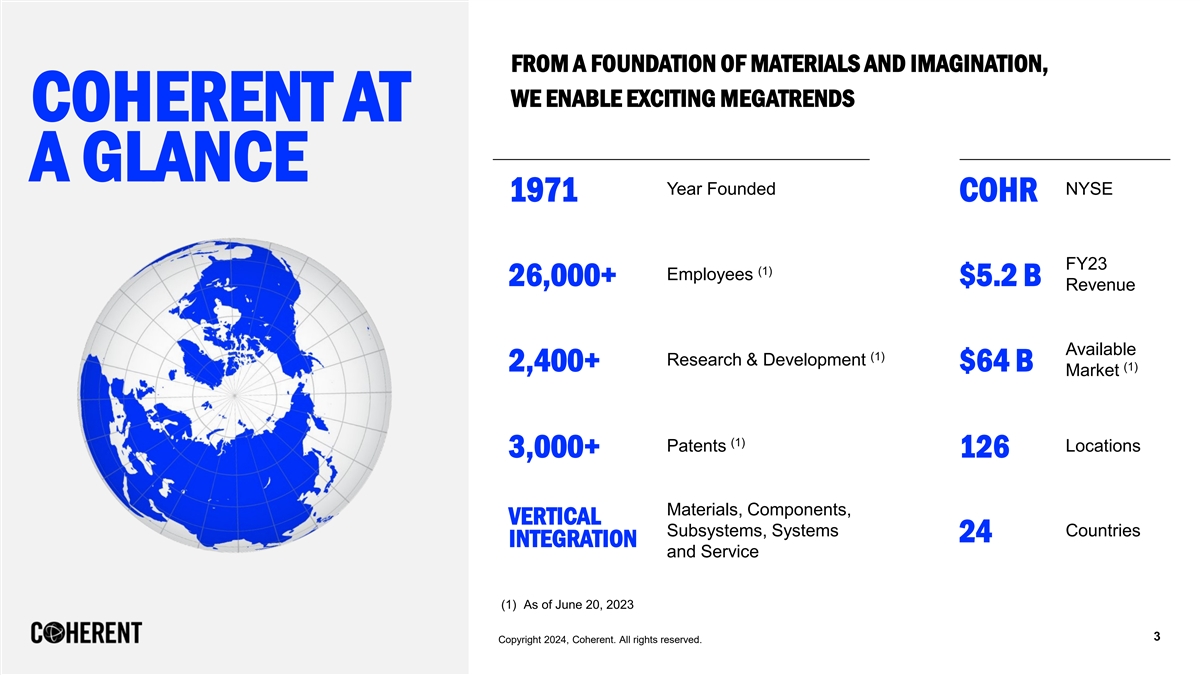
FROM A FOUNDATION OF MATERIALS AND IMAGINATION, WE ENABLE EXCITING
MEGATRENDS COHERENT AT A GLANCE Year Founded NYSE 1971 COHR FY23 (1) Employees 26,000+ $5.2 B Revenue Available (1) Research & Development 2,400+ $64 B (1) Market (1) Patents Locations 3,000+ 126 Materials, Components, VERTICAL Subsystems,
Systems Countries 24 INTEGRATION and Service (1) As of June 20, 2023 3 Copyright 2024, Coherent. All rights reserved.

INSIGHTFUL TARGETING AND INTEGRATION OF STRATEGIC ACQUISITIONS 5
Transformative Acquisitions 5.2 2022 - Laser sources & systems 2019 - Indium phosphide technology platform 2016 - Epitaxial wafer and SiC electronic devices 2013 - Gallium arsenide technology platform 2010 - Optical networks & China market
3.3 3.1 10 Years of Continuous CAGR 25% Revenue Growth 2.4 (1) 1.4 Revenue ($B) 1.2 1.0 0.8 0.7 0.7 0.6 FY13 FY14 FY15 FY16 FY17 FY18 FY19 FY20 FY21 (2) FY22 FY23 (1) Figures prior to FY2019 do not reflect the adoption of ASC 606. (2) Prepared in
accordance to ASC 805. Includes the revenue of Finisar in Q1FY20 prior to the acquisition date of 9/24/20. Not calculated in accordance with Article 11 of SEC regulation S-X. 4 Copyright 2024, Coherent. All rights reserved.

$5.2 BILLION OF REVENUE IN FY23 WELL DIVERSIFIED ACROSS TECHNOLOGY,
PRODUCTS, AND GEOGRAPHIC MARKETS Segments Markets Regions North Communications Materials Europe America Industrial Lasers 19% 26% 29% 34% 45% China BY REPORTING (1) 11% BY MARKET BY REGION 53% SEGMENT 14% 9% Korea & Japan 3% 45% 12%
Instrumentation Other Networking Electronics (1) Revenue by region is based on customer headquarter addresses. (2) Amounts may not recalculate due to rounding. 5 Copyright 2024, Coherent. All rights reserved.

FOUR ATTRACTIVE GROWTH MARKETS AGGREGATE $64B TAM 14% FIVE-YEAR CAGR
(2023-28) COMMUNICATIONS ELECTRONICS INSTRUMENTATION INDUSTRIAL TAM: $22B TAM: $23B TAM: $14B TAM: $5B CAGR: 9% CAGR: 14% CAGR: 20% CAGR: 8% Sources: LightCounting, Omdia, Sources: Optech Consulting, Sources: IDC, Morgan Stanley, Sources: Strategies
Unlimited, TechInsight, Strategies Unlimited, Cignal AI, Yole, Dell’Oro Internal Research & Markets, Forbes, Yole, Markets & Markets, SDI (Strategic Estimates SEMI, Internal Estimates, DSCC Strategy Analytics, IdTechEx, Directions),
Internal Estimates Internal Estimates Note: TAM based on CY2023 6 Copyright 2024, Coherent. All rights reserved.
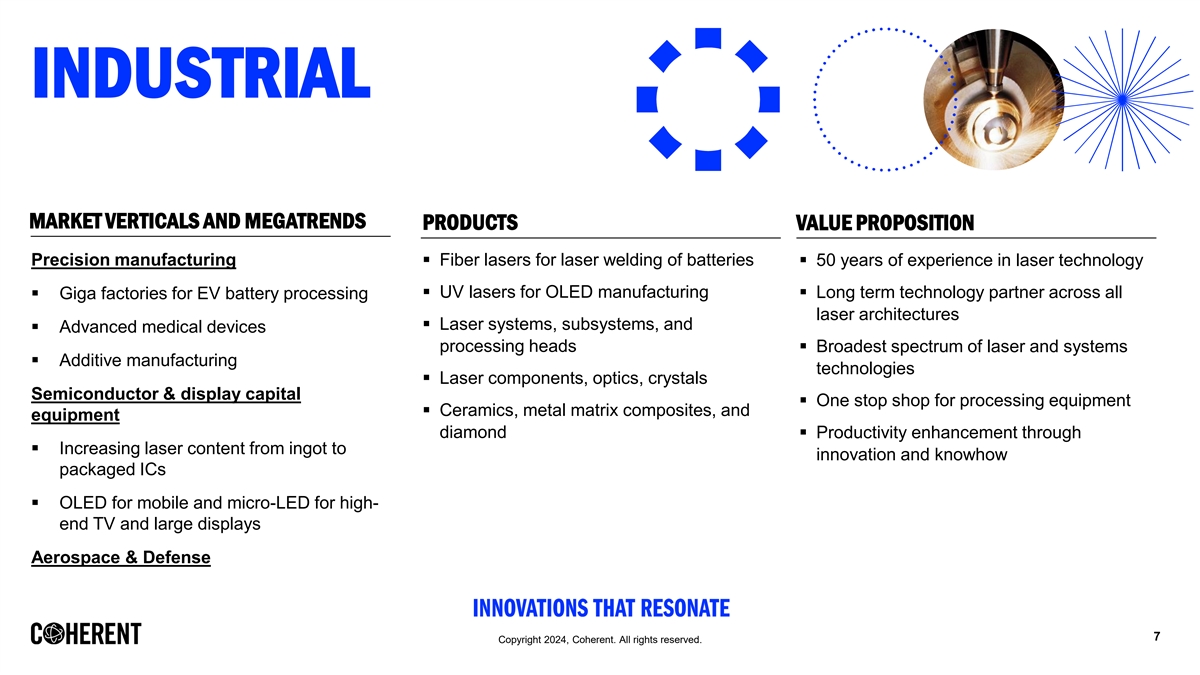
INDUSTRIAL MARKET VERTICALS AND MEGATRENDS PRODUCTS VALUE PROPOSITION
Precision manufacturing§ Fiber lasers for laser welding of batteries§ 50 years of experience in laser technology § UV lasers for OLED manufacturing § Long term technology partner across all § Giga factories for EV battery
processing laser architectures § Laser systems, subsystems, and § Advanced medical devices processing heads§ Broadest spectrum of laser and systems § Additive manufacturing technologies § Laser components, optics, crystals
Semiconductor & display capital § One stop shop for processing equipment § Ceramics, metal matrix composites, and equipment diamond§ Productivity enhancement through § Increasing laser content from ingot to innovation and
knowhow packaged ICs § OLED for mobile and micro-LED for high- end TV and large displays Aerospace & Defense 7 Copyright 2024, Coherent. All rights reserved.

COMMUNICATIONS MARKET VERTICALS AND MEGATRENDS PRODUCTS VALUE
PROPOSITION Datacom§ 100 to 800 Gbps datacom transceivers§ Largest supplier of optical communications components § Increasing spend on cloud infrastructure § Pluggable coherent transceivers § Vertically integrated from
material through § Artificial Intelligence/Machine Learning § Wavelength selective switches (WSS) subsystems, including coherent DSPs § Pluggable optical line subsystems (POLS) Telecom § Industry pioneer in broad range of §
Open disaggregated systems§ Terrestrial and submarine pump lasers technology platforms § Pluggable coherent transceivers§ InP edge emitting lasers and GaAs VCSELs § Industry leading investments in R&D § Global and
flexible manufacturing footprint 8 Copyright 2024, Coherent. All rights reserved.
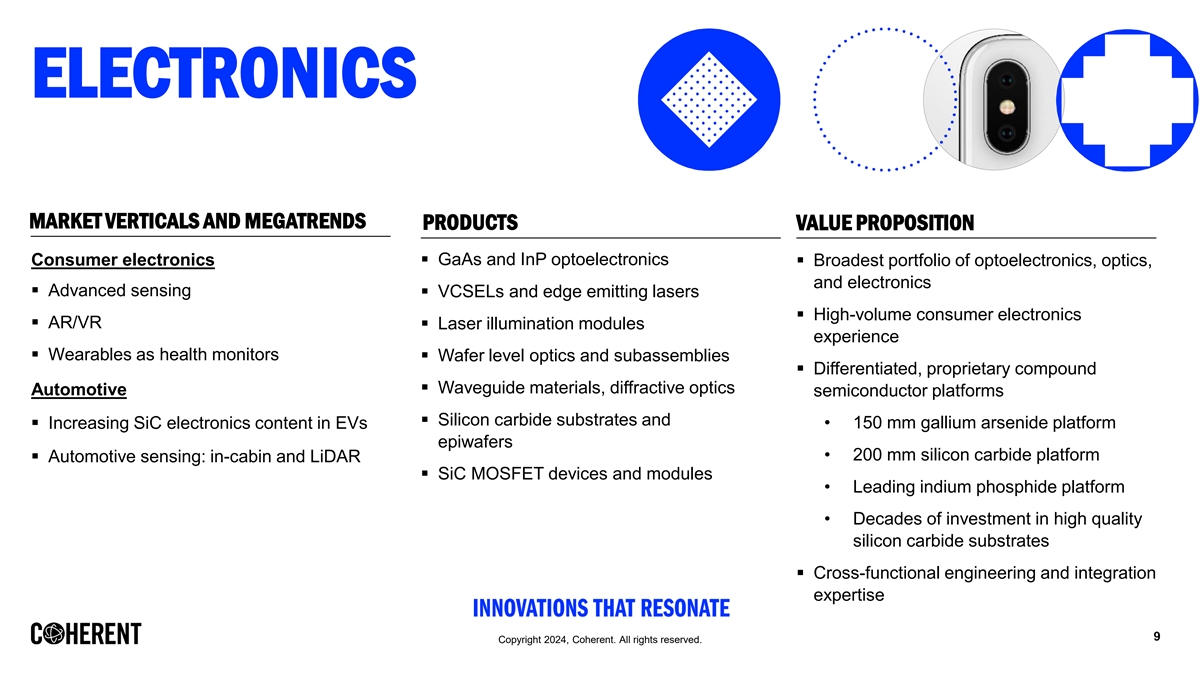
ELECTRONICS MARKET VERTICALS AND MEGATRENDS PRODUCTS VALUE PROPOSITION
§ GaAs and InP optoelectronics Consumer electronics§ Broadest portfolio of optoelectronics, optics, and electronics § Advanced sensing § VCSELs and edge emitting lasers § High-volume consumer electronics § AR/VR §
Laser illumination modules experience § Wearables as health monitors § Wafer level optics and subassemblies § Differentiated, proprietary compound § Waveguide materials, diffractive optics Automotive semiconductor platforms
§ Silicon carbide substrates and § Increasing SiC electronics content in EVs • 150 mm gallium arsenide platform epiwafers • 200 mm silicon carbide platform § Automotive sensing: in-cabin and LiDAR § SiC MOSFET devices
and modules • Leading indium phosphide platform • Decades of investment in high quality silicon carbide substrates § Cross-functional engineering and integration expertise 9 Copyright 2024, Coherent. All rights reserved.
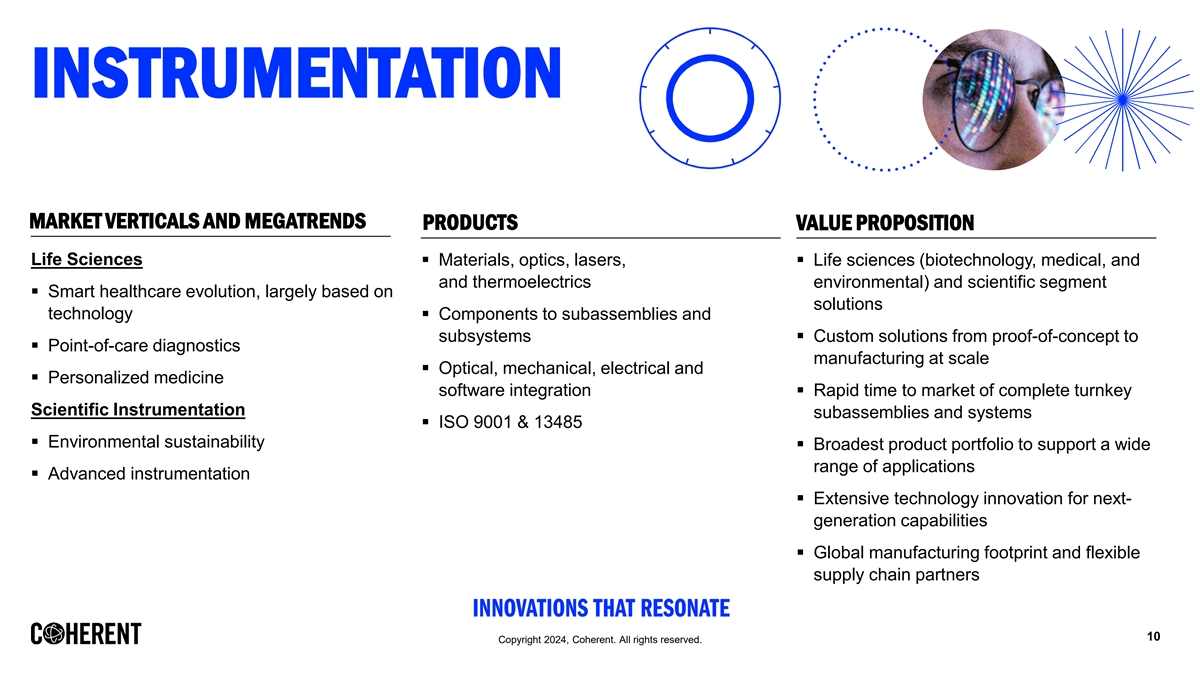
INSTRUMENTATION MARKET VERTICALS AND MEGATRENDS PRODUCTS VALUE
PROPOSITION Life Sciences § Materials, optics, lasers, § Life sciences (biotechnology, medical, and and thermoelectrics environmental) and scientific segment § Smart healthcare evolution, largely based on solutions technology§
Components to subassemblies and subsystems§ Custom solutions from proof-of-concept to § Point-of-care diagnostics manufacturing at scale § Optical, mechanical, electrical and § Personalized medicine software integration§
Rapid time to market of complete turnkey Scientific Instrumentation subassemblies and systems § ISO 9001 & 13485 § Environmental sustainability § Broadest product portfolio to support a wide range of applications § Advanced
instrumentation § Extensive technology innovation for next- generation capabilities § Global manufacturing footprint and flexible supply chain partners 10 Copyright 2024, Coherent. All rights reserved.
ARTIFICIAL INTELLIGENCE: A REVOLUTION Driving growth in the cloud and
beyond 11 Copyright 2024, Coherent. All rights reserved.
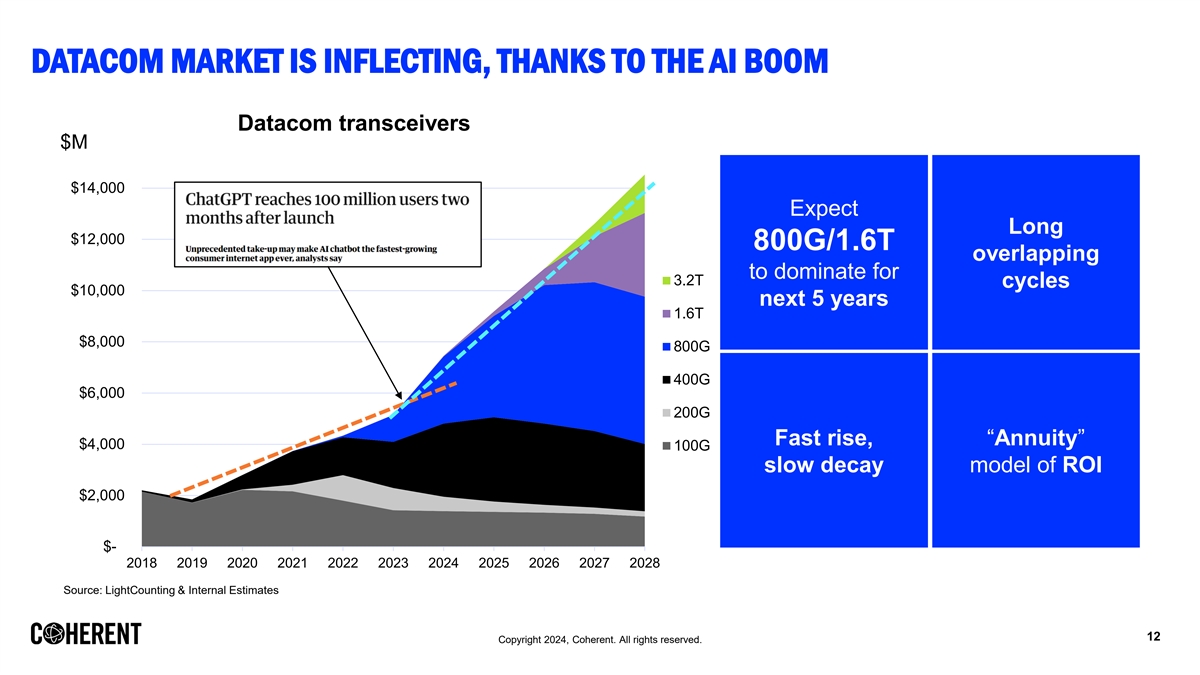
DATACOM MARKET IS INFLECTING, THANKS TO THE AI BOOM Datacom
transceivers $M $14,000 Expect Long $12,000 800G/1.6T overlapping to dominate for 3.2T cycles $10,000 next 5 years 1.6T $8,000 800G 400G $6,000 200G Fast rise, “Annuity” $4,000 100G slow decay model of ROI $2,000 $- 2018 2019 2020 2021
2022 2023 2024 2025 2026 2027 2028 Source: LightCounting & Internal Estimates 12 Copyright 2024, Coherent. All rights reserved.
SILICON CARBIDE POWER SEMICONDUCTORS: ANOTHER REVOLUTION
Electrification of transportation Sustainability of the planet 13 Copyright 2024, Coherent. All rights reserved.

SILICON CARBIDE BUSINESS OVERVIEW FY24 Key Stats Business Overview
Leading global supplier of silicon carbide (SiC) substrates for power device and radio frequency end market applications >50% — Large addressable market estimated to grow from $3 billion in 2022 to $21 billion in 2030 (28% CAGR) Growth Two
decades of innovation in SiC materials — Proprietary, in-house designed and built growth furnaces, control hardware and software — Industry’s first 200 mm substrate, with volume manufacturing scheduled for 2024 625 Profitable
Employees Vertical integration strategy from substrates to modules — Key technologies and development of SiC MOSFETs Global footprint with capacity to expand — 8 sites across 3 continents to support global customers — State-of-the-art
300,000 sq ft growth facility in Easton, PA with capacity to reach 1 million+ (150 mm equiv.) annual wafers 14 Copyright 2024, Coherent. All rights reserved.
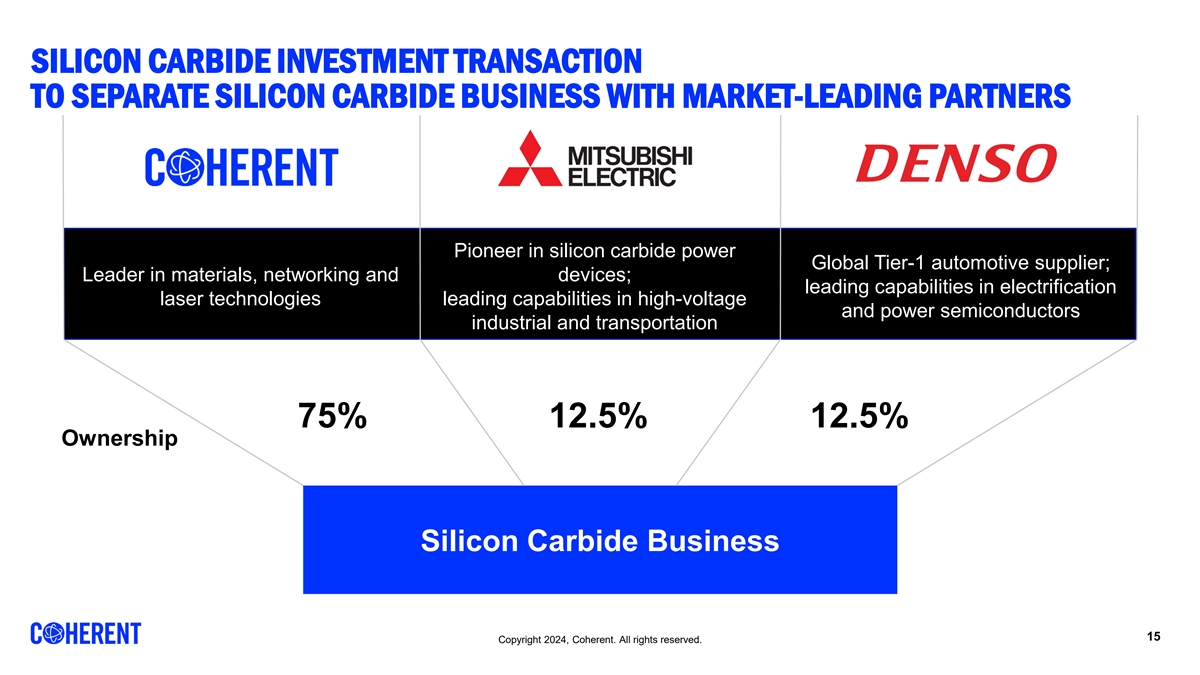
SILICON CARBIDE INVESTMENT TRANSACTION TO SEPARATE SILICON CARBIDE
BUSINESS WITH MARKET-LEADING PARTNERS Pioneer in silicon carbide power Global Tier-1 automotive supplier; Leader in materials, networking and devices; leading capabilities in electrification laser technologies leading capabilities in high-voltage
and power semiconductors industrial and transportation 75% 12.5% 12.5% Ownership Silicon Carbide Business 15 Copyright 2024, Coherent. All rights reserved.
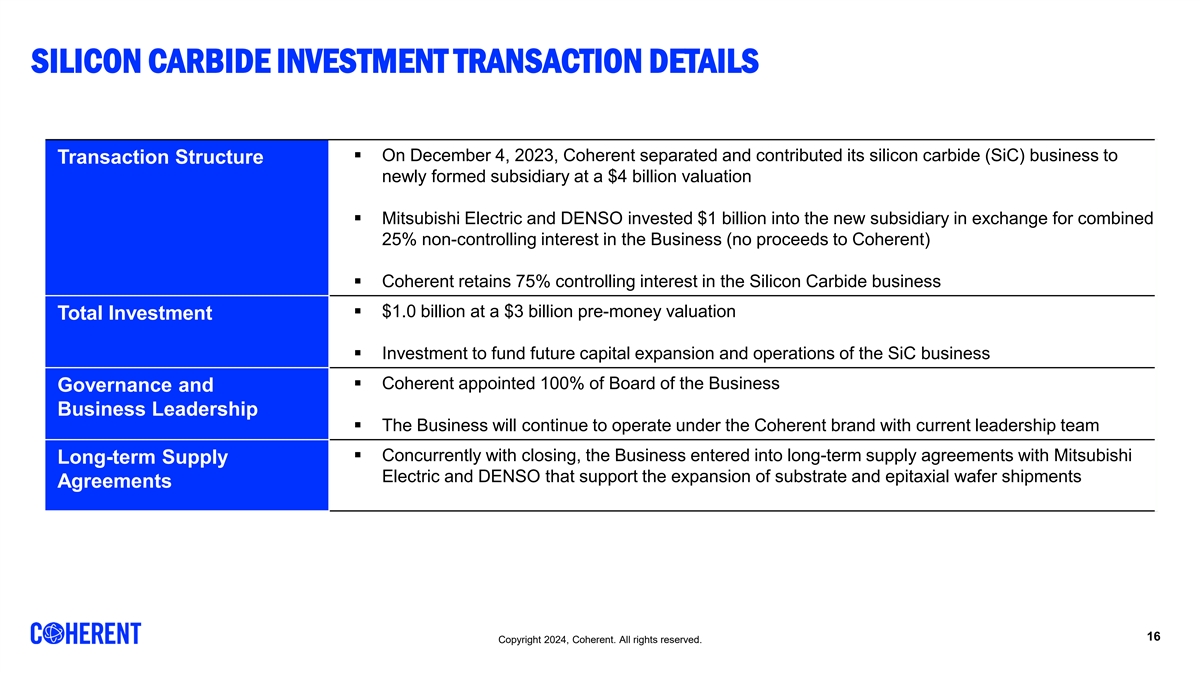
SILICON CARBIDE INVESTMENT TRANSACTION DETAILS § On December 4,
2023, Coherent separated and contributed its silicon carbide (SiC) business to Transaction Structure newly formed subsidiary at a $4 billion valuation § Mitsubishi Electric and DENSO invested $1 billion into the new subsidiary in exchange for
combined 25% non-controlling interest in the Business (no proceeds to Coherent) § Coherent retains 75% controlling interest in the Silicon Carbide business § $1.0 billion at a $3 billion pre-money valuation Total Investment §
Investment to fund future capital expansion and operations of the SiC business § Coherent appointed 100% of Board of the Business Governance and Business Leadership § The Business will continue to operate under the Coherent brand with
current leadership team § Concurrently with closing, the Business entered into long-term supply agreements with Mitsubishi Long-term Supply Electric and DENSO that support the expansion of substrate and epitaxial wafer shipments Agreements 16
Copyright 2024, Coherent. All rights reserved.
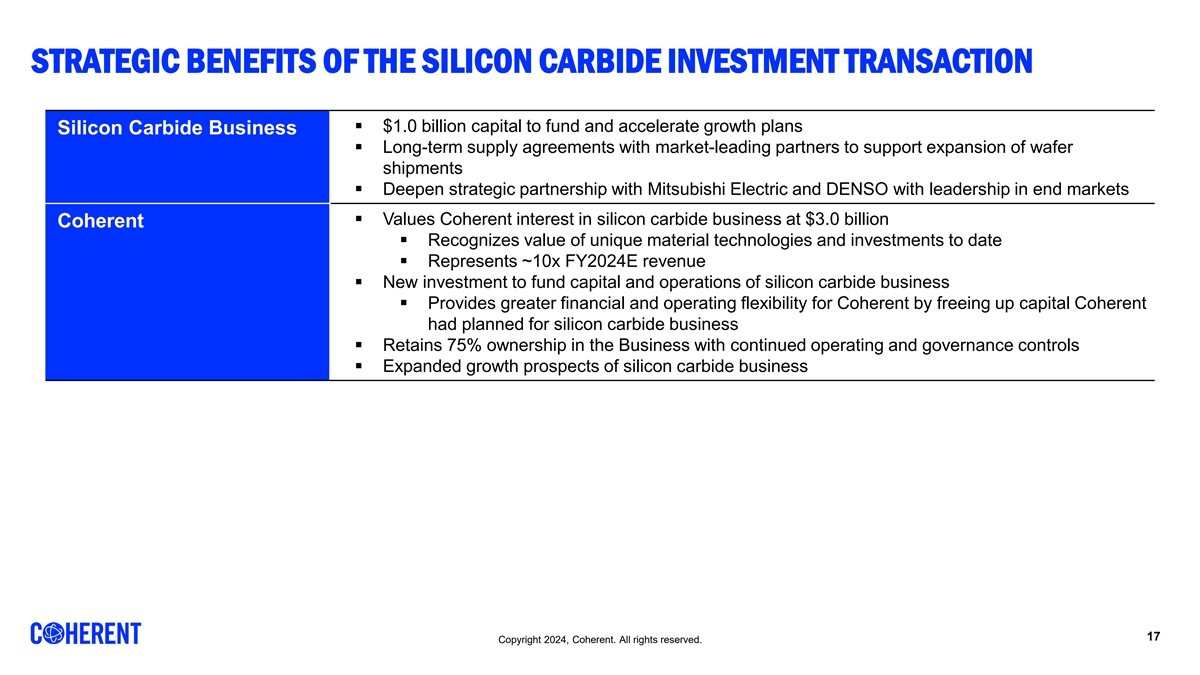
STRATEGIC BENEFITS OF THE SILICON CARBIDE INVESTMENT TRANSACTION §
$1.0 billion capital to fund and accelerate growth plans Silicon Carbide Business § Long-term supply agreements with market-leading partners to support expansion of wafer shipments § Deepen strategic partnership with Mitsubishi Electric
and DENSO with leadership in end markets § Values Coherent interest in silicon carbide business at $3.0 billion Coherent § Recognizes value of unique material technologies and investments to date § Represents ~10x FY2024E revenue
§ New investment to fund capital and operations of silicon carbide business § Provides greater financial and operating flexibility for Coherent by freeing up capital Coherent had planned for silicon carbide business § Retains 75%
ownership in the Business with continued operating and governance controls § Expanded growth prospects of silicon carbide business 17 Copyright 2024, Coherent. All rights reserved.

FINANCIAL HIGHLIGHTS 18 Copyright 2024, Coherent. All rights
reserved.
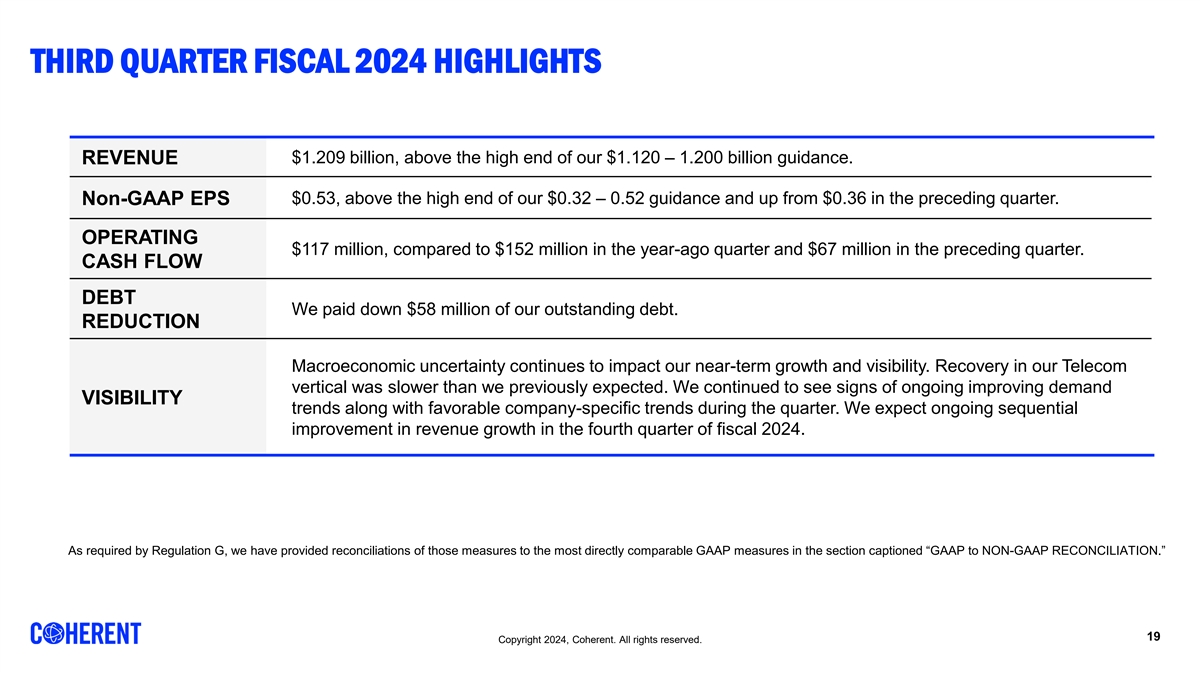
THIRD QUARTER FISCAL 2024 HIGHLIGHTS $1.209 billion, above the high end
of our $1.120 – 1.200 billion guidance. REVENUE $0.53, above the high end of our $0.32 – 0.52 guidance and up from $0.36 in the preceding quarter. Non-GAAP EPS OPERATING $117 million, compared to $152 million in the year-ago quarter and
$67 million in the preceding quarter. CASH FLOW DEBT We paid down $58 million of our outstanding debt. REDUCTION Macroeconomic uncertainty continues to impact our near-term growth and visibility. Recovery in our Telecom vertical was slower than we
previously expected. We continued to see signs of ongoing improving demand VISIBILITY trends along with favorable company-specific trends during the quarter. We expect ongoing sequential improvement in revenue growth in the fourth quarter of fiscal
2024. As required by Regulation G, we have provided reconciliations of those measures to the most directly comparable GAAP measures in the section captioned “GAAP to NON-GAAP RECONCILIATION.” 19 Copyright 2024, Coherent. All rights
reserved.

THIRD QUARTER FISCAL 2024 HIGHLIGHTS - CONTINUED We enjoyed a fourth
straight quarter of strong demand for our AI/ML-related Datacom transceivers. Our 800G revenue increased sequentially by almost 80% to almost $200 million and is on track to exceed $250M in our fourth quarter of fiscal 2024. In response to customer
demand, we are making progress AI/ML toward commercial launch of our 1.6T Datacom transceivers and components in calendar 2025. We expect to ship commercial samples of 1.6T Datacom transceivers to our customers starting in the first quarter of
fiscal 2025. As previously noted, as we transform the Company to improve operating performance, restructure our STRATEGIC production footprint to enhance operating resiliency, and complete the integration of legacy Coherent, Inc., we are exploring
other strategic opportunities—not including material acquisitions—to unlock shareholder OPPORTUNITIES value. 20 Copyright 2024, Coherent. All rights reserved.
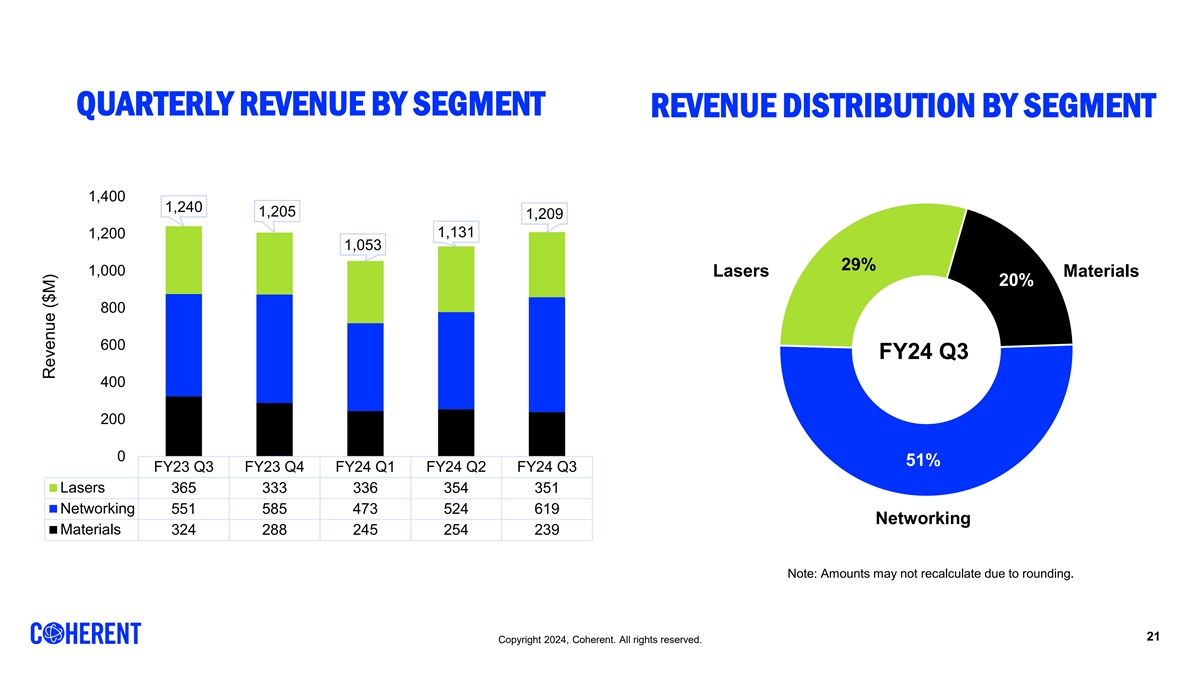
QUARTERLY REVENUE BY SEGMENT REVENUE DISTRIBUTION BY SEGMENT (1)
Revenue Distribution Quarterly Revenue by Segment 1,400 1,240 1,205 1,209 1,131 1,200 1,053 29% 1,000 Lasers Materials 20% 800 600 FY24 Q3 400 200 0 51% FY23 Q3 FY23 Q4 FY24 Q1 FY24 Q2 FY24 Q3 Lasers 365 333 336 354 351 Networking 551 585 473 524
619 Networking Materials 324 288 245 254 239 Note: Amounts may not recalculate due to rounding. 21 Copyright 2024, Coherent. All rights reserved. Revenue ($M)
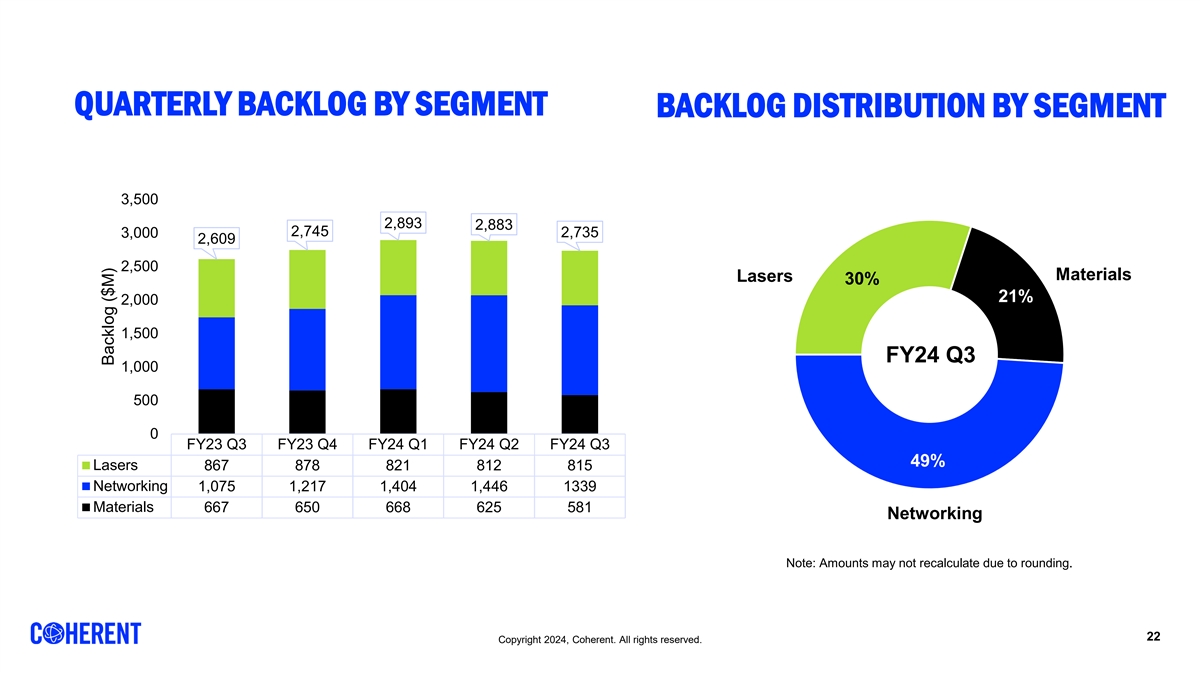
QUARTERLY BACKLOG BY SEGMENT BACKLOG DISTRIBUTION BY SEGMENT (1)
Quarterly Backlog Trend Backlog Distribution 3,500 2,893 2,883 2,745 3,000 2,735 2,609 2,500 Materials Lasers 30% 21% 2,000 1,500 FY24 Q3 1,000 500 0 FY23 Q3 FY23 Q4 FY24 Q1 FY24 Q2 FY24 Q3 49% Lasers 867 878 821 812 815 Networking 1,075 1,217 1,404
1,446 1339 Materials 667 650 668 625 581 Networking Note: Amounts may not recalculate due to rounding. 22 Copyright 2024, Coherent. All rights reserved. Backlog ($M)
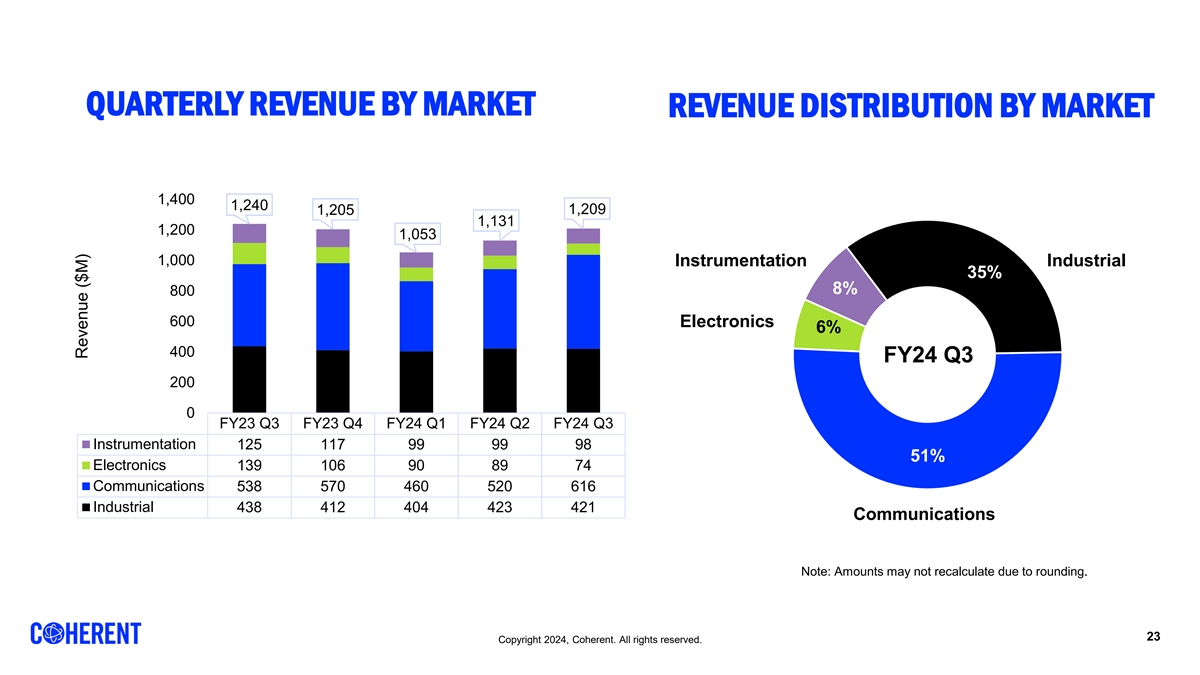
QUARTERLY REVENUE BY MARKET REVENUE DISTRIBUTION BY MARKET (1)
Quarterly Revenue Trend Revenue Distribution 1,400 1,240 1,209 1,205 1,131 1,200 1,053 1,000 Instrumentation Industrial 35% 8% 800 600 Electronics 6% 400 FY24 Q3 200 0 FY23 Q3 FY23 Q4 FY24 Q1 FY24 Q2 FY24 Q3 Instrumentation 125 117 99 99 98 51%
Electronics 139 106 90 89 74 Communications 538 570 460 520 616 Industrial 438 412 404 423 421 Communications Note: Amounts may not recalculate due to rounding. 23 Copyright 2024, Coherent. All rights reserved. Revenue ($M)
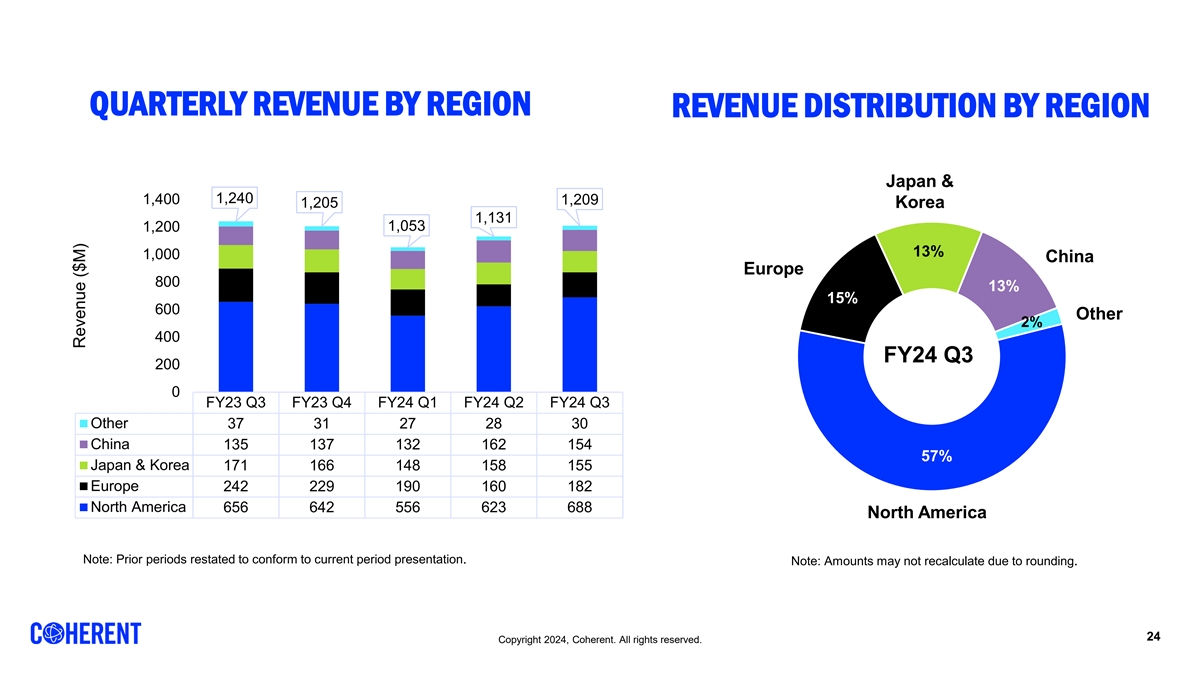
QUARTERLY REVENUE BY REGION REVENUE DISTRIBUTION BY REGION (1)
Quarterly Revenue Trend Revenue Distribution Japan & 1,240 1,400 1,209 1,205 Korea 1,131 1,053 1,200 13% 1,000 China Europe 800 13% 15% 600 Other 2% 400 FY24 Q3 200 0 FY23 Q3 FY23 Q4 FY24 Q1 FY24 Q2 FY24 Q3 Other 37 31 27 28 30 China 135 137 132
162 154 57% Japan & Korea 171 166 148 158 155 Europe 242 229 190 160 182 North America 656 642 556 623 688 North America Note: Prior periods restated to conform to current period presentation. Note: Amounts may not recalculate due to rounding.
24 Copyright 2024, Coherent. All rights reserved. Revenue ($M)
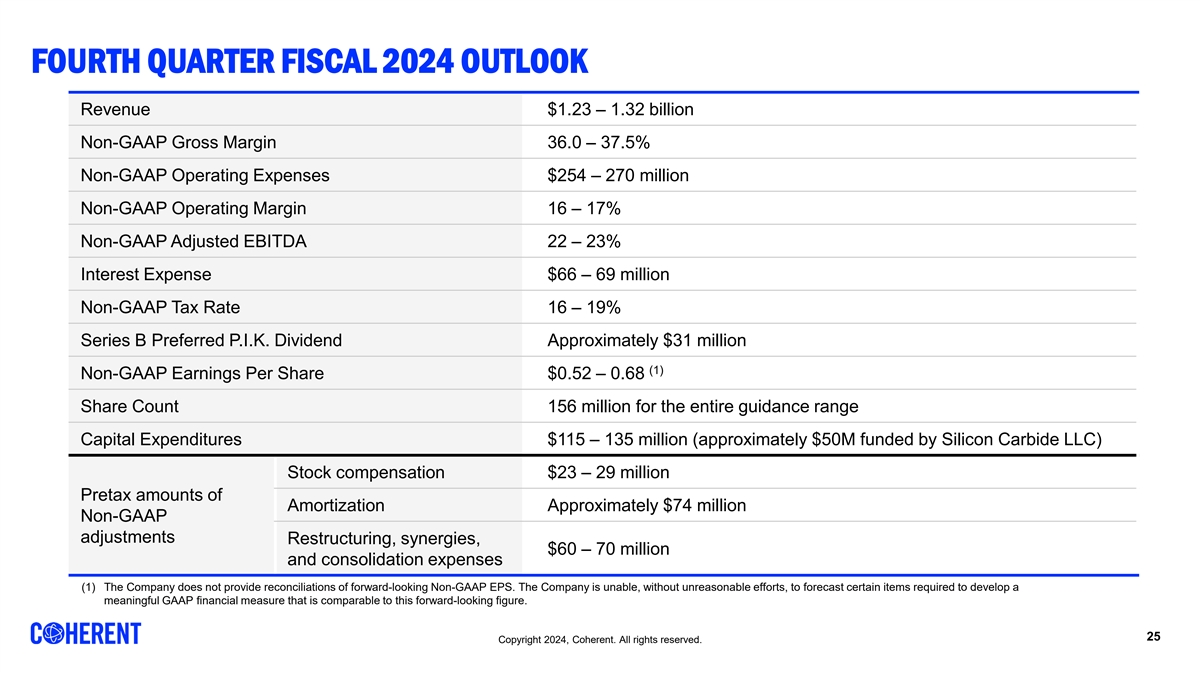
FOURTH QUARTER FISCAL 2024 OUTLOOK Revenue $1.23 – 1.32 billion
Non-GAAP Gross Margin 36.0 – 37.5% Non-GAAP Operating Expenses $254 – 270 million Non-GAAP Operating Margin 16 – 17% Non-GAAP Adjusted EBITDA 22 – 23% Interest Expense $66 – 69 million Non-GAAP Tax Rate 16 – 19%
Series B Preferred P.I.K. Dividend Approximately $31 million (1) Non-GAAP Earnings Per Share $0.52 – 0.68 Share Count 156 million for the entire guidance range Capital Expenditures $115 – 135 million (approximately $50M funded by Silicon
Carbide LLC) Stock compensation $23 – 29 million Pretax amounts of Amortization Approximately $74 million Non-GAAP adjustments Restructuring, synergies, $60 – 70 million and consolidation expenses (1) The Company does not provide
reconciliations of forward-looking Non-GAAP EPS. The Company is unable, without unreasonable efforts, to forecast certain items required to develop a meaningful GAAP financial measure that is comparable to this forward-looking figure. 25 Copyright
2024, Coherent. All rights reserved.
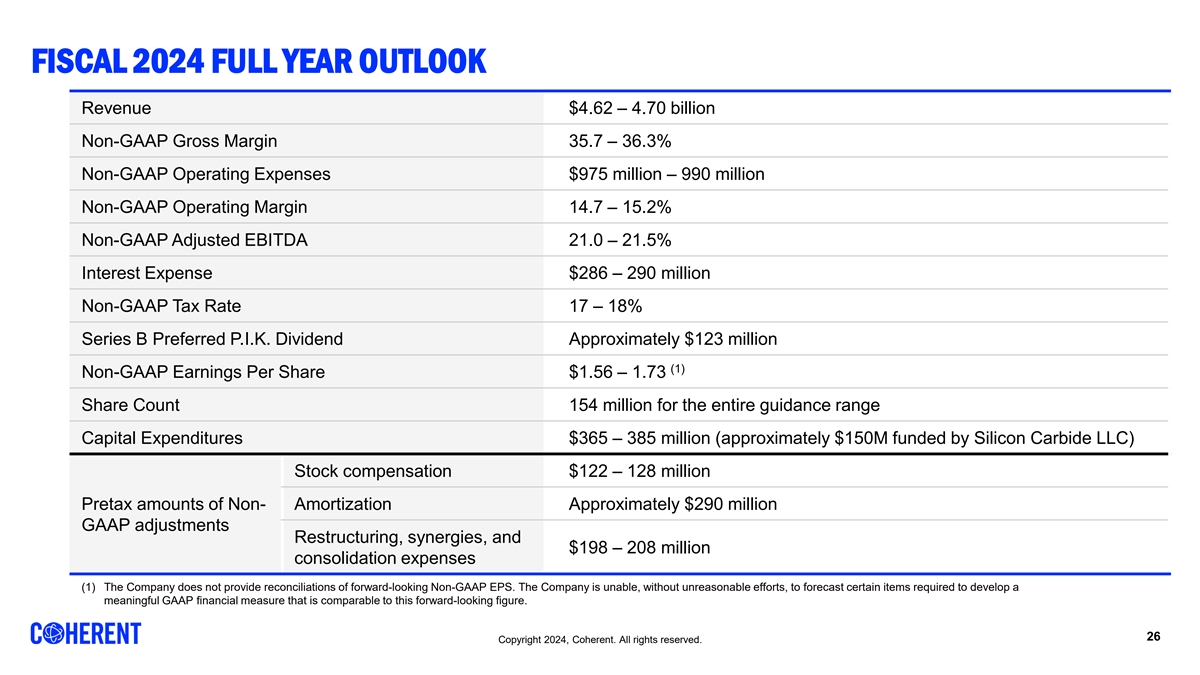
FISCAL 2024 FULL YEAR OUTLOOK Revenue $4.62 – 4.70 billion
Non-GAAP Gross Margin 35.7 – 36.3% Non-GAAP Operating Expenses $975 million – 990 million Non-GAAP Operating Margin 14.7 – 15.2% Non-GAAP Adjusted EBITDA 21.0 – 21.5% Interest Expense $286 – 290 million Non-GAAP Tax
Rate 17 – 18% Series B Preferred P.I.K. Dividend Approximately $123 million (1) Non-GAAP Earnings Per Share $1.56 – 1.73 Share Count 154 million for the entire guidance range Capital Expenditures $365 – 385 million (approximately
$150M funded by Silicon Carbide LLC) Stock compensation $122 – 128 million Pretax amounts of Non- Amortization Approximately $290 million GAAP adjustments Restructuring, synergies, and $198 – 208 million consolidation expenses (1) The
Company does not provide reconciliations of forward-looking Non-GAAP EPS. The Company is unable, without unreasonable efforts, to forecast certain items required to develop a meaningful GAAP financial measure that is comparable to this
forward-looking figure. 26 Copyright 2024, Coherent. All rights reserved.
GAAP TO NON-GAAP RECONCILIATION 27 Copyright 2024, Coherent. All rights
reserved.

GROSS PROFIT RECONCILIATION $ Millions (Unaudited) Mar 31, 2024 Dec 31,
2023 Sep 30, 2023 Jun 30, 2023 Mar 31, 2023 Gross profit on GAAP basis 367 351 307 343 420 Share-based compensation 5 5 7 5 7 Amortization of acquired intangibles 31 30 31 39 31 Fair value adjustment on acquired inventory — — —
— — Integration, site consolidation and other 30 22 21 46 6 Gross profit on non-GAAP basis 433 408 366 433 463 28 Copyright 2024, Coherent. All rights reserved.
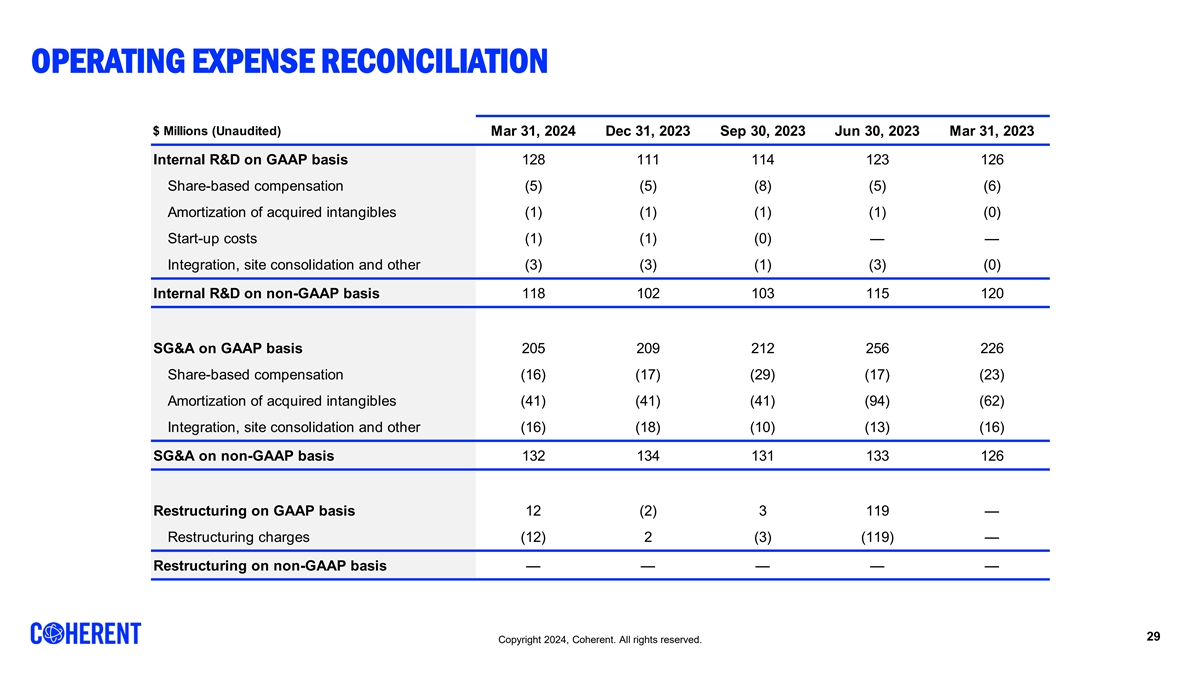
OPERATING EXPENSE RECONCILIATION $ Millions (Unaudited) Mar 31, 2024
Dec 31, 2023 Sep 30, 2023 Jun 30, 2023 Mar 31, 2023 Internal R&D on GAAP basis 128 111 114 123 126 Share-based compensation (5) (5) (8) (5) (6) Amortization of acquired intangibles (1) (1) (1) (1) (0) Start-up costs (1) (1) (0) — —
Integration, site consolidation and other (3) (3) (1) (3) (0) Internal R&D on non-GAAP basis 118 102 103 115 120 SG&A on GAAP basis 205 209 212 256 226 Share-based compensation (16) (17) (29) (17) (23) Amortization of acquired intangibles
(41) (41) (41) (94) (62) Integration, site consolidation and other (16) (18) (10) (13) (16) SG&A on non-GAAP basis 132 134 131 133 126 Restructuring on GAAP basis 12 (2) 3 119 — Restructuring charges (12) 2 (3) (119) — Restructuring
on non-GAAP basis — — — — — 29 Copyright 2024, Coherent. All rights reserved.
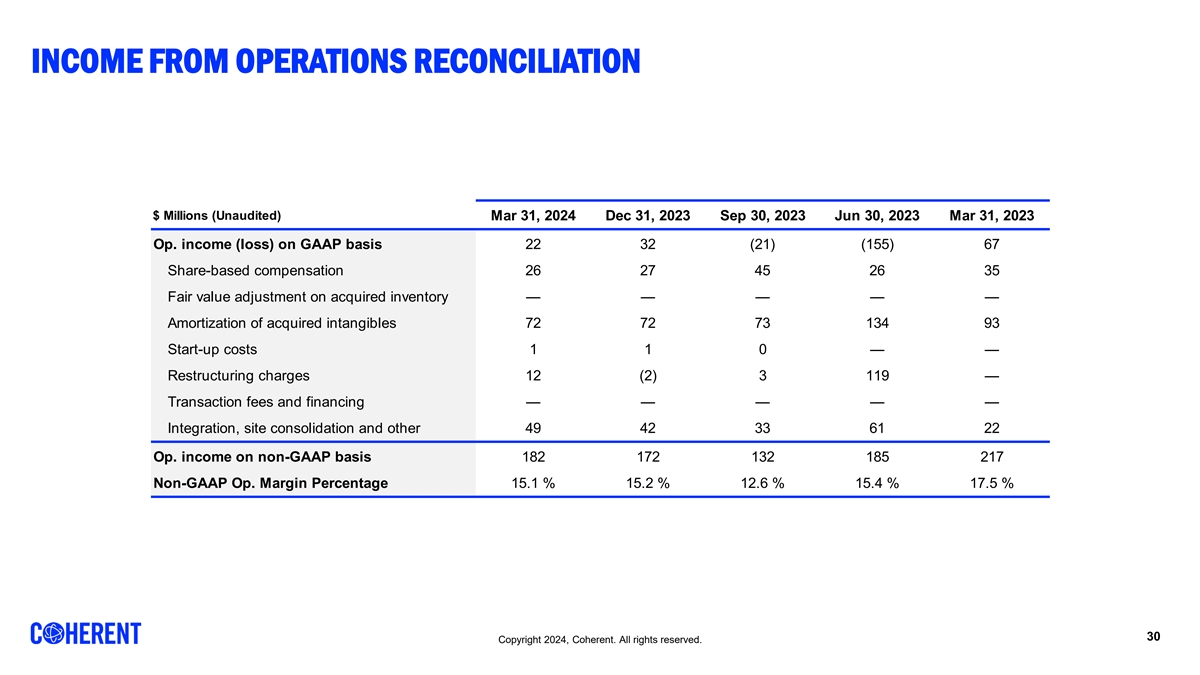
INCOME FROM OPERATIONS RECONCILIATION $ Millions (Unaudited) Mar 31,
2024 Dec 31, 2023 Sep 30, 2023 Jun 30, 2023 Mar 31, 2023 Op. income (loss) on GAAP basis 22 32 (21) (155) 67 Share-based compensation 26 27 45 26 35 Fair value adjustment on acquired inventory — — — — — Amortization of
acquired intangibles 72 72 73 134 93 Start-up costs 1 1 0 — — Restructuring charges 12 (2) 3 119 — Transaction fees and financing — — — — — Integration, site consolidation and other 49 42 33 61 22 Op.
income on non-GAAP basis 182 172 132 185 217 Non-GAAP Op. Margin Percentage 15.1 % 15.2 % 12.6 % 15.4 % 17.5 % 30 Copyright 2024, Coherent. All rights reserved.
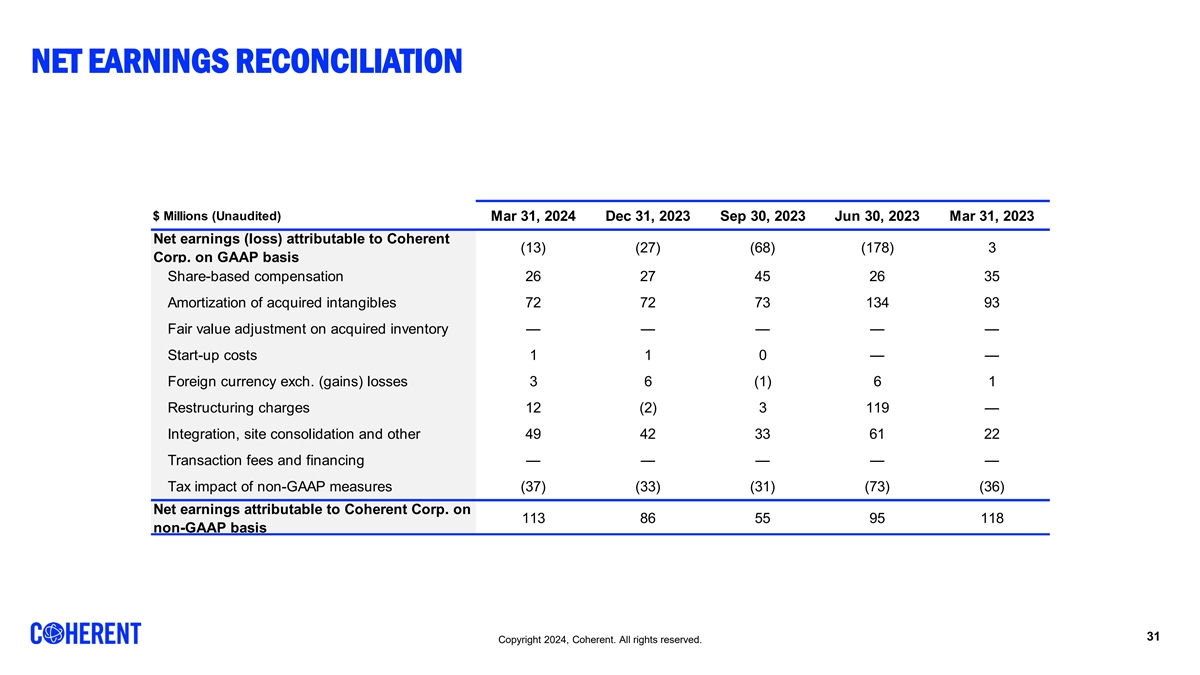
NET EARNINGS RECONCILIATION $ Millions (Unaudited) Mar 31, 2024 Dec 31,
2023 Sep 30, 2023 Jun 30, 2023 Mar 31, 2023 Net earnings (loss) attributable to Coherent (13) (27) (68) (178) 3 Corp. on GAAP basis Share-based compensation 26 27 45 26 35 Amortization of acquired intangibles 72 72 73 134 93 Fair value adjustment on
acquired inventory — — — — — Start-up costs 1 1 0 — — Foreign currency exch. (gains) losses 3 6 (1) 6 1 Restructuring charges 12 (2) 3 119 — Integration, site consolidation and other 49 42 33 61 22
Transaction fees and financing — — — — — Tax impact of non-GAAP measures (37) (33) (31) (73) (36) Net earnings attributable to Coherent Corp. on 113 86 55 95 118 non-GAAP basis 31 Copyright 2024, Coherent. All rights
reserved.
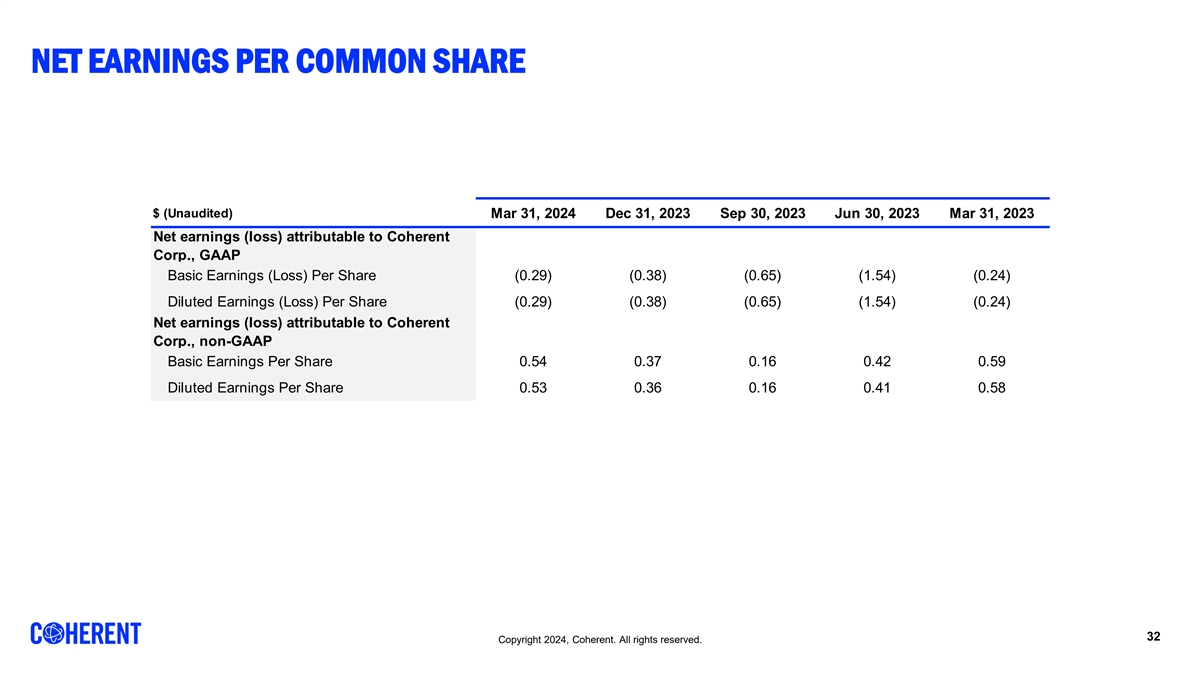
NET EARNINGS PER COMMON SHARE $ (Unaudited) Mar 31, 2024 Dec 31, 2023
Sep 30, 2023 Jun 30, 2023 Mar 31, 2023 Net earnings (loss) attributable to Coherent Corp., GAAP Basic Earnings (Loss) Per Share (0.29) (0.38) (0.65) (1.54) (0.24) Diluted Earnings (Loss) Per Share (0.29) (0.38) (0.65) (1.54) (0.24) Net earnings
(loss) attributable to Coherent Corp., non-GAAP Basic Earnings Per Share 0.54 0.37 0.16 0.42 0.59 Diluted Earnings Per Share 0.53 0.36 0.16 0.41 0.58 32 Copyright 2024, Coherent. All rights reserved.
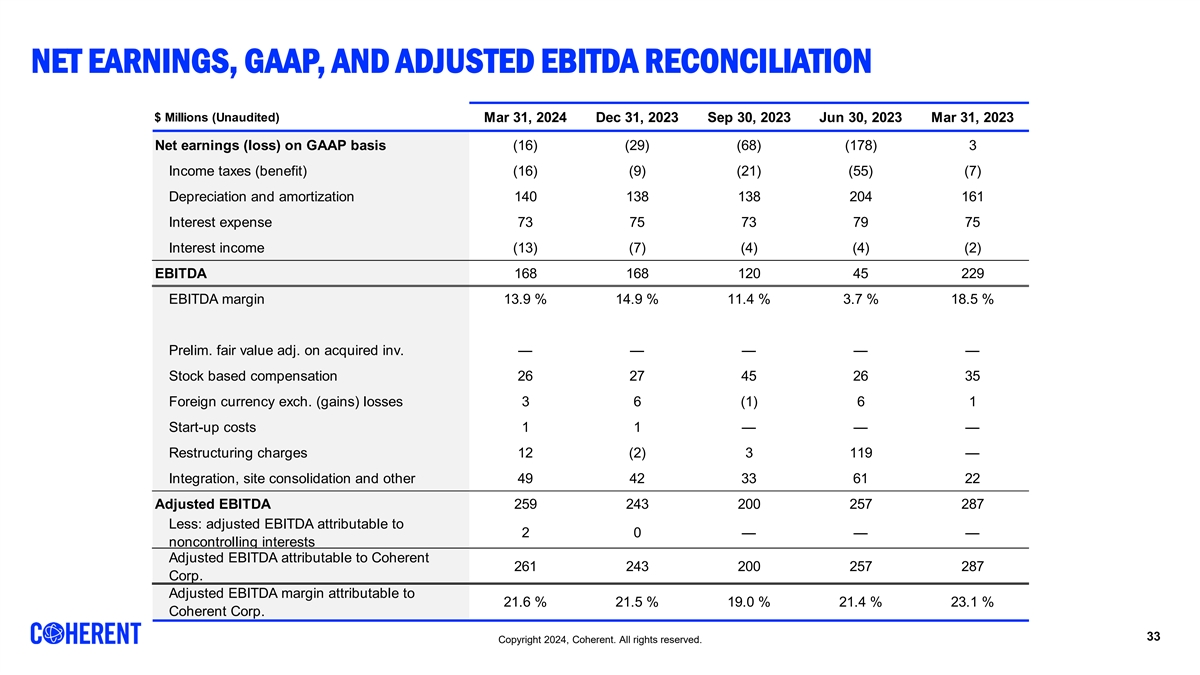
NET EARNINGS, GAAP, AND ADJUSTED EBITDA RECONCILIATION $ Millions
(Unaudited) Mar 31, 2024 Dec 31, 2023 Sep 30, 2023 Jun 30, 2023 Mar 31, 2023 Net earnings (loss) on GAAP basis (16) (29) (68) (178) 3 Income taxes (benefit) (16) (9) (21) (55) (7) Depreciation and amortization 140 138 138 204 161 Interest expense 73
75 73 79 75 Interest income (13) (7) (4) (4) (2) EBITDA 168 168 120 45 229 EBITDA margin 13.9 % 14.9 % 11.4 % 3.7 % 18.5 % Prelim. fair value adj. on acquired inv. — — — — — Stock based compensation 26 27 45 26 35
Foreign currency exch. (gains) losses 3 6 (1) 6 1 Start-up costs 1 1 — — — Restructuring charges 12 (2) 3 119 — Integration, site consolidation and other 49 42 33 61 22 Adjusted EBITDA 259 243 200 257 287 Less: adjusted
EBITDA attributable to 2 0 — — — noncontrolling interests Adjusted EBITDA attributable to Coherent 261 243 200 257 287 Corp. Adjusted EBITDA margin attributable to 21.6 % 21.5 % 19.0 % 21.4 % 23.1 % Coherent Corp. 33 Copyright
2024, Coherent. All rights reserved.

Reconciliation of GAAP Segment Operating Income (Loss) to Segment
Non-GAAP Operating Income (Loss)* RECONCILIATION OF GAAP MEASURES $ Millions (Unaudited) Three Months Ended Year Ended Jun 30, Mar 31, Jun 30, Jun 30, Jun 30, TO NON-GAAP MEASURES 2023 2023 2022 2023 2022 Networking GAAP Operating Income (Loss) $
(8.1) $ 49.5 $ 67.1 $ 222.4 $ 231.6 Share-based compensation 7.6 6.9 3.1 33.6 30.9 Amortization of acquired intangibles(1) 22.9 16.5 16.5 72.3 66.3 Restructuring charges 55.6 — — 55.6 — (2) Integration, site consolidation and
other(3) 0.9 1.8 2.3 5.2 6.2 Transaction fees and financing — — 0.5 — 0.5 (4) Non-GAAP Networking Operating Income $ 78.9 $ 74.7 $ 89.5 $ 389.1 $ 335.5 Reconciliation of GAAP Measures to non-GAAP Measures* Materials GAAP Operating
Income (Loss) $ (65.0) $ 67.8 $ 53.5 $ 159.6 $ 218.6 $ Millions Share-based compensation 10.4 10.7 10.5 51.1 42.2 (Unaudited) Three Months Ended Year Ended Amortization of acquired intangibles 35.1 3.2 3.3 44.8 13.3 (1) Jun 30, Mar 31, Jun 30, Jun
30, Jun 30, Restructuring charges(2) 60.4 — — 60.4 — Integration, site consolidation and other(3) 29.4 7.3 5.2 40.5 8.1 2023 2023 2022 2023 2022 Transaction fees and financing — — 0.2 — 0.2 (4) Gross profit on
GAAP basis $ 343.4 $ 420.2 $ 326.0 $ 1,618.3 $ 1,265.5 Start-up costs(4) — — 6.4 — 32.3 Share-based compensation 4.9 6.5 0.9 22.9 5.1 Non-GAAP Materials Operating Income $ 70.2 $ 89.0 $ 79.1 $ 356.4 $ 314.7 Amortization of acquired
intangibles(1) 38.7 30.7 9.6 132.1 38.3 Preliminary fair value adjustment on acquired inventory — — — 157.5 — Lasers GAAP Operating Income (Loss) $ (82.1) $ (49.9) $ — $ (419.1) $ — Integration, site consolidation
and other 45.8 5.8 6.9 53.2 9.8 (3) Share-based compensation 8.4 17.5 — 64.9 — Start-up costs — — — — 2.8 (5) Amortization of acquired intangibles(1) 75.6 73.0 — 297.1 — Restructuring charges 3.1
— — 3.1 — (2) Gross profit on non-GAAP basis $ 432.8 $ 463.2 $ 343.4 $ 1,984.0 $ 1,321.5 Integration, site consolidation and other(3) 31.0 12.8 — 78.8 — Transaction fees and financing(4) — — — 38.7
— Operating income (loss) on GAAP basis $ (155.2) $ 67.4 $ 114.2 $ (37.1) $ 414.3 Preliminary fair value adjustment on acquired inventory — — — 157.5 — Share-based compensation 26.4 35.1 13.5 149.6 73.1 Non-GAAP Lasers
Operating Income $ 36.0 $ 53.4 $ — $ 221.0 $ — Amortization of acquired intangibles 133.5 92.7 19.9 414.1 79.7 (1) Preliminary fair value adjustment on acquired inventory — — — 157.5 — Unallocated and Other GAAP
Operating Income (Loss) $ — $ — $ (6.4) $ — $ (35.9) Transaction fees and financing(4) — — 6.4 — 35.9 Restructuring charges(1) 119.1 — — 119.1 — Non-GAAP Unallocated and Other GAAP Operating
Integration, site consolidation and other(2) 61.3 21.9 7.5 124.5 14.3 $ — $ — $ — $ — $ — Income (Loss) Transaction fees and financing(3) — — 7.1 38.7 36.6 Start-up costs — — 6.4 — 32.3 (4)
Total GAAP Operating Income (Loss) $ (155.2) $ 67.4 $ 114.2 $ (37.1) $ 414.3 Operating income on non-GAAP basis $ 185.1 $ 217.1 $ 168.6 $ 966.5 $ 650.2 Non-GAAP Operating Income $ 185.1 $ 217.1 $ 168.6 $ 966.5 $ 650.2 34 Copyright 2024, Coherent.
All rights reserved.

v3.24.1.u1
| X |
- DefinitionBoolean flag that is true when the XBRL content amends previously-filed or accepted submission.
| Name: |
dei_AmendmentFlag |
| Namespace Prefix: |
dei_ |
| Data Type: |
xbrli:booleanItemType |
| Balance Type: |
na |
| Period Type: |
duration |
|
| X |
- DefinitionFor the EDGAR submission types of Form 8-K: the date of the report, the date of the earliest event reported; for the EDGAR submission types of Form N-1A: the filing date; for all other submission types: the end of the reporting or transition period. The format of the date is YYYY-MM-DD.
| Name: |
dei_DocumentPeriodEndDate |
| Namespace Prefix: |
dei_ |
| Data Type: |
xbrli:dateItemType |
| Balance Type: |
na |
| Period Type: |
duration |
|
| X |
- DefinitionThe type of document being provided (such as 10-K, 10-Q, 485BPOS, etc). The document type is limited to the same value as the supporting SEC submission type, or the word 'Other'.
| Name: |
dei_DocumentType |
| Namespace Prefix: |
dei_ |
| Data Type: |
dei:submissionTypeItemType |
| Balance Type: |
na |
| Period Type: |
duration |
|
| X |
- DefinitionAddress Line 1 such as Attn, Building Name, Street Name
| Name: |
dei_EntityAddressAddressLine1 |
| Namespace Prefix: |
dei_ |
| Data Type: |
xbrli:normalizedStringItemType |
| Balance Type: |
na |
| Period Type: |
duration |
|
| X |
- Definition
+ References
+ Details
| Name: |
dei_EntityAddressCityOrTown |
| Namespace Prefix: |
dei_ |
| Data Type: |
xbrli:normalizedStringItemType |
| Balance Type: |
na |
| Period Type: |
duration |
|
| X |
- DefinitionCode for the postal or zip code
| Name: |
dei_EntityAddressPostalZipCode |
| Namespace Prefix: |
dei_ |
| Data Type: |
xbrli:normalizedStringItemType |
| Balance Type: |
na |
| Period Type: |
duration |
|
| X |
- DefinitionName of the state or province.
| Name: |
dei_EntityAddressStateOrProvince |
| Namespace Prefix: |
dei_ |
| Data Type: |
dei:stateOrProvinceItemType |
| Balance Type: |
na |
| Period Type: |
duration |
|
| X |
- DefinitionA unique 10-digit SEC-issued value to identify entities that have filed disclosures with the SEC. It is commonly abbreviated as CIK. Reference 1: http://www.xbrl.org/2003/role/presentationRef
-Publisher SEC
-Name Exchange Act
-Number 240
-Section 12
-Subsection b-2
| Name: |
dei_EntityCentralIndexKey |
| Namespace Prefix: |
dei_ |
| Data Type: |
dei:centralIndexKeyItemType |
| Balance Type: |
na |
| Period Type: |
duration |
|
| X |
- DefinitionIndicate if registrant meets the emerging growth company criteria. Reference 1: http://www.xbrl.org/2003/role/presentationRef
-Publisher SEC
-Name Exchange Act
-Number 240
-Section 12
-Subsection b-2
| Name: |
dei_EntityEmergingGrowthCompany |
| Namespace Prefix: |
dei_ |
| Data Type: |
xbrli:booleanItemType |
| Balance Type: |
na |
| Period Type: |
duration |
|
| X |
- DefinitionCommission file number. The field allows up to 17 characters. The prefix may contain 1-3 digits, the sequence number may contain 1-8 digits, the optional suffix may contain 1-4 characters, and the fields are separated with a hyphen.
| Name: |
dei_EntityFileNumber |
| Namespace Prefix: |
dei_ |
| Data Type: |
dei:fileNumberItemType |
| Balance Type: |
na |
| Period Type: |
duration |
|
| X |
- DefinitionTwo-character EDGAR code representing the state or country of incorporation.
| Name: |
dei_EntityIncorporationStateCountryCode |
| Namespace Prefix: |
dei_ |
| Data Type: |
dei:edgarStateCountryItemType |
| Balance Type: |
na |
| Period Type: |
duration |
|
| X |
- DefinitionThe exact name of the entity filing the report as specified in its charter, which is required by forms filed with the SEC. Reference 1: http://www.xbrl.org/2003/role/presentationRef
-Publisher SEC
-Name Exchange Act
-Number 240
-Section 12
-Subsection b-2
| Name: |
dei_EntityRegistrantName |
| Namespace Prefix: |
dei_ |
| Data Type: |
xbrli:normalizedStringItemType |
| Balance Type: |
na |
| Period Type: |
duration |
|
| X |
- DefinitionThe Tax Identification Number (TIN), also known as an Employer Identification Number (EIN), is a unique 9-digit value assigned by the IRS. Reference 1: http://www.xbrl.org/2003/role/presentationRef
-Publisher SEC
-Name Exchange Act
-Number 240
-Section 12
-Subsection b-2
| Name: |
dei_EntityTaxIdentificationNumber |
| Namespace Prefix: |
dei_ |
| Data Type: |
dei:employerIdItemType |
| Balance Type: |
na |
| Period Type: |
duration |
|
| X |
- DefinitionLocal phone number for entity.
| Name: |
dei_LocalPhoneNumber |
| Namespace Prefix: |
dei_ |
| Data Type: |
xbrli:normalizedStringItemType |
| Balance Type: |
na |
| Period Type: |
duration |
|
| X |
- DefinitionBoolean flag that is true when the Form 8-K filing is intended to satisfy the filing obligation of the registrant as pre-commencement communications pursuant to Rule 13e-4(c) under the Exchange Act. Reference 1: http://www.xbrl.org/2003/role/presentationRef
-Publisher SEC
-Name Exchange Act
-Number 240
-Section 13e
-Subsection 4c
| Name: |
dei_PreCommencementIssuerTenderOffer |
| Namespace Prefix: |
dei_ |
| Data Type: |
xbrli:booleanItemType |
| Balance Type: |
na |
| Period Type: |
duration |
|
| X |
- DefinitionBoolean flag that is true when the Form 8-K filing is intended to satisfy the filing obligation of the registrant as pre-commencement communications pursuant to Rule 14d-2(b) under the Exchange Act. Reference 1: http://www.xbrl.org/2003/role/presentationRef
-Publisher SEC
-Name Exchange Act
-Number 240
-Section 14d
-Subsection 2b
| Name: |
dei_PreCommencementTenderOffer |
| Namespace Prefix: |
dei_ |
| Data Type: |
xbrli:booleanItemType |
| Balance Type: |
na |
| Period Type: |
duration |
|
| X |
- DefinitionTitle of a 12(b) registered security. Reference 1: http://www.xbrl.org/2003/role/presentationRef
-Publisher SEC
-Name Exchange Act
-Number 240
-Section 12
-Subsection b
| Name: |
dei_Security12bTitle |
| Namespace Prefix: |
dei_ |
| Data Type: |
dei:securityTitleItemType |
| Balance Type: |
na |
| Period Type: |
duration |
|
| X |
- DefinitionName of the Exchange on which a security is registered. Reference 1: http://www.xbrl.org/2003/role/presentationRef
-Publisher SEC
-Name Exchange Act
-Number 240
-Section 12
-Subsection d1-1
| Name: |
dei_SecurityExchangeName |
| Namespace Prefix: |
dei_ |
| Data Type: |
dei:edgarExchangeCodeItemType |
| Balance Type: |
na |
| Period Type: |
duration |
|
| X |
- DefinitionBoolean flag that is true when the Form 8-K filing is intended to satisfy the filing obligation of the registrant as soliciting material pursuant to Rule 14a-12 under the Exchange Act. Reference 1: http://www.xbrl.org/2003/role/presentationRef
-Publisher SEC
-Name Exchange Act
-Section 14a
-Number 240
-Subsection 12
| Name: |
dei_SolicitingMaterial |
| Namespace Prefix: |
dei_ |
| Data Type: |
xbrli:booleanItemType |
| Balance Type: |
na |
| Period Type: |
duration |
|
| X |
- DefinitionTrading symbol of an instrument as listed on an exchange.
| Name: |
dei_TradingSymbol |
| Namespace Prefix: |
dei_ |
| Data Type: |
dei:tradingSymbolItemType |
| Balance Type: |
na |
| Period Type: |
duration |
|
| X |
- DefinitionBoolean flag that is true when the Form 8-K filing is intended to satisfy the filing obligation of the registrant as written communications pursuant to Rule 425 under the Securities Act. Reference 1: http://www.xbrl.org/2003/role/presentationRef
-Publisher SEC
-Name Securities Act
-Number 230
-Section 425
| Name: |
dei_WrittenCommunications |
| Namespace Prefix: |
dei_ |
| Data Type: |
xbrli:booleanItemType |
| Balance Type: |
na |
| Period Type: |
duration |
|
Grafico Azioni Coherent (NYSE:COHR)
Storico
Da Apr 2024 a Mag 2024

Grafico Azioni Coherent (NYSE:COHR)
Storico
Da Mag 2023 a Mag 2024
