XRP Analyst Sets $2 Target If It Holds Key Level – Can It Reach Multi-Year Highs?
24 Novembre 2024 - 11:30PM
NEWSBTC
XRP has emerged as a standout leader in the recent crypto rally,
delivering massive gains and fueling optimism among investors. The
price has skyrocketed by an astonishing 225% in under three weeks,
showing no signs of slowing down as momentum builds. This surge has
positioned it as a top-performing altcoin, capturing the attention
of analysts and traders alike. Related Reading: Avalanche Soars 20%
In 24 Hours – Analyst Reveals Next Price Target CrediBull, a
prominent analyst on X, has shared a detailed technical analysis
highlighting XRP’s strong bullish structure. According to his
insights, XRP is currently in a well-defined 5-wave impulsive move,
a pattern often associated with sustained upward trends. If it
continues to hold a critical support level, CrediBull predicts that
the price could soar past $2 in the coming weeks, marking a
significant milestone for the altcoin. As excitement grows, market
participants are closely watching its performance. The ongoing
rally suggests that XRP could hit new highs and pave the way for
broader altcoin gains. Whether it can maintain its upward
trajectory will depend on its ability to sustain key support levels
and capitalize on the current bullish sentiment. For now, XRP
remains a focal point in the market, with its next moves eagerly
anticipated. The Bullish Rally Could Continue The recent
bullish phase for XRP might be just the beginning as optimism
continues to build among analysts who foresee a higher price in the
months ahead. However, key price levels must be tested and
maintained for XRP to sustain its momentum and advance to the next
leg up. Prominent analyst CrediBull shared his insights on X,
revealing that XRP is currently in a clear 5-wave impulsive move, a
strong indicator of a bullish trend. According to his technical
analysis, this pattern confirms that XRP’s absolute bottom was
established at $0.49 earlier this year. He also emphasized the
importance of the $1.05 level, the origin of the fifth subwave in
this impulsive structure. CrediBull explained that if XRP falls
below $1.05, it could signal the start of a larger Wave 2
correction, which would likely precede the next major upward
impulse (Wave 3). However, if XRP holds firmly above $1.05, it
would indicate that the fifth subwave is extending, potentially
pushing the price to $2 or higher before any significant pullback
occurs. Related Reading: Massive Ethereum Buying Spree – Taker Buy
Volume hits $1.683B In One Hour This analysis reinforces the view
that XRP’s current rally may just be the start of a broader bullish
trend. Investors are now watching closely to see if XRP can
maintain key support levels and confirm its extended move upward.
XRP Hits Multi-Year Highs: ATH Next? XRP is trading at $1.45,
following an impressive rally that saw the price touch $1.63
yesterday, marking its highest level since May 2021. This milestone
has sparked optimism among investors, positioning XRP for a
potential run to new all-time highs in the coming months. The
sustained upward momentum reflects growing confidence in the
price’s bullish trajectory. However, the recent surge also brings
the possibility of consolidation. The price might need to cool off
and gather strength below the $1.63 mark before continuing its
upward movement. Consolidation phases are a natural part of any
significant rally and can help establish stronger support levels
for future price action. Related Reading: Bitcoin LTHs Start Taking
Profits – Metrics Reveal Whales Are Actively Spending The key level
to watch remains $1.05, identified as a critical support zone. If
the price holds above this mark, it will reinforce its bullish
outlook and set the stage for a potential breakout and continuation
of its upward trend in the weeks ahead. Analysts believe that
maintaining this level would be a strong signal of market
confidence, paving the way for XRP to build on its recent gains and
target new milestones. Featured image from Dall-E, chart from
TradingView
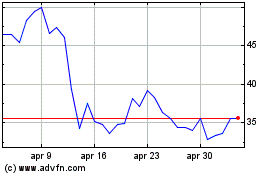
Grafico Azioni Avalanche (COIN:AVAXUSD)
Storico
Da Dic 2024 a Gen 2025

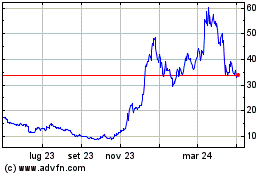
Grafico Azioni Avalanche (COIN:AVAXUSD)
Storico
Da Gen 2024 a Gen 2025
