Dogecoin Could Collapse If This Support Fails, Analyst Warns
20 Febbraio 2025 - 12:00PM
NEWSBTC
In a video on Wednesday, the popular YouTube channel More Crypto
Online offered an analysis of Dogecoin’s price structure,
suggesting that the meme-inspired cryptocurrency could be on the
cusp of a breakout or breakdown—provided it falls below critical
support levels. The analyst’s outlook centers around Elliott Wave
counts, potential consolidation patterns, and pivotal price
thresholds that could define Dogecoin’s short-term trajectory.
Dogecoin Teeters On The Edge The analyst notes that Dogecoin has
shown “only sideways action over the last few days, actually last
10 days or so,” following a significant selloff. According to the
channel’s host, the price dipped into a previously identified
support zone and has since failed to rally above the key resistance
at $0.34: Related Reading: Dogecoin Flashes Oversold Signal—Rebound
Ahead? “Unfortunately, we did not break above the $0.341 level in
that recovery and we haven’t yet broken above any signal line,
which is a shame because it keeps the price caught in this sideways
consolidation mode,” he said. Despite the muted price action, the
analyst believes Dogecoin may still form a classic A-B-C corrective
pattern, with the potential C-wave finding a bottom slightly below
the A-wave low: “If this really is an A-B-C structure, the C-wave
would normally end below the low of the A-wave […] doesn’t have to,
but that seems to be likely.” He estimates that the “ideal target”
for the C-wave sits around $0.233 to $0.234, derived from measuring
the length of the initial A-wave. Of particular importance is the
$0.22 level, which aligns with the 78.6% Fibonacci retracement.
Maintaining this zone is viewed as critical to preserving the
broader bullish scenario: “Only as long as the market holds above
$0.22, the overall let’s say bullish thesis remains intact […]
ideally we’re holding above it.” Any drop below this threshold
would seriously dent the bullish case, and another lower figure,
$0.204, is cited as the ultimate invalidation point. A decisive
break under either level could signal further downside: “Any break
below $0.22 will likely lead to invalidation […] the invalidation
point itself is a little lower, however, that’s at $0.204 and we
are far away from that at the moment.” Related Reading: Dogecoin
Repeating History? This Setup Led To 150% Gains From the analyst’s
perspective, Dogecoin would need to exceed certain “signal lines”
to provide stronger evidence of a trend reversal. He highlights
$0.293 as the first signal of a potential low, while a move beyond
$0.342 would be considered a more definitive upside breakout
trigger. “Once we finally start the third wave […] we need to get
above the first signal line […] better will be a break above the
upper signal line at $0.342,” the analyst states. In that scenario,
the structure would confirm a sustained bullish wave, potentially
validating expectations of a more pronounced Dogecoin rally. The
analyst emphasizes that much of the crypto market remains in
sideways territory. He specifically compares Dogecoin’s resilience
to Solana, which he notes has “dropped quite a bit,” while Dogecoin
appears to be “holding quite well.” Nevertheless, broader market
sentiment and macroeconomic factors continue to influence price
performance across the board. At press time, DOGE traded at $0.25.
Featured image created with DALL.E, chart from TradingView.com
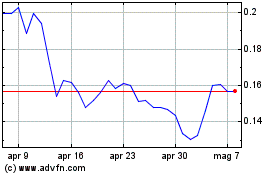
Grafico Azioni Dogecoin (COIN:DOGEUSD)
Storico
Da Gen 2025 a Feb 2025

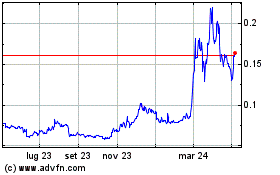
Grafico Azioni Dogecoin (COIN:DOGEUSD)
Storico
Da Feb 2024 a Feb 2025
