Solana (SOL) Could See A Correction Despite Historic Monthly Close, $400 Still On Sight?
03 Dicembre 2024 - 7:30AM
NEWSBTC
Solana (SOL) has been one of the leading cryptocurrencies
throughout this bull run, seeing a 66.8% jump in the last three
months to its latest all-time high (ATH) and flipping other rivals.
Despite its remarkable rally, SOL has recently lost the spotlight
to Altcoins like XRP, risking a major correction in the coming
days. Related Reading: Cardano Could Be Heading For A 20%
Correction – Technical Data Signals Bearish Price Structure Solana
To Retest $200? Solana has outperformed most of the market during
this cycle, leaping over 231% in the last year. The ecosystem has
been the talk of the town, with Solana-based memecoins leading the
market’s narrative and SOL’s DeFi activity outpacing Ethereum’s.
Less than a month ago, the cryptocurrency’s bullish rally saw the
altcoin surpass Binance Coin (BNB) as the fourth-largest token by
market capitalization. SOL saw its price rise near the $200 zone,
propelling its market capitalization to $88 billion on November 6.
Since then, its market cap has surged nearly 20% to $105 billion,
but SOL’s momentum has begun to slow down as other cryptocurrencies
pick up steam. On Sunday, XRP flipped Solana and Tether (USDT) to
become the third-largest crypto by market cap, sending SOL to the
fifth position. XRP’s milestone made some investors and market
watchers worry about SOL’s future performance since the
cryptocurrency has experienced a 14% retrace from its latest ATH of
$263 nine, recorded nine days ago. Crypto analyst Income Sharks
noted that Solana displays a bearish structure on its lower
timeframe chart. According to the post, the altcoin has been
forming a Head and Shoulders (H&S) pattern in the past month
after a three-week diagonal trendline break, suggesting a trend
reversal for Solana. On Sunday night, SOL dropped below the $230
mark, hitting its lowest price since November 15 and breaking below
the pattern’s neckline. This could potentially send Solana to
retrace around 10% and test its previous support zone between the
$200-$210 range. Similarly, crypto analyst CRG noted that a retest
of these levels would be possible before bouncing to new highs. SOL
Sees Historic November Close Despite the recent retrace, several
crypto watchers consider SOL’s rally is far from over, highlighting
the token’s strength throughout the cycle and its achievements.
Crypto Jelle pointed out that Solana still targets the $400-$600 in
its price discovery mode after it broke out of an 8-month bullish
pennant in November and “locked in a monthly breakout too.”
Likewise, Rekt Capital noted that the cryptocurrency recorded a
historic close this November, as it saw its “Highest candle-bodied
Monthly Close of all-time.” Other analysts also concurred, hinting
that investors should remain optimistic about the $400 target as
momentum remains strong. Related Reading: Fantom Price Breakout:
Analyst Shares Anatomy Of FTM’s 18,000% Move To $150 By 2025
Moreover, Solana displays a multi-year Cup & Handle pattern,
which has a potential 100% rally to the $400 target after last
month’s breakout from the handle’s trendline. SOL records a 5.3%
and 7.2% decline in the daily and weekly timeframes but shows a
36.3% surge in the last month. As of this writing, Solana is
trading at $224, with a 97% increase in its daily trading volume.
Featured Image from Unsplash.com, Chart from TradingView.com
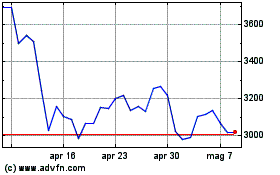
Grafico Azioni Ethereum (COIN:ETHUSD)
Storico
Da Nov 2024 a Dic 2024

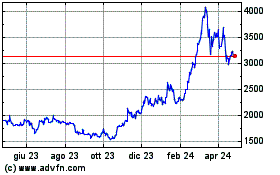
Grafico Azioni Ethereum (COIN:ETHUSD)
Storico
Da Dic 2023 a Dic 2024
