Fantom Price Breakout: Analyst Shares Anatomy Of FTM’s 18,000% Move To $150 By 2025
02 Dicembre 2024 - 1:30PM
NEWSBTC
A recent technical analysis on TradingView has drawn attention to
the Fantom price, with a projected 18,000% increase to reach $150
by 2025. Ultra-bullish predictions are common in the crypto market,
but this one is exceptionally optimistic for Fantom. The technical
analysis, which dates back to the crypto’s price action in late
2020, bases the ultra-bullish prediction on historical price trends
and technical patterns forming on the Fantom price chart. Anatomy
Of FTM’s 18,000% Move The analyst’s prediction begins by
highlighting Fantom’s significant price correction of 70% from its
2021 all-time high of $3.46. Despite this, technical indicators
show that investors are now adopting a bullish outlook on the
cryptocurrency. The 10-day Fantom/TetherUS chart reveals resistance
breakouts in both the price action and the RSI indicator, signaling
a shift in momentum from bearish to bullish. Consequently, the
analyst’s technical setup now indicates a bullish reversal in
progress. Related Reading: XRP Price Prediction: Analyst
Gives Reasons For Why $10,000 Is A Feasible Price Target Central to
the forecast is the bull flag pattern that spans Fantom’s price
movements over the past three years. Notably, recent price action
has seen the Fantom price breaking above this bull flag pattern.
The analyst notes that if this pattern repeats the impulsive wave
seen in Fantom’s rally in 2021, the cryptocurrency could achieve
another 18,000% increase. Back in 2021, this 18,000% increase saw
the price of Fantom go from around $0.015 in November 2020 to $3.46
by October 2021. Although the cryptocurrency landscape has changed
since then, the analyst predicted that Fantom could repeat another
18,000% move in light of the bull flag breakout. This would
translate to a price of $150 from the current price level. Such a
move would undoubtedly see Fantom outperforming most
cryptocurrencies. Nonetheless, the analysis emphasizes the need for
patience, as corrections of up to 80% may occur during the
projected climb. The confluence of multiple technical indicators,
visualized through red and blue arrows on the chart below, further
supports the forecast. Key Resistance Levels And Risk Assessment
The analyst identifies $3 as the first major resistance level,
highlighted by the formation of an inverse head-and-shoulders
pattern. Breaking through this zone would be a crucial step in
validating the bullish trajectory. Related Reading: Dogecoin Price
Completes First Bull Phase Similar To 2021, Here’s What Comes Next
At the time of writing, Fantom (FTM) is trading at $1.03. Its price
movements in the past seven days have traded between the upper and
lower ends of $1.29 and $0.987, respectively. However, Fantom is
still bullish on the larger timeframe, as it is currently up by
over 61% in the past 30 days. An 18,000 projection from the
current levels would require far more capital inflow than it did in
2021, when Fantom was trading around 1 cent. Regardless of how this
18,000% projection plays out, the Fantom price is on track to keep
on its steady growth alongside the rest of the crypto market,
especially if an altcoin season eventually rolls in.
Featured image created with Dall.E, chart from Tradingview.com
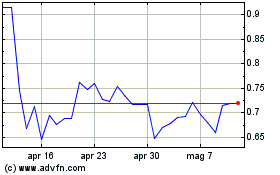
Grafico Azioni Fantom Token (COIN:FTMUSD)
Storico
Da Nov 2024 a Dic 2024

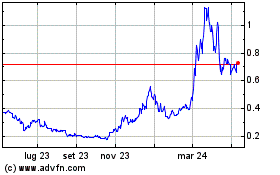
Grafico Azioni Fantom Token (COIN:FTMUSD)
Storico
Da Dic 2023 a Dic 2024
