Is Chainlink (LINK) Ready To Soar? Key Indicators To Monitor
26 Gennaio 2024 - 3:00PM
NEWSBTC
Among the 20 most important cryptocurrencies by market
capitalization, Chainlink (LINK) is currently recording the
second-highest loss of -10.4 % in the last seven days. This puts it
just behind Ethereum, which recorded a slightly sharper decline of
-10.9 %. Despite this, a glimmer of optimism emerges when delving
into the 1-day chart of LINK/USD. The analysis suggests a potential
turnaround on the horizon. Should the current market structure
remain intact, there’s a promising indication that the recent
corrective phase for LINK might be drawing to a close. Chainlink
Price Analysis: Indicators To Watch Several key indicators and
patterns emerge that warrant the attention of traders and investors
alike. Firstly, the price action has been demonstrating a series of
higher lows, which could be indicative of an ascending triangle
pattern forming – a bullish continuation pattern. As long as the
LINK price holds above the rising trend (black line) established in
late October of the previous year, the bulls remain in control. At
press time, LINK was trading at $13.82, presenting a nuanced
narrative in its Exponential Moving Average (EMA) positioning. A
critical observation is that LINK’s price is buoyantly positioned
above the longer-term 100-day and 200-day EMAs, recorded at
$14.6679316 and $11.61, respectively. This configuration typically
signals a robust long-term bullish momentum, underpinning investor
confidence in the asset. Contrastingly, the short-term outlook is
conveyed by the positioning of the 20-day and 50-day EMAs. With the
20-day EMA at $14.67 and the 50-day EMA at $14.58, both hover above
the current price level, imparting a potential resistance zone.
This immediate overhead resistance is indicative of a short-term
bearish pressure or consolidation phase, possibly reflecting a
market pause as traders and investors reassess their positions. The
Fibonacci retracement levels, drawn from the swing low in June to
the peak in December, suggest that LINK has recently tested the
0.236 retracement level at $14.70 as resistance. The subsequent
levels to watch are 0.382 at $12.85, followed by 0.5 at $11.53,
which could serve as potential support levels if a bearish reversal
occurs. Conversely, a break above the 0.236 level may open the door
to test the $17.69 level, which stands as a significant resistance.
Related Reading: Chainlink Gets Whale Backing: LINK Price Up 14%
Amid Market Dip On the volume front, trading activity has been
moderate, with no significant spikes indicating a decisive market
direction. The Relative Strength Index (RSI) is hovering around the
50 mark, which typically denotes a neutral market sentiment without
clear overbought or oversold conditions. The MACD indicator
exhibits a bearish signal with the MACD line at -0.1407939,
positioned below the signal line, which is at -0.1508732. The
negative value of the MACD line suggests that the short-term
momentum is weaker than the long-term momentum, indicating bearish
sentiment in the current market. Furthermore, the distance between
the MACD and the signal line is very narrow, as reflected by the
small histogram value of -0.0100794. This small negative histogram
value indicates a weakening of downward momentum, as the MACD line
is close to crossing above the signal line. Traders might view such
a crossover as a potential change in momentum, possibly hinting at
an upcoming bullish phase. However, until the crossover occurs, the
prevailing sentiment indicated by the MACD remains bearish in the
short term. LINK/BTC: Bulls In Control The LINK/BTC trading pair
(weekly chart) is also favoring the bulls. The descending trend
line, which has historically acted as a resistance since the peak
in 2020, was decisively broken in October last year. This breakout
is a key development, indicating a potential reversal of the
downtrend that has dominated the LINK/BTC pair for a significant
period. Related Reading: Chainlink (LINK) Breakout: Accumulation
Zone Points To Upside Potential, $20 In Sight Following the
breakout, a retest of the descending trend line occurred, a move
often anticipated by technical analysts. The successful retest
occurred in the second week of January, when the price bounced off
the trend line, reinforcing it as a new support level. This retest
is indicative of a shift in market sentiment, where former
resistance levels transform into support, a classical sign of a
trend reversal. A breakout above 0.0004472, and LINK could be
exploding towards 0.0006875 or even 0.0009. In summary, Chainlink’s
technical posture is one of cautious optimism, with a clear upward
trend since November but facing immediate resistance near the
$14.70 level. Market participants should watch these technical
indicators closely for signs of either a continuation of the
uptrend or a potential reversal if support levels falter. Featured
image created with DALL·E, chart from TradingView.com
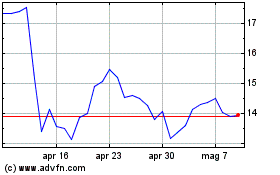
Grafico Azioni ChainLink Token (COIN:LINKUSD)
Storico
Da Dic 2024 a Gen 2025

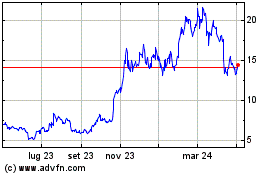
Grafico Azioni ChainLink Token (COIN:LINKUSD)
Storico
Da Gen 2024 a Gen 2025
