Bitcoin Crashes To $65,000, Expert Unpacks Drivers Of Crypto Market Bloodbath
15 Giugno 2024 - 6:00AM
NEWSBTC
The cryptocurrency market has been experiencing a significant
downturn, with Bitcoin leading the way by retracing to the $65,000
mark after failing to retest its all-time high of $73,700 reached
in March. Market expert Michael van de Poppe has shed light
on the reasons behind this ongoing bloodbath, highlighting several
key factors that have contributed to the current state of the
market. Crypto Market Battles Uncertainties A key event highlighted
by van de Poppe is last Wednesday’s release of the Consumer Price
Index (CPI) data, which has a major impact on the Federal Reserve’s
decision on interest rates. The data, which came in lower
than expected, favored risk assets. A lower-than-expected headline
CPI of 3.3% (vs. 3.4% expected) and core CPI of 3.4% (vs. 3.5%
expected) pointed to potential rate cuts or a positive outlook for
future rate cuts, providing favorable market conditions. Related
Reading: Red Alert For Polkadot (DOT): Double-Digit Drop Sparks
Investor Fears Another significant event was the release of the
Producer Price Index (PPI) data, which provides inflation data from
the producer’s perspective. The data revealed a lower-than-expected
regular PPI score of 2.2% (versus an expected 2.5%) and Core PPI
Y/Y score of 2.3% (versus an expected 2.4%). Additionally,
the monthly data showed negative figures, further favoring risk-on
assets. However, van de Poppe contends that despite these positive
indicators, the crypto market has continued its downward trend.
According to van de Poppe, the release of consumer sentiment data
on Friday also impacted the market. Consumer sentiment is
considered a market leader and a gauge of market strength or
weakness. The data came in lower than expected, with a score of
65.6 (versus an expected 72.1). This data signaled a lack of
economic strength, potentially fueling bullish sentiments for
risk-on assets and a shift toward crypto-native markets.
However, Federal Reserve Chairman Jerome Powell delivered an
unexpectedly hawkish speech. Despite data pointing towards the need
for rate cuts and worsening economic conditions, Powell maintained
a hawkish tone and revised the potential rate cuts in 2024.
According to Michael van de Poppe, this outlook did not bode well
for the markets, adding to existing uncertainties and the notorious
price volatility seen in recent days. Bitcoin Price’s Struggle
Continues As Bond Yields Drop The analyst further pointed out that
Market indicators, such as Treasury Bond Yields, declined. The
2-year Treasury Bond Yield dropped to the lowest point in two
months, while the 10-year Yield continued its fall to the lowest
point since the beginning of April. These indicators
typically suggest favorable conditions for Bitcoin and risk-on
assets, implying a higher probability of a potential rate cut.
However, the strength of the US Dollar persisted due to the rate
cut by the European Central Bank (ECB). Van de poppe believes
that this unexpected Dollar strength, driven by the ECB’s actions,
further complicated the market dynamics, as rate cuts are usually
necessary for economic stability. Related Reading: NEAR Protocol:
From Recent Dip To Google Search Darling – Is $16 Next? In sum, the
cryptocurrency market, particularly Bitcoin, has substantially
declined as it struggles to regain its previous highs. Despite
positive economic data pointing towards potential rate cuts and
market indicators favoring risk-on assets, the market has failed to
respond positively. The ongoing uncertainties surrounding
events, such as the listing of the Ethereum ETF, have contributed
to the market’s weakness. With rate cuts on the horizon and the
Dollar’s strength persisting, the upcoming weeks will likely be
critical in determining the market’s direction. When writing,
Bitcoin was trading at $65,280, down by 2% in the past 24 hours and
over 5% in the past seven days. Featured image from DALL-E,
chart from TradingView.com
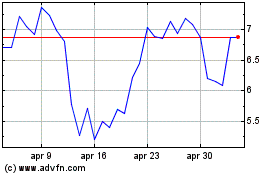
Grafico Azioni NEAR Protocol (COIN:NEARUSD)
Storico
Da Nov 2024 a Dic 2024

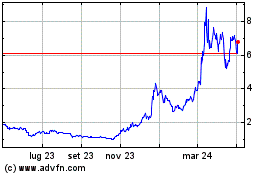
Grafico Azioni NEAR Protocol (COIN:NEARUSD)
Storico
Da Dic 2023 a Dic 2024
