U.S. Dollar Weakens Despite Hot PPI Data
12 Luglio 2024 - 2:22PM
RTTF2
The U.S. dollar declined against its major counterparts in the
New York session on Friday, despite data showing a
higher-than-expected increase in producer prices in June.
The Labor Department said its producer price index for final
demand rose by 0.2 percent in June following a revised unchanged
reading in May.
Economists had expected producer prices to inch up by 0.1
percent compared to the 0.2 percent dip originally reported for the
previous month.
The report also said the annual rate of producer price growth
accelerated to 2.6 percent in June from an upwardly revised 2.4
percent in May.
The annual rate of producer price growth was expected to creep
up to 2.3 percent from the 2.2 percent originally reported for the
previous month.
Thursday's lower-than-expected CPI reading intensified
expectations for a rate cut as early as September.
San Francisco Fed president Mary Daly on Thursday said she
expects further easing in both price pressures and the labor
market, and therefore some policy adjustment will be warranted.
Chicago Fed President Austan Goolsbee described the latest
inflation data as "excellent," adding the reports prove that the
central bank is on track to meet its 2 percent target.
The greenback fell to more than a 3-week low of 157.35 against
the yen, more than 5-week low of 1.0910 against the euro and near a
1-year low of 1.2988 against the pound, off its early highs of
159.44, 1.0861 and 1.2901, respectively. The greenback is seen
finding support around 147.00 against the yen, 1.10 against the
euro and 1.31 against the pound.
The greenback dropped to 0.6792 against the aussie and 0.6124
against the kiwi, from an early high of 0.6753 and a 2-day high of
0.6076, respectively. The greenback is likely to challenge support
around 0.69 against the aussie and 0.63 against the kiwi.
The greenback eased against the loonie and was trading at
1.3617. The currency is poised to challenge support around the 1.33
level.
Against the franc, the greenback reached as low as 0.8932. If
the greenback falls further, it is likely to test support around
the 0.88 region.
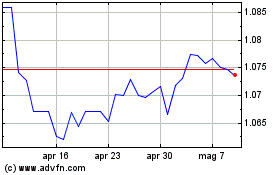
Grafico Cross Euro vs US Dollar (FX:EURUSD)
Da Dic 2024 a Gen 2025

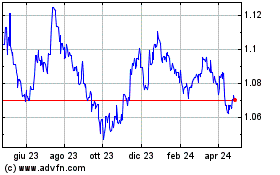
Grafico Cross Euro vs US Dollar (FX:EURUSD)
Da Gen 2024 a Gen 2025
