U.S. Dollar Slumps Amid Lingering Worries About Trump Tariffs
27 Novembre 2024 - 5:25PM
RTTF2
Following the rebound seen during trading on Tuesday, the value
of the U.S. dollar is extending Monday's slump during trading on
Wednesday.
The U.S. dollar index has slid 0.94 points or 0.9 percent to
106.07, pulling back well off last Friday's two-year highs.
The greenback has shown a significant move to the downside
versus the Japanese yen, tumbling to 151.11 compared to the 153.08
yen it fetched at the close of New York trading on Tuesday. Against
the euro, the dollar is trading at $1.0565 compared to yesterday's
$1.0489.
The weakness in the value of the dollar comes amid lingering
concerns about President-elect Donald Trump's to impose increased
sanctions on Mexico, Canada and China and the possibility about a
wider trade war.
Traders were also reacting to the Commerce Department's closely
watched consumer price inflation data that matched
expectations.
The Commerce Department said its personal consumption
expenditures (PCE) price index rose by 0.2 percent in October,
matching the uptick seen in September as well as economist
estimates.
The annual rate of growth by the PCE price index accelerated to
2.3 percent in October from 2.1 percent in September, which was
also in line with expectations.
Excluding food and energy prices, the core PCE price index
climbed by 0.3 percent in October, matching the increase seen in
September as well as economist estimates.
The annual rate of growth by the core PCE price index crept up
to 2.8 percent in October from 2.7 percent in September, which was
also in line with expectations.
"Whilst the CME Fedwatch tool suggests markets still broadly
expect a further rate cut from the Federal Reserve next month,
there is a concern that the pace of cuts is likely to slow as
central bankers respond to the sticky nature of prices in core
areas as well as fears about how Trump's tariffs might impact the
U.S. consumer," said AJ Bell head of financial analysis Danni
Hewson.
The inflation readings, which are preferred by the Federal
Reserve, largely overshadowed a slew of other U.S. economic
data.
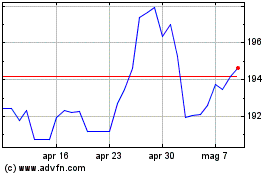
Grafico Cross Sterling vs Yen (FX:GBPJPY)
Da Dic 2024 a Gen 2025

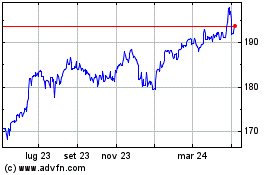
Grafico Cross Sterling vs Yen (FX:GBPJPY)
Da Gen 2024 a Gen 2025
