Hardide PLC Interim Results -2-
28 Maggio 2014 - 8:01AM
UK Regulatory
For the period ended 31 March 2014
 GBP 000                                 6 months to        Year to       6 months to      6 months
                                                                                              to
                                         31 March 2014    30 September    30 September     31 March
                                                              2013            2013            2013
                                                           (audited)      (unaudited)     (unaudited)
                                          (unaudited)

 Total Equity at start of
  period                                     617             1,123           1,355          1,123
-------------------------------------  ---------------  --------------  --------------  -------------

 Loss for the period                        (236)            (848)           (746)          (102)

 Issue of new shares                         199              304              -             304

 Exchange differences on translation
  of foreign operation                        8                3              (7)             10

 Share options                                13              35              15              20

 Total Equity at end of period               601              617             617           1,355
-------------------------------------  ---------------  --------------  --------------  -------------
Consolidated Statement of Financial Position
As at 31 March 2014
 GBP 000                                31 March 2014   30 September     31 March
                                                            2013           2013
                                                          (audited)     (unaudited)
                                          (unaudited)

 Assets

 Non-current assets
                     Investments              -              -              -
                             Goodwill        69              69             69
                    Intangible assets         2              2              2
          Property, plant & equipment        290            245            374
-------------------------------------  --------------  -------------  -------------
 Total non-current assets                    361            316            445
-------------------------------------  --------------  -------------  -------------

 Current assets
                          Inventories        32              41             35
          Trade and other receivables        474            434            363
       Other current financial assets        96             154             89
            Cash and cash equivalents        944           1,037          1,389
-------------------------------------  --------------  -------------  -------------
 Total current assets                       1,546          1,666          1,876
-------------------------------------  --------------  -------------  -------------

 Total assets                               1,907          1,982          2,321
-------------------------------------  --------------  -------------  -------------

 Liabilities

 Current liabilities
             Trade and other payables        386            282            276
                Financial liabilities        504            702             -
       Provision for lease obligation        84              86             -
-------------------------------------  --------------  -------------  -------------
 Total current liabilities                   974           1,070           276
-------------------------------------  --------------  -------------  -------------

 Net current assets                          572            596           1,600
-------------------------------------  --------------  -------------  -------------

 Non-current liabilities
                Financial liabilities        50              5             690
       Provision for lease obligation        282            290             -
-------------------------------------  --------------  -------------  -------------
 Total non-current liabilities               332            295            690
-------------------------------------  --------------  -------------  -------------

 Total liabilities                          1,306          1,365           966
-------------------------------------  --------------  -------------  -------------

 Net assets                                  601            617           1,355
-------------------------------------  --------------  -------------  -------------

 Equity attributable to equity
  holders of the parent
                        Share capital       2,777          2,733          2,733
                        Share premium       6,240          6,085          6,085
                    Retained earnings      (8,077)        (7,841)        (7,095)
          Share-based payment reserve        288            275            260
                  Translation reserve       (627)          (635)          (628)
-------------------------------------  --------------  -------------  -------------
 Total equity                                601            617           1,355
-------------------------------------  --------------  -------------  -------------
Consolidated Statement of Cash Flows
For the period ended 31 March 2014
 GBP 000                               6 months to        Year to       6 months to      6 months
                                                                                            to
                                       31 March 2014    30 September    30 September     31 March
                                                            2013            2013            2013
                                                         (audited)      (unaudited)     (unaudited)
                                        (unaudited)

 Cash flows from operating
  activities
                     Operating loss       (192)            (801)           (755)           (46)
          Impairment of intangibles         0                0               0              0
                       Depreciation         59              110             53              57
         Impairment of fixed assets         -               90              90              -
                Share option charge         13              35              15              20
           (Increase) / decrease in
                        inventories         9               (8)             (6)            (2)
           (Increase) / decrease in
                        receivables        (28)             114            (81)            195
           Increase / (decrease) in
                           payables        104             (198)             6            (204)
             Increase in provisions         -               376             376             -

 Cash generated from operations            (35)            (282)           (302)            20
-----------------------------------  ---------------  --------------  --------------  -------------

                     Finance income         4                2               1              1
                      Finance costs        (27)            (61)            (30)            (31)
              Tax received / (paid)         42               -               -              -

 Net cash generated from operating
  activities                               (16)            (341)           (331)           (10)
-----------------------------------  ---------------  --------------  --------------  -------------

 Cash flows from investing
  activities
       Purchase of property, plant,
                          equipment       (104)            (69)            (21)            (48)

 Net cash used in investing
  activities                              (104)            (69)            (21)            (48)
-----------------------------------  ---------------  --------------  --------------  -------------

 Cash flows from financing
  activities
         Net proceeds from issue of
             ordinary share capital        200              304              -             304
                       Loans repaid       (232)            (262)             -            (262)
            Finance lease inception         65               -               -              -
            Finance lease repayment        (6)               -               -              -

 Net cash used in financing
  activities                                27              42               -              42
-----------------------------------  ---------------  --------------  --------------  -------------

 Net increase / (decrease)
  in cash and cash equivalents             (93)            (368)           (352)           (16)
-----------------------------------  ---------------  --------------  --------------  -------------

 Cash and cash equivalents
  at the beginning of the period          1,037            1,405           1,389          1,405
-----------------------------------  ---------------  --------------  --------------  -------------

 Cash and cash equivalents
  at the end of the period                 944             1,037           1,037          1,389
-----------------------------------  ---------------  --------------  --------------  -------------
This information is provided by RNS
The company news service from the London Stock Exchange
END
IR GUGDUCXDBGSI
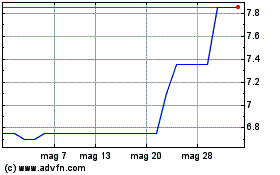
Grafico Azioni Hardide (LSE:HDD)
Storico
Da Giu 2024 a Lug 2024

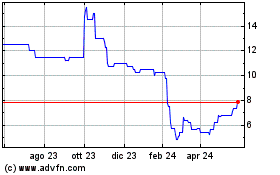
Grafico Azioni Hardide (LSE:HDD)
Storico
Da Lug 2023 a Lug 2024
