These facilities provide the Group with the operational
flexibility it requires in a highly seasonal business on a cost
effective basis. As noted above, interest margins have been falling
as leverage has improved and the Group has been able to renegotiate
favourable terms on the two largest facilities during the year.
There are financial covenants attached to our facilities and the
Group comfortably complied with these throughout the year. These
covenants include:
        *    debt service, being the ratio of cash flow available
             to finance costs on a rolling twelve-month basis;

        *    interest cover, being the ratio of earnings before
             interest, depreciation and amortisation to interest
             on a rolling twelve month basis;

        *    leverage being the ratio of debt to pre-exceptional
             EBITDA on a rolling twelve month basis; and

        *    appropriate local covenants in the individual
             businesses, which have asset backed facilities.
The Group has various interest rate swaps denominated in US
Dollars, Sterling and Euros to improve certainty over interest
charges. The Group adopts hedge accounting for these instruments.
No new interest rate contracts were entered into during the year.
The Group also actively manages FX transaction exposure in each of
its businesses, with advice and support from the central treasury
team.
Note 26 to the financial statements provides further information
in respect of treasury matters.
Post balance sheet event
On 5 June 2014 the Group announced the acquisition of the trade
and certain of the assets of Enper Giftwrap BV, a Dutch company
with sales of EUR5 million, for EUR1.9 million. This transaction is
expected to complete on 30 June 2014. While modest in scale, this
acquisition is an ideal step towards consolidation of the very
competitive European gift wrap marketplace. The Group's Dutch
management team plan to integrate Enper's customer base and
selected fixed assets into its own facilities within three months
of completion. We have allowed for the loss of some less profitable
customers but the synergies that should arise post integration
(2015/16 season) from such an integration into our modern printing
presses, installed in Hoogeveen in 2012, will more than offset this
and the cash payback after all costs of acquisition and integration
should be no more than four years.
This is the Group's first acquisition for some years and it is a
reflection of the our improving balance sheet and trading position
that we are now able to evaluate and execute on such opportunities
- albeit highly selectively. We do not anticipate that this
investment will impact materially on our debt reduction plans.
Conclusion
In conclusion, delivery has been ahead of plan in the year now
completed. Net debt and earnings per share performance was
especially pleasing and outperformance in the arena of cash
management is providing the Group with additional flexibility and
options to create value for shareholders in the future.
Anthony Lawrinson
Director
19 June 2014
Consolidated income statement
year ended 31 March 2014
                                                          Year ended                           Year ended
                                                         31 March 2014                        31 March 2013
                                                   Before  Exceptional                  Before  Exceptional
                                              exceptional        items             exceptional        items
                                                    items    (note 10)      Total        items    (note 10)      Total
                                       Notes       GBP000       GBP000     GBP000       GBP000       GBP000     GBP000
Revenue                                  4        224,462            -    224,462      225,211            -    225,211
Cost of sales                                   (183,238)      (2,006)  (185,244)    (183,941)        (953)  (184,894)
Gross profit                                       41,224      (2,006)     39,218       41,270        (953)     40,317
                                                    18.4%                   17.5%        18.3%                   17.9%
Selling expenses                                 (12,108)            -   (12,108)     (12,790)        (455)   (13,245)
Administration expenses                          (19,191)            -   (19,191)     (18,789)        (195)   (18,984)
Other operating income                   7            737          147        884          803            -        803
Profit on disposal of property, plant
 and equipment                                          -            -          -          252            -        252
Operating profit/(loss)                  5         10,662      (1,859)      8,803       10,746      (1,603)      9,143
Finance expenses                         8        (3,177)        (439)    (3,616)      (3,466)            -    (3,466)
Profit/(loss) before tax                            7,485      (2,298)      5,187        7,280      (1,603)      5,677
Income tax (charge)/credit               9        (1,840)          381    (1,459)      (1,890)          289    (1,601)
Profit/(loss) for the period                        5,645      (1,917)      3,728        5,390      (1,314)      4,076
Attributable to:
Owners of the Parent Company                                                3,010                                3,401
Non-controlling interests                                                     718                                  675


                                                                                   2014             2013
                                                                           -----  -------  ------  -------  ------
                                                                           Notes  Diluted   Basic  Diluted   Basic
-------------------------------------------------------------------------  -----  -------  ------  -------  ------
Adjusted earnings per share excluding exceptional items and LTIP charges   23        8.4p    8.6p     7.8p    7.8p
Loss per share on LTIP charges                                             23      (0.1p)  (0.1p)        -       -
-------------------------------------------------------------------------  -----  -------  ------  -------  ------
Adjusted earnings per share excluding exceptional items                    23        8.3p    8.5p     7.8p    8.1p
Loss per share on exceptional items                                        23      (3.2p)  (3.3p)   (2.0p)  (2.1p)
-------------------------------------------------------------------------  -----  -------  ------  -------  ------
Earnings per share                                                                   5.1p    5.2p     5.8p    6.0p
-------------------------------------------------------------------------  -----  -------  ------  -------  ------
Consolidated statement of comprehensive income
year ended 31 March 2014
                                             2014    2013
                                           GBP000  GBP000
----------------------------------------  -------  ------
Profit for the year                         3,728   4,076
Other comprehensive income:
----------------------------------------  -------  ------
Exchange difference on translation
 of foreign operations                    (2,257)     633
Transfer to profit and loss of maturing
 cash flow hedges (net of tax)                451     446
Net loss on cash flow hedges (net
 of tax)                                    (577)   (451)
----------------------------------------  -------  ------
Other comprehensive income for period,
 net of tax items
which may be reclassified in to profit
 and loss in subsequent periods           (2,383)     628
Total comprehensive income for the
 period, net of tax                         1,345   4,704
Attributable to:
Owners of the Parent Company                1,366   3,796
Non-controlling interests                    (21)     908
----------------------------------------  -------  ------
                                            1,345   4,704
----------------------------------------  -------  ------
Consolidated statement of changes in equity
year ended 31 March 2014
                                  Share
                                premium
                            and capital                                                                Non--
                     Share   redemption    Merger   Hedging  Translation  Retained  Shareholder  controlling
                   capital      reserve  reserves  reserves      reserve  earnings       equity     interest     Total
                    GBP000       GBP000    GBP000    GBP000       GBP000    GBP000       GBP000       GBP000    GBP000
At 1 April 2012      2,750        4,480    17,164     (446)          446    23,410       47,804        4,744    52,548
Profit for the
 year                    -            -         -         -            -     3,401        3,401          675     4,076
Other
 comprehensive
 income                  -            -         -       (5)          400         -          395          233       628
Total
 comprehensive
 income for the
 year                    -            -         -       (5)          400     3,401        3,796          908     4,704
Equity-settled
 share-based
 payment (note
 25)                     -            -         -         -            -        22           22            -        22
Options exercised
 (note 22)              88          178         -         -            -         -          266            -       266
Equity dividends
 paid                    -            -         -         -            -         -            -        (968)     (968)
At 31 March 2013     2,838        4,658    17,164     (451)          846    26,833       51,888        4,684    56,572
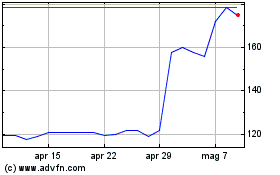
Grafico Azioni Ig Design (LSE:IGR)
Storico
Da Giu 2024 a Lug 2024

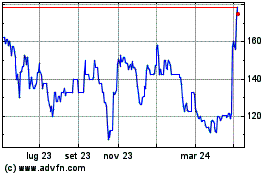
Grafico Azioni Ig Design (LSE:IGR)
Storico
Da Lug 2023 a Lug 2024
