Exhibit 99.1

Investor Presentation Second Quarter 2023 Highlights F&M TRUST Franklin Financial Services Corporation

Forward Looking Statements Certain statements appearing herein which are not historical in nature are forward-looking statements within the meaning of the Private Securities Litigation Reform Act of 1995. Such forward-looking statements refer to a future period or periods, reflecting management’s current views as to likely future developments, and use words such as “may,” “will,” “expect,” “believe,” “estimate,” “anticipate,” or similar terms. Because forward-looking statements involve certain risks, uncertainties and other factors over which the Corporation has no direct control, actual results could differ materially from those contemplated in such statements. These factors include (but are not limited to) the following: general economic conditions, changes in the rates of inflation and the effects of inflation, changes in interest rates, ongoing disruption in the financial services industry caused by the recent failure and continuing uncertainty of various banks, changes in the Corporation’s cost of funds, changes in government monetary policy, changes in government regulation and taxation of financial institutions, changes in technology, the intensification of competition within the Corporation’s market area, and other similar factors. We caution readers not to place undue reliance on these forward-looking statements. They only reflect management’s analysis as of this date. The Corporation does not revise or update these forward-looking statements to reflect events or changed circumstances. F&M TRUST Franklin Financial Services Corporation 2
CEO Comments Successful community banking hinges on building strong customer relationships and continuing to look to the future when management is making decisions. During the second quarter of 2023, Franklin Financial Services Corporation and its wholly-owned bank subsidiary, F&M Trust, realized 6.3% loan growth, a slight increase in deposit balances, and improved non-interest income that came with growth in assets under management in our Investment & Trust division. Because of the strength of our second-quarter performance, we were able to look to the future and take short-term losses now that will have a positive effect on future earnings. Those losses include buying out a long-term lease (a $495,000 negative effect on current earnings) and selling low interest-rate investments (a $517,000 negative effect on earnings that, when reinvested, will have a less than 18-month earn-back). With strong liquidity, a deposit base that is 91.3% insured or collateralized, an allowance for credit loss of 1.28%, negligible credit issues, and a loan-to-deposit ratio of 75%, we are positioned to grow earning assets as we expand in the South Central Pennsylvania and Northern Maryland markets. There will continue to be challenges brought on by the response to the pandemic, which ultimately led to the well-documented rapid rise in interest rates and other market disruptions. We believe that it will take time, perhaps years, before the effects of these historic changes modulate and level set. However, we believe that there are opportunities during this time of disruption, and by adding key people to our team and stepping into the challenges, we will benefit the company and its shareholders in the years to come. While staying true to our mission, vision, and values, the company continues to evolve and maintain relevance. Part of our evolution is embracing the opportunities presented by the digital technologies available to us. In order to evolve, we are making investments of time and money that impact today’s “bottom line,” but we believe these investments will improve our future performance to the benefit of both our shareholders and our customers. We thank you for your support and interest in our company. Sincerely, F&M TRUST Franklin Financial Services Corporation 3

Mission, Vision & Core Values Mission Statement Delivering the right financial solutions from people you know and trust. Vision We are committed to remaining independent by growing our bank to meet the increasing needs of our employees, customers, communities, and shareholders. We strive to be a financial services leader in the markets we serve. Core Values The employees, officers, and directors are committed to the core values of integrity, teamwork, excellence, accountability, and concern for our customers and the communities we serve. F&M TRUST Franklin Financial Services Corporation 4
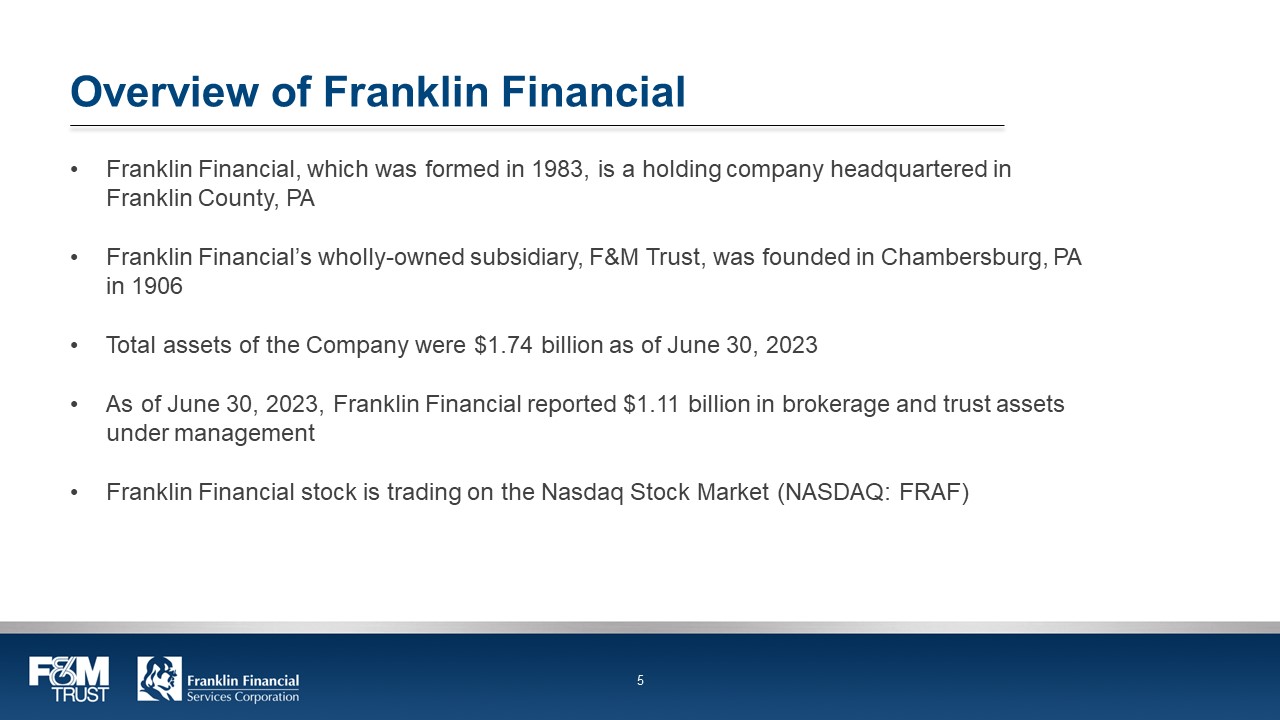
Overview of Franklin Financial Franklin Financial, which was formed in 1983, is a holding company headquartered in Franklin County, PA Franklin Financial’s wholly-owned subsidiary, F&M Trust, was founded in Chambersburg, PA in 1906 Total assets of the Company were $1.74 billion as of June 30, 2023 As of June 30, 2023, Franklin Financial reported $1.11 billion in brokerage and trust assets under management Franklin Financial stock is trading on the Nasdaq Stock Market (NASDAQ: FRAF) F&M TRUST Franklin Financial Services Corporation 5
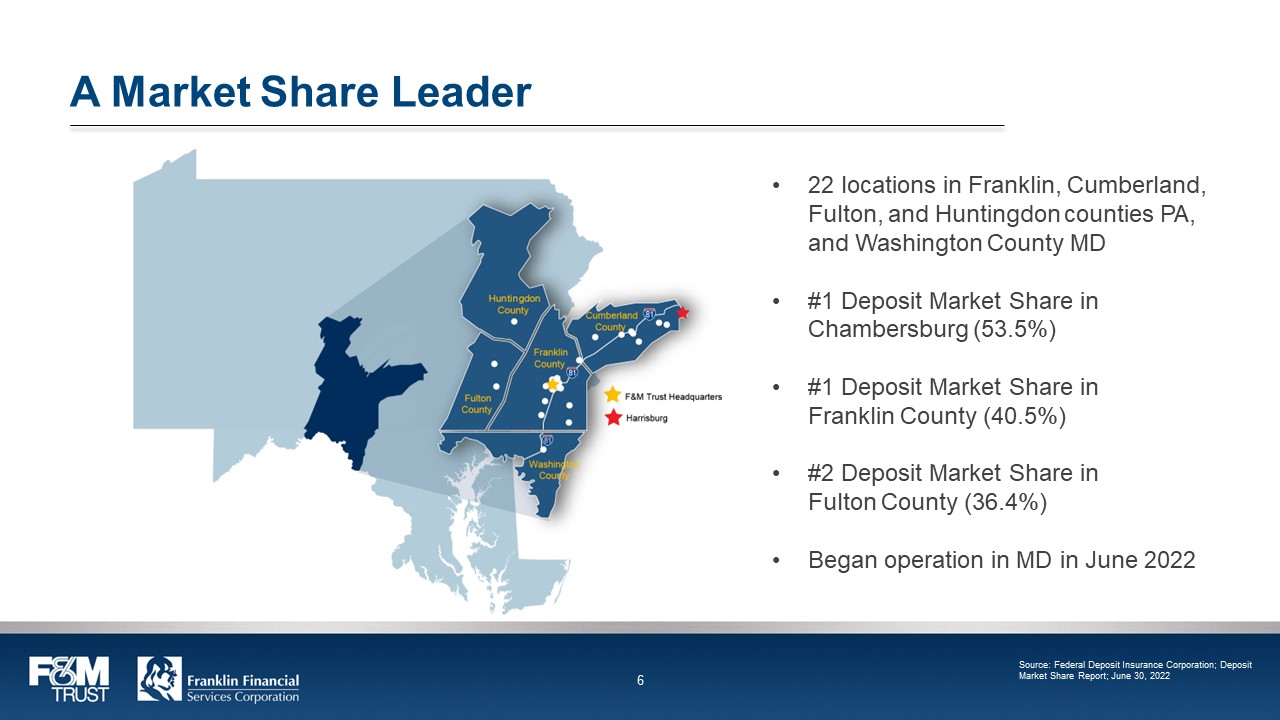
A Market Share Leader Huntington County Fulton County Franklin County Cumberland County Washington County F&M Trust Headquarters Harrisburg 22 locations in Franklin, Cumberland, Fulton, and Huntingdon counties PA, and Washington County MD #1 Deposit Market Share in Chambersburg (53.5%) #1 Deposit Market Share in Franklin County (40.5%) #2 Deposit Market Share in Fulton County (36.4%) Began operation in MD in June 2022 Source: Federal Deposit Insurance Corporation; Deposit Market Share Report; June 30, 2022 F&M TRUST Franklin Financial Services Corporation 6
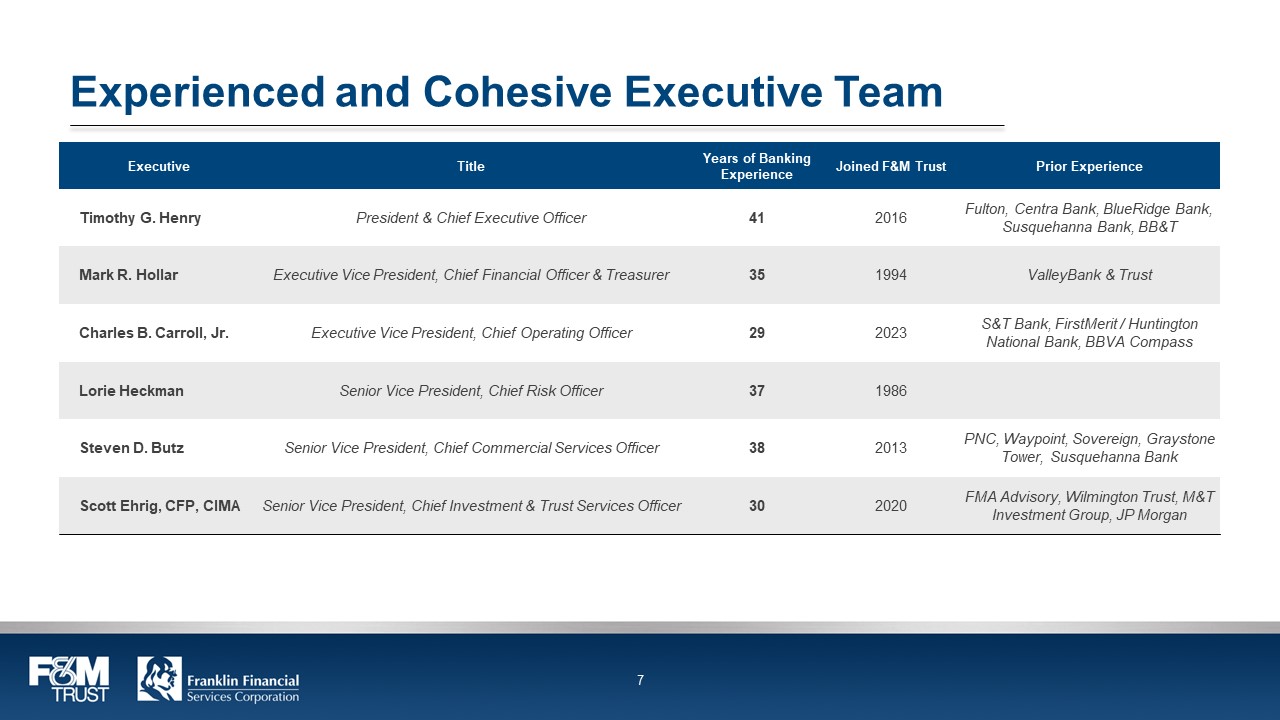
Experienced and Cohesive Executive Team Executive Title Years of Banking Experience Joined F&M Trust Prior Experience Timothy G. Henry President & Chief Executive Officer 41 2016 Fulton, Centra Bank, BlueRidge Bank, Susquehanna Bank, BB&T Mark R. Hollar Executive Vice President, Chief Financial Officer & Treasurer 35 1994 ValleyBank & Trust Charles B. Carroll, Jr. Executive Vice President, Chief Operating Officer 29 2023 S&T Bank, FirstMerit / Huntington National Bank, BBVA Compass Lorie Heckman Senior Vice President, Chief Risk Officer 37 1986 Steven D. Butz Senior Vice President, Chief Commercial Services Officer 38 2013 PNC, Waypoint, Sovereign, Graystone Tower, Susquehanna Bank Scott Ehrig, CFP, CIMA Senior Vice President, Chief Investment & Trust Services Officer 30 2020 FMA Advisory, Wilmington Trust, M&T Investment Group, JP Morgan F&M TRUST Franklin Financial Services Corporation 7
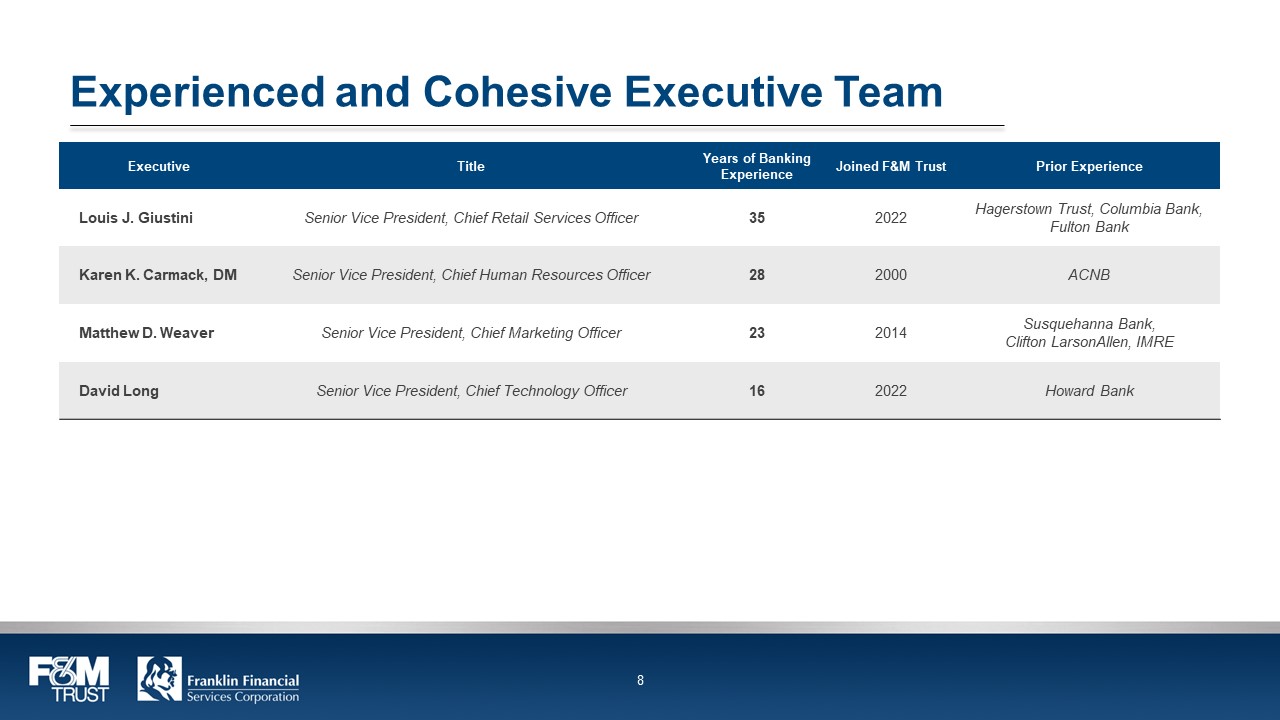
Experienced and Cohesive Executive Team Executive Title Years of Banking Experience Joined F&M Trust Prior Experience Louis J. Giustini Senior Vice President, Chief Retail Services Officer 35 2022 Hagerstown Trust, Columbia Bank, Fulton Bank Karen K. Carmack, DM Senior Vice President, Chief Human Resources Officer 28 2000 ACNB Matthew D. Weaver Senior Vice President, Chief Marketing Officer 23 2014 Susquehanna Bank, Clifton LarsonAllen, IMRE David Long Senior Vice President, Chief Technology Officer 16 2022 Howard Bank F&M TRUST Franklin Financial Services Corporation 8
Well-Established Company Market share leader in core deposit, loan, and asset-management segments in economically stable and historically growing markets Recently hired executive team members with extensive banking industry experience and market knowledge, adding to an experienced management team Consistently strong operating fundamentals with a diverse revenue mix Strong regulatory capital position, sound risk management, and neutral to slightly asset-sensitive balance sheet positioned to benefit from rising interest rates Historically stable core deposit base, which becomes more valuable in a rising rate environment A well-diversified loan portfolio with an emphasis on commercial relationships without reliance on participation loans Accelerating digital transformation and technology adoption to support business growth and service F&M TRUST Franklin Financial Services Corporation 9

Second Quarter 2023 Financial Updates Loan portfolio grew by 6.3%, primarily in Commercial Services division Net interest income for the second quarter of 2023 was $13.2 million compared to $12.8 million for the first quarter of 2023 Deposits increased slightly from the first quarter of 2023 Loan-to-deposit ratio increased to 75% Continue to adjust deposit rates in response to market conditions Net interest margin was 3.30% for the second quarter of 2023 compared to 3.41% for the first quarter of 2023 due to repricing segments of the deposit base Provision for credit loss was $524 thousand for the second quarter of 2023 compared to $529 thousand for the first quarter of 2023 F&M TRUST Franklin Financial Services Corporation 10
Second Quarter 2023 Financial Updates Fee income from new mortgages originated for sale in the secondary market was down slightly from the first quarter of 2023 and down $245 thousand compared to the second quarter of 2022 Sold $7.8 million of low-yielding investment securities at a loss of $517 thousand as part of a portfolio restructuring that allows for earn-back of less than 18 months Terminated a long-term real estate lease for $495 thousand for long-term benefit of the company Allowance for credit loss ratio of 1.28%; non-performing asset ratio of 0.01% Capital position remained strong with a total risk-based capital ratio of 16.84% and a leverage ratio of 9.39% Accumulated Other Comprehensive Income loss decreased from $51 million to $48 million year to date Maintained the dividend at $0.32 per share for the third quarter of 2023 F&M TRUST Franklin Financial Services Corporation 11
Digital Transformation Zelle® transactions increased 21.50% from the second quarter of 2022 to the second quarter of 2023, compared to transactions on the bank-owned Zelle® network rising 26.00% in 20221, as customers continue to transition to digital banking channels Treasury services improved digital solutions to help business customers streamline payment and collection processes, manage liquidity, and prevent fraud, resulting in increased fee income and deposits Business online banking customers increased 8.75% from the second quarter of 2022 to the second quarter of 2023 Utilize AI-driven predictive modeling to deliver targeted marketing content through the bank’s online and mobile banking platforms, website, and at the point-of-sale Launched Salesforce in Retail, Commercial and Investment & Trust Services segments of the bank F&M TRUST Franklin Financial Services Corporation 12
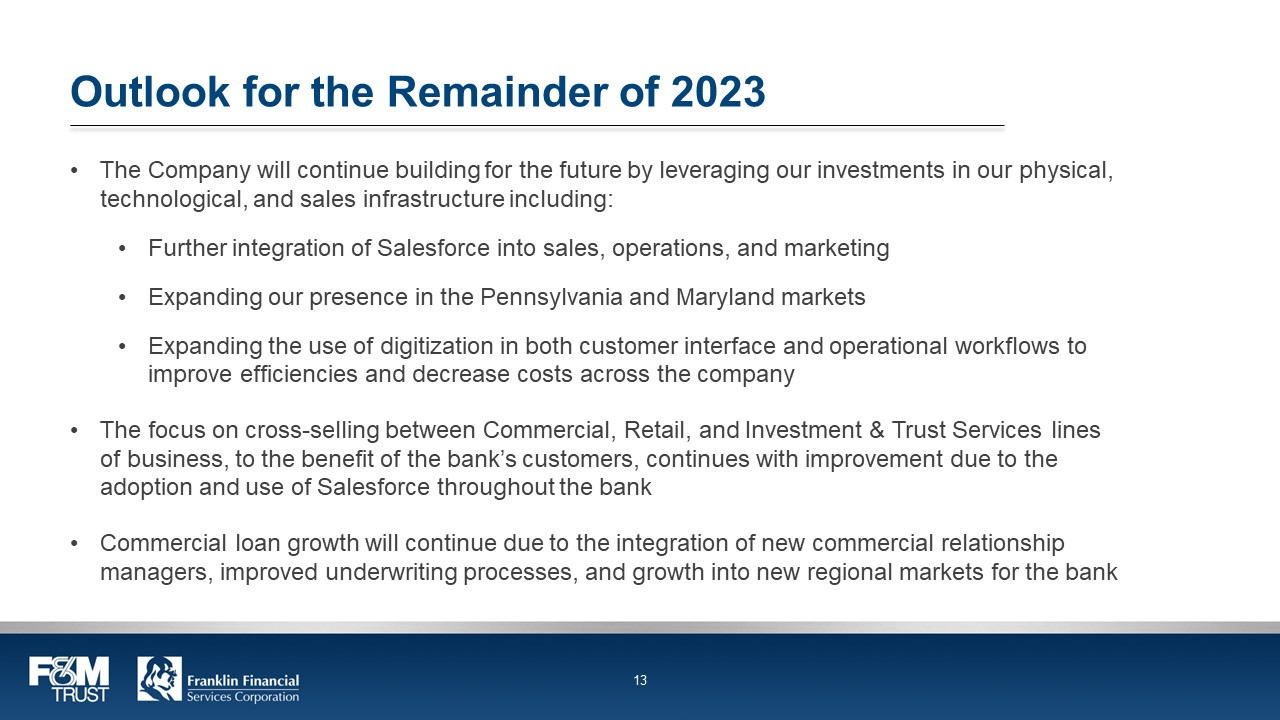
Outlook for the Remainder of 2023 The Company will continue building for the future by leveraging our investments in our physical, technological, and sales infrastructure including: Further integration of Salesforce into sales, operations, and marketing Expanding our presence in the Pennsylvania and Maryland markets Expanding the use of digitization in both customer interface and operational workflows to improve efficiencies and decrease costs across the company The focus on cross-selling between Commercial, Retail, and Investment & Trust Services lines of business, to the benefit of the bank’s customers, continues with improvement due to the adoption and use of Salesforce throughout the bank Commercial loan growth will continue due to the integration of new commercial relationship managers, improved underwriting processes, and growth into new regional markets for the bank F&M TRUST Franklin Financial Services Corporation 13
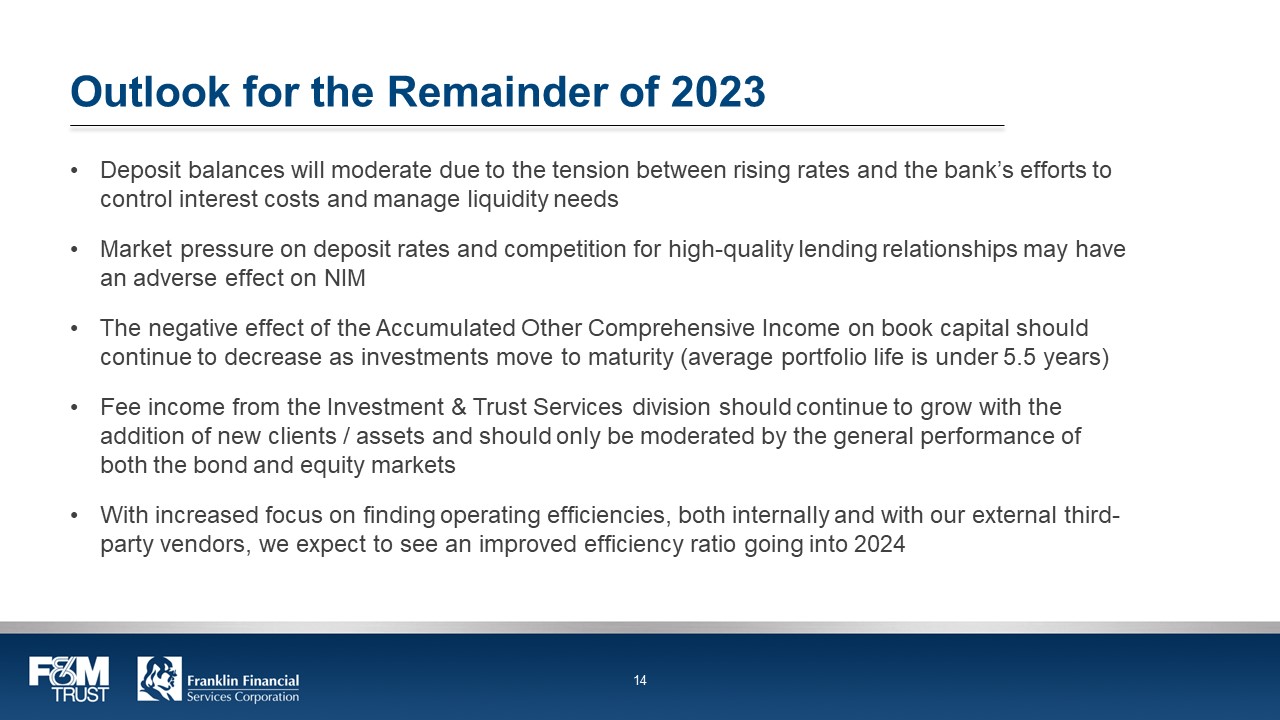
Outlook for the Remainder of 2023 Deposit balances will moderate due to the tension between rising rates and the bank’s efforts to control interest costs and manage liquidity needs Market pressure on deposit rates and competition for high-quality lending relationships may have an adverse effect on NIM The negative effect of the Accumulated Other Comprehensive Income on book capital should continue to decrease as investments move to maturity (average portfolio life is under 5.5 years) Fee income from the Investment & Trust Services division should continue to grow with the addition of new clients / assets and should only be moderated by the general performance of both the bond and equity markets With increased focus on finding operating efficiencies, both internally and with our external third-party vendors, we expect to see an improved efficiency ratio going into 2024 F&M TRUST Franklin Financial Services Corporation 14

Summary The Company continues to be well capitalized and positioned to successfully develop new Commercial and Investment & Trust relationships The bank is positioned to fund growth Asset quality is good, and the Company is well provisioned for losses should they occur in future quarters due to economic factors The Company is actively working to bring more digitally based products and services to its customers The Company is positioning for future growth and expansion following the completed consolidation and move to a new corporate headquarters and operations center, the addition of Salesforce, transitioning of senior leadership, and a new full-service community office in Maryland F&M TRUST Franklin Financial Services Corporation 15
Financial Updates Second Quarter Ended June 30, 2023 F&M TRUST Franklin Financial Services Corporation 16

Balance Sheet Highlights Dollars in Thousands (000’s) 6/30/2023 3/31/2023 12/31/2022 6/30/2022 Total Assets $1,736,165 $1,711,285 $1,699,579 $1,832,296 Cash and Cash Equiv. $64,832 $86,563 $64,899 $198,269 Investments $439,851 $458,154 $487,247 $510,282 Net Loans $1,130,547 $1,063,337 $1,036,866 $1,019,608 Deposits $1,513,135 $1,502,110 $1,551,448 $1,679,187 Shareholders’ Equity $119,770 $123,583 $114,197 $121,797 F&M TRUST Franklin Financial Services Corporation 17
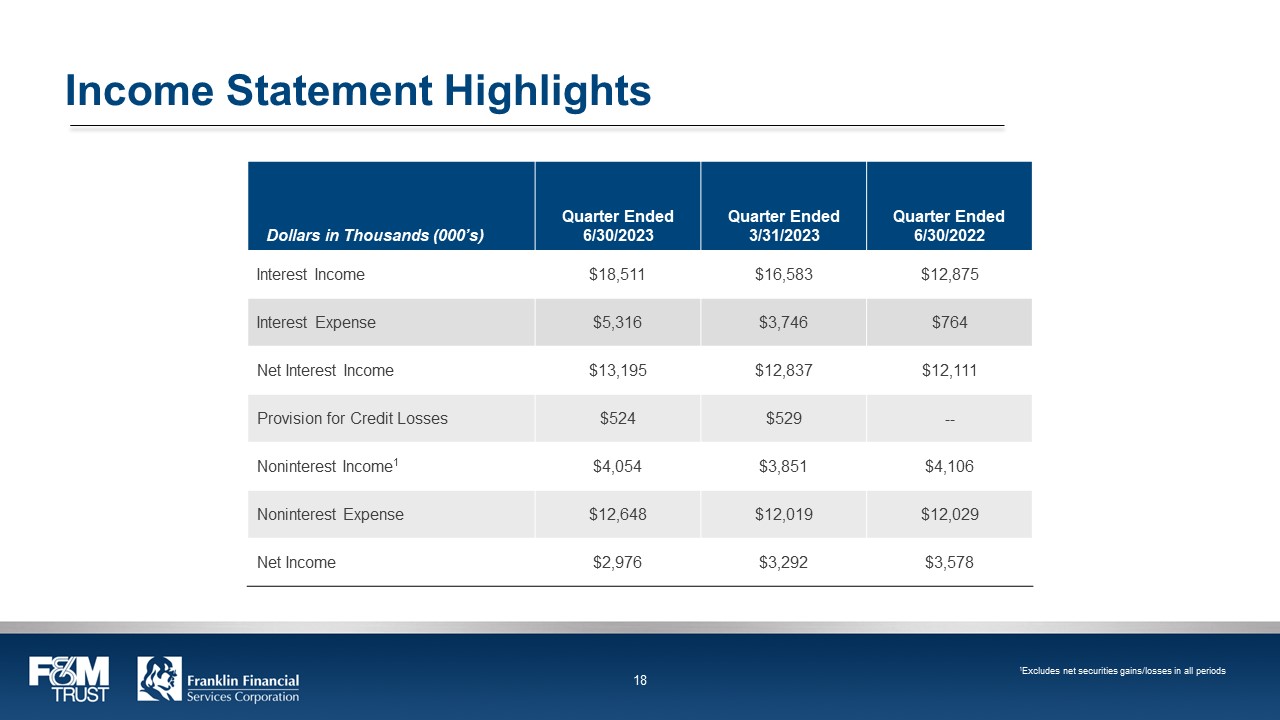
Income Statement Highlights Dollars in Thousands (000’s) Quarter Ended 6/30/2023 Quarter Ended 3/31/2023 Quarter Ended 6/30/2022 Interest Income $18,511 $16,583 $12,875 Interest Expense $5,316 $3,746 $764 Net Interest Income $13,195 $12,837 $12,111 Provision for Credit Losses $524 $529 -- Noninterest Income1 $4,054 $3,851 $4,106 Noninterest Expense $12,648 $12,019 $12,029 Net Income $2,976 $3,292 $3,578 F&M TRUST Franklin Financial Services Corporation 18
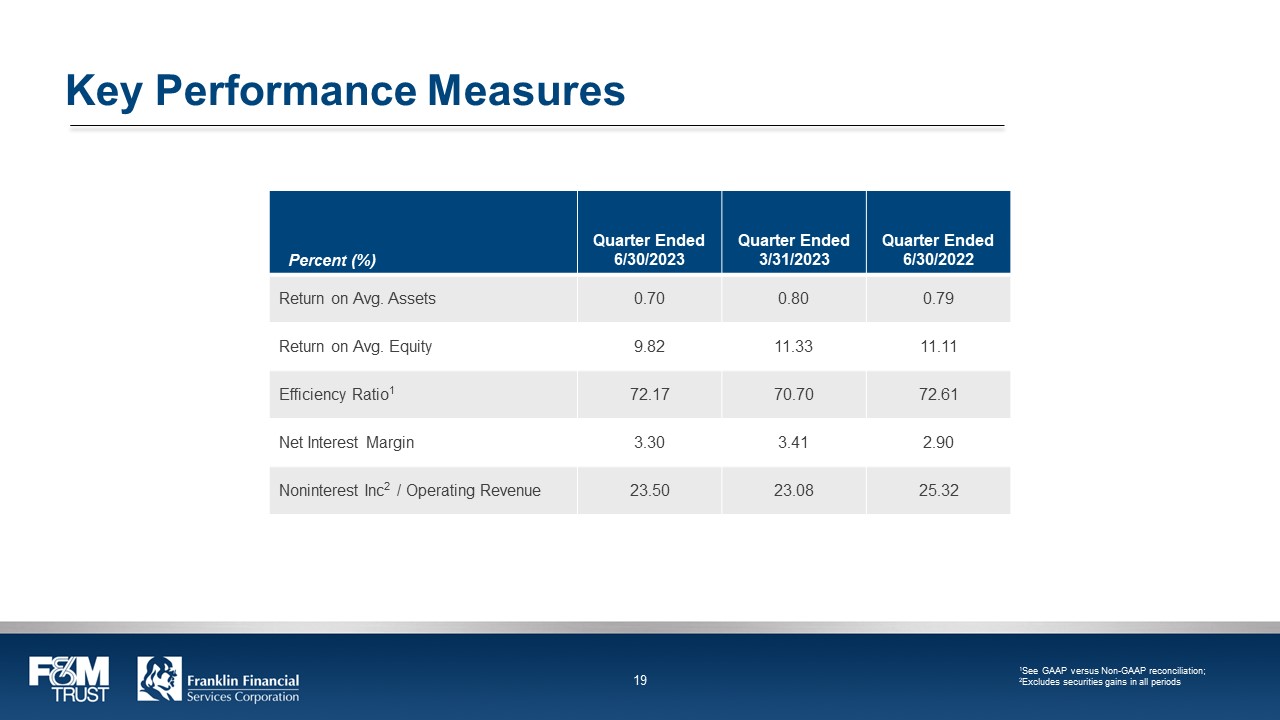
Key Performance Measures Percent (%) Quarter Ended 6/30/2023 Quarter Ended 3/31/2023 Quarter Ended 6/30/2022 Return on Avg. Assets 0.70 0.80 0.79 Return on Avg. Equity 9.82 11.33 11.11 Efficiency Ratio1 72.17 70.70 72.61 Net Interest Margin 3.30 3.41 2.90 Noninterest Inc2 / Operating Revenue 23.50 23.08 25.32 1See GAAP versus Non-GAAP reconciliation; 2Excludes securities gains in all periods F&M TRUST Franklin Financial Services Corporation 19
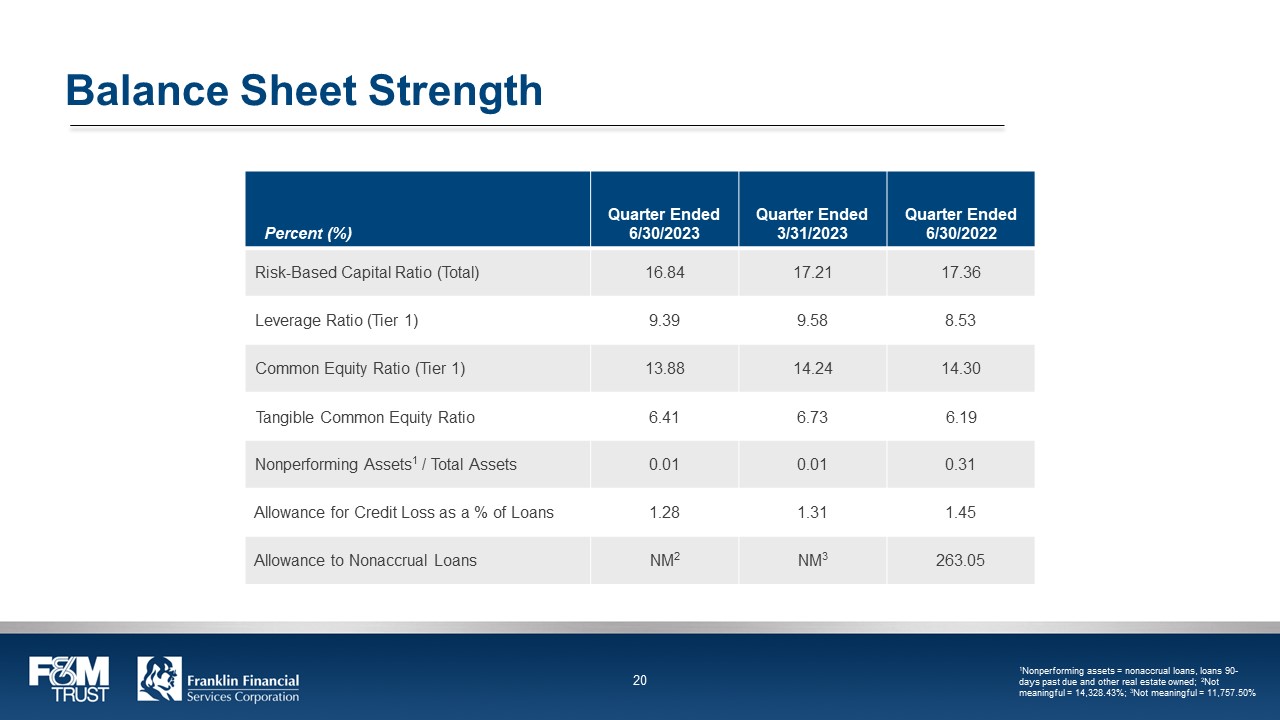
Balance Sheet Strength Percent (%) Quarter Ended 6/30/2023 Quarter Ended 3/31/2023 Quarter Ended 6/30/2022 Risk-Based Capital Ratio (Total) 16.84 17.21 17.36 Leverage Ratio (Tier 1) 9.39 9.58 8.53 Common Equity Ratio (Tier 1) 13.88 14.24 14.30 Tangible Common Equity Ratio 6.41 6.73 6.19 Nonperforming Assets1 / Total Assets 0.01 0.01 0.31 Allowance for Credit Loss as a % of Loans 1.28 1.31 1.45 Allowance to Nonaccrual Loans NM2 NM3 263.05 1Nonperforming assets = nonaccrual loans, loans 90-days past due and other real estate owned; 2Not meaningful = 14,328.43%; 3Not meaningful = 11,757.50% F&M TRUST Franklin Financial Services Corporation 20
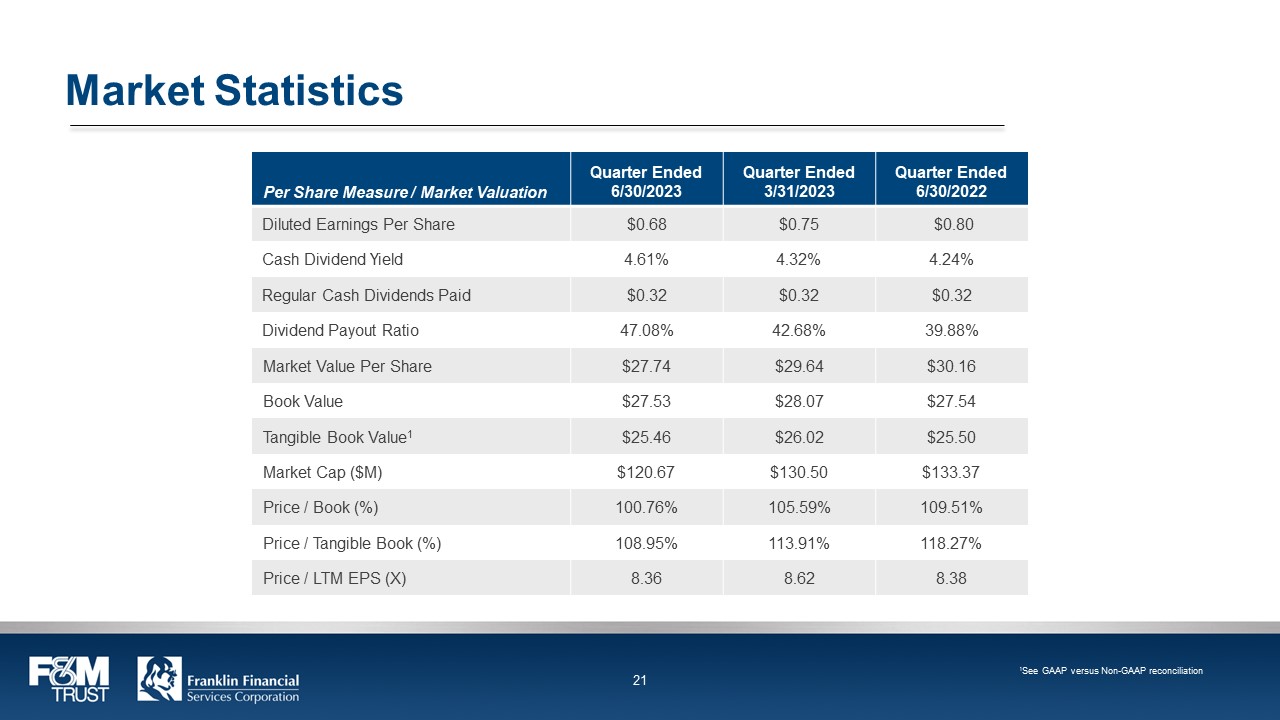
Market Statistics Per Share Measure / Market Valuation Quarter Ended 6/30/2023 Quarter Ended 3/31/2023 Quarter Ended 6/30/2022 Diluted Earnings Per Share $0.68 $0.75 $0.80 Cash Dividend Yield 4.61% 4.32% 4.24% Regular Cash Dividends Paid $0.32 $0.32 $0.32 Dividend Payout Ratio 47.08% 42.68% 39.88% Market Value Per Share $27.74 $29.64 $30.16 Book Value $27.53 $28.07 $27.54 Tangible Book Value1 $25.46 $26.02 $25.50 Market Cap ($M) $120.67 $130.50 $133.37 Price / Book (%) 100.76% 105.59% 109.51% Price / Tangible Book (%) 108.95% 113.91% 118.27% Price / LTM EPS (X) 8.36 8.62 8.38 1See GAAP versus Non-GAAP reconciliation F&M TRUST Franklin Financial Services Corporation 21

Balanced Revenue Model Annualized Noninterest Income Source as a percentage of Average Assets as of June 30, 2023 2023 Franklin Financial Median PA Banks Peer1 Trust 0.40% 0.03% Service Charges on Deposits 0.16% 0.09% Gain on Sale of Loans 0.02% 0.01% Other 0.30% 0.25% Total Noninterest Income2 0.90% 0.48% 1S&P Capital IQ: PA Banks and Holding Companies with assets between $1-3 billion reporting for the last twelve months ended as of March 31, 2023; Source: S&P Global Market Intelligence; 2Excludes net gains/losses on securities F&M TRUST Franklin Financial Services Corporation 22
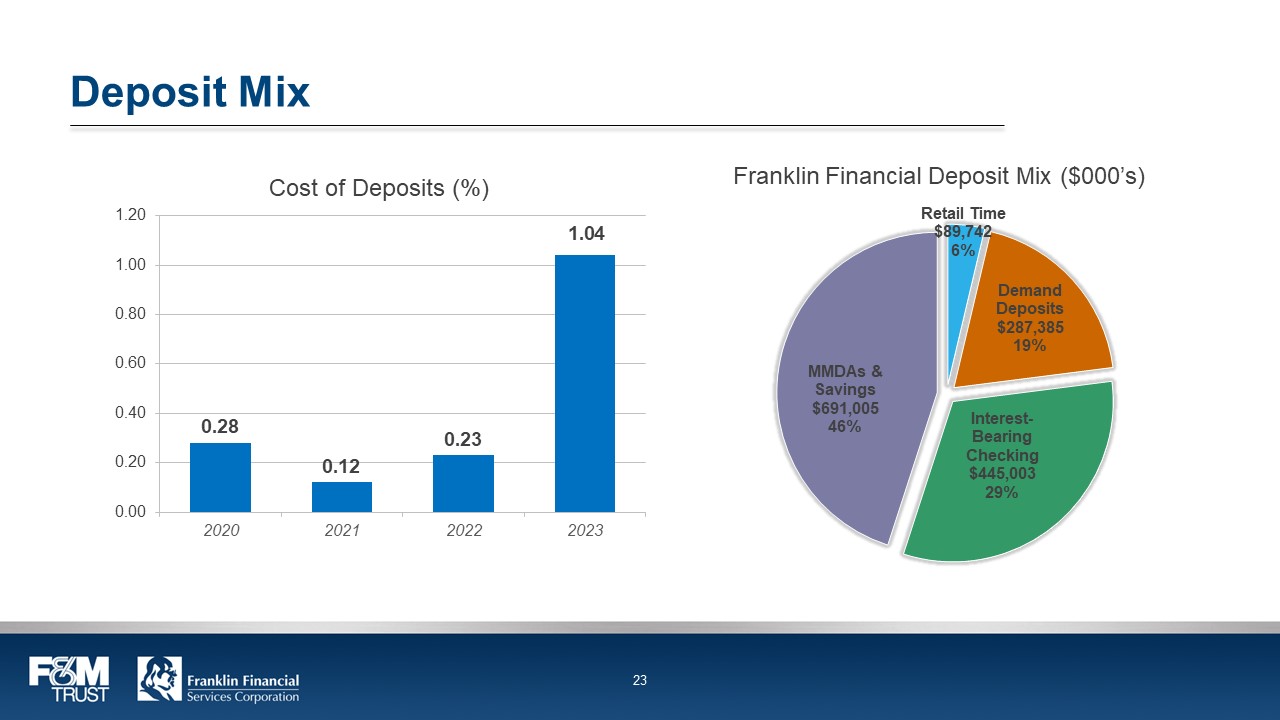
Deposit Mix Cost of Deposits (%) 0.28 0.12 0.23 1.04 2020 2021 2022 2023 Franklin Financial Deposit Mix ($000’s) Retail Time $89,742 6% Demand Deposits $287,385 19% Interest-Bearing Checking $445,003 29% MMDAs & Savings $691,005 46% F&M TRUST Franklin Financial Services Corporation 23
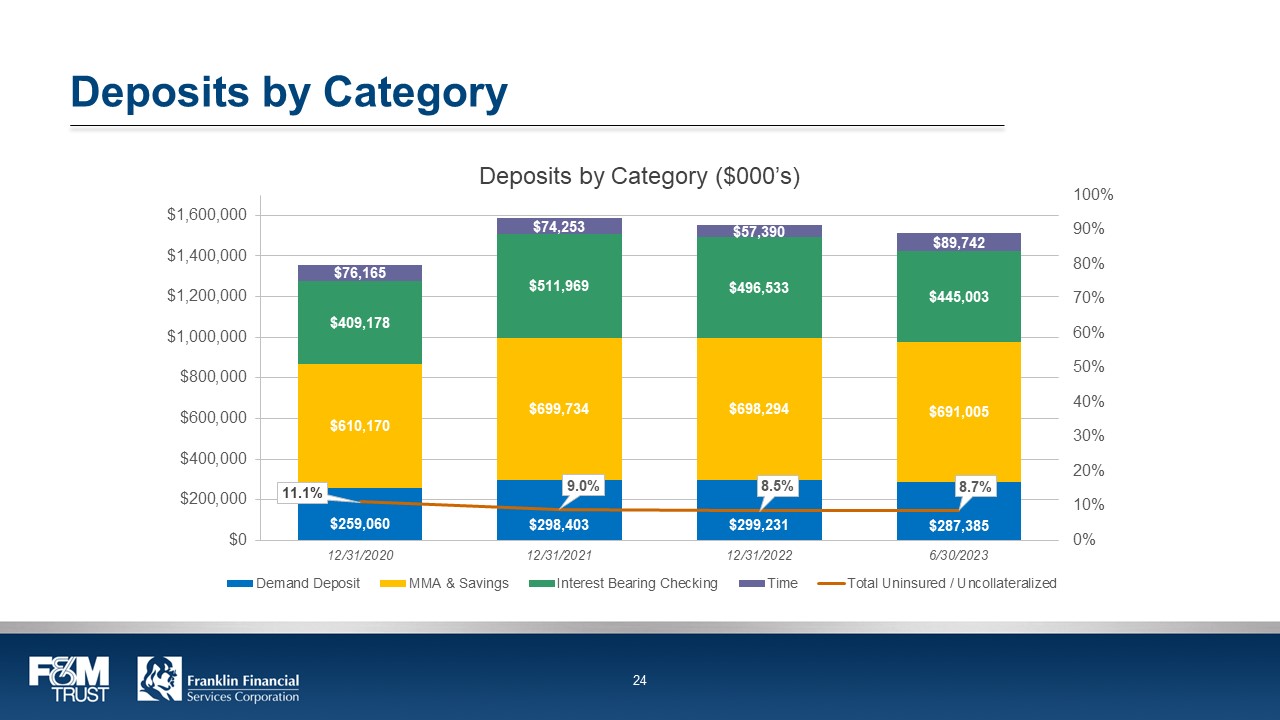
Deposits by Category Deposits by Category ($000’s) $76,165 $74,253 $57,390 $89,742 $409,178 $511,969 $496,533 $445,003 $610,170 $669,734 $698,294 $691,005 11.1% 9.0% 8.5% 8.7% $259,060 $298,403 $299,231 $287,385 12/31/2020 12/31/2021 12/31/2022 6/30/2023 Demand Deposit MMA & Savings Interest Bearing Checking Time Total Uninsured / Uncollateralized F&M TRUST Franklin Financial Services Corporation 24
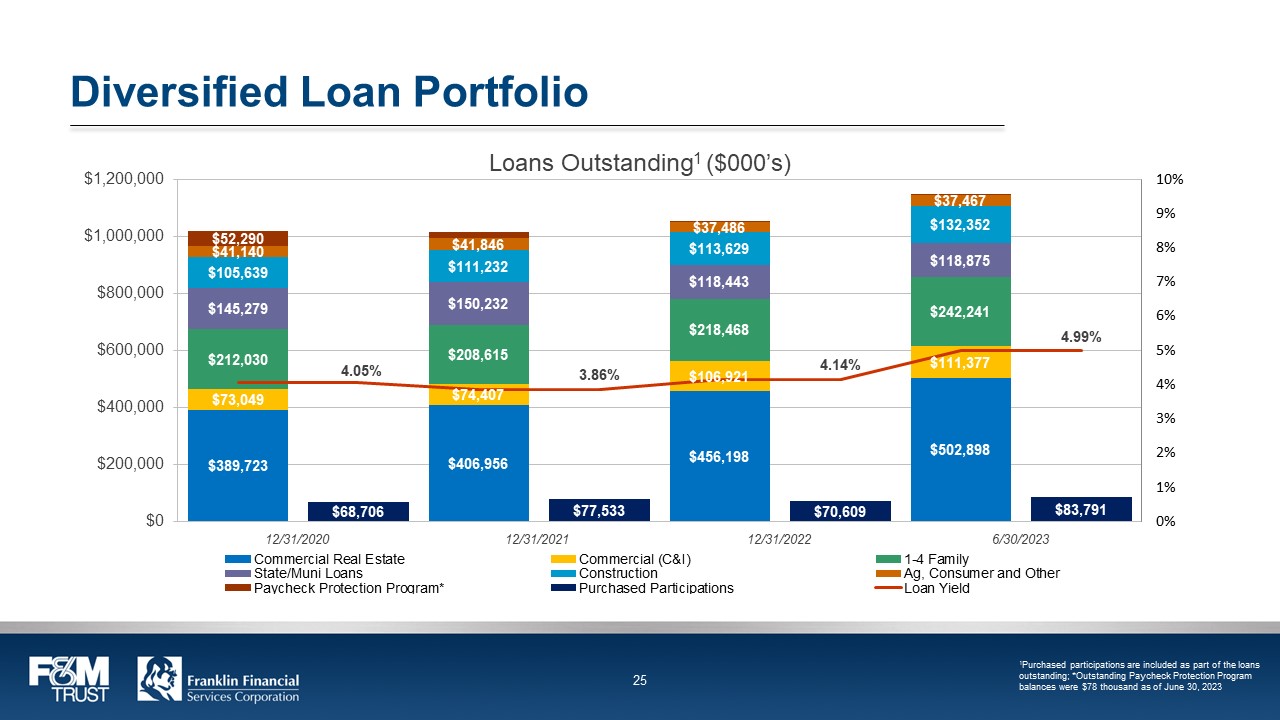
Diversified Loan Portfolio Loans Outstanding1 ($000’s) $52,290 $41,140 $41,846 $37,486 $37,467 $105,639 $111,232 $113,629 $132,352 $145,279 $150,232 $118,443 $118,875 $212,030 4.05% $208,615 3.86% $218,468 4.14% $242,241 4.99% $73,049 $74,407 $106,921 $111,377 $389,723 $68,706 $406,956 $77,533 $456,198 $70,609 $502,898 $83,791 12/31/2020 12/31/2021 12/31/2022 6/30/2023 Commercial Real Estate i State/Muni Loans i Paycheck Protection Program* Commercial (C&l) Construction Purchased Participations 1-4 Family Ag, Consumer and Other Loan Yield 1Purchased participations are included as part of the loans outstanding; *Outstanding Paycheck Protection Program balances were $78 thousand as of June 30, 2023 F&M TRUST Franklin Financial Services Corporation 25
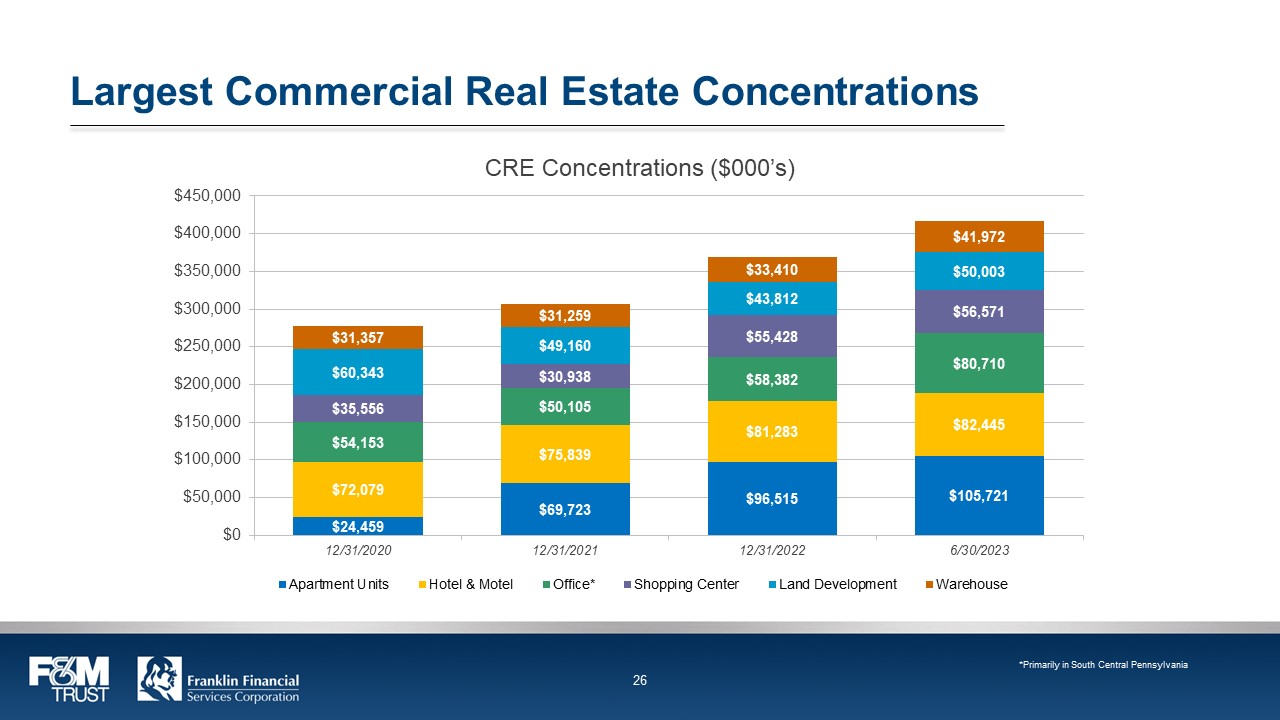
Largest Commercial Real Estate Concentrations $31,357 $31,259 $33,410 $41,972 $60,343 $46,160 $43,812 $50,003 $35,556 $30,938 $55,428 $56,571 $54,154 $50,105 $58,382 $80,710 $72,079 $75,839 $81,283 $82,445 $24,459 $69,723 $96,515 $105,721 12/31/2020 12/31/2021 12/31/2022 6/30/2023 Apartment Units Hotel & Motel Office* Shopping Center Land Development Warehouse *Primarily in South Central Pennsylvania F&M TRUST Franklin Financial Services Corporation 26
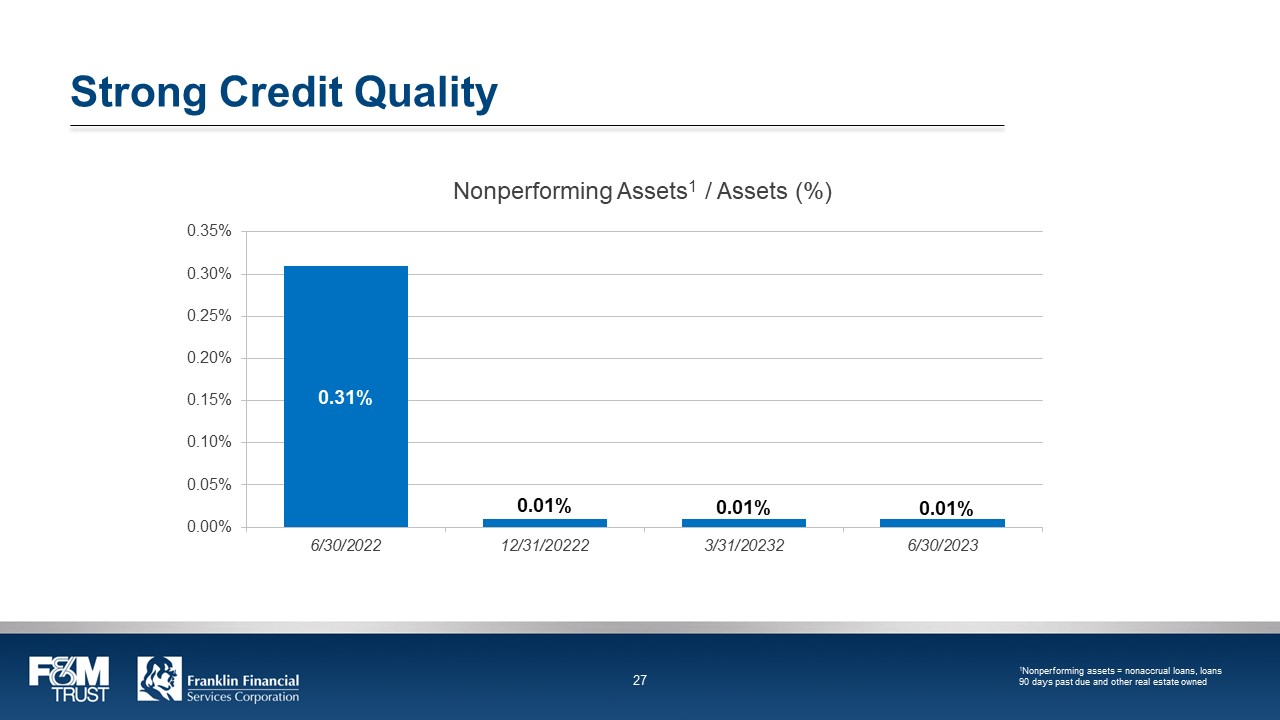
Strong Credit Quality Nonperforming Assets1 / Assets (%) 0.31% 0.01% 0.01% 0.01% 6/30/2022 12/31/2022 3/31/2023 6/30/2023 1Nonperforming assets = nonaccrual loans, loans 90 days past due and other real estate owned F&M TRUST Franklin Financial Services Corporation 27
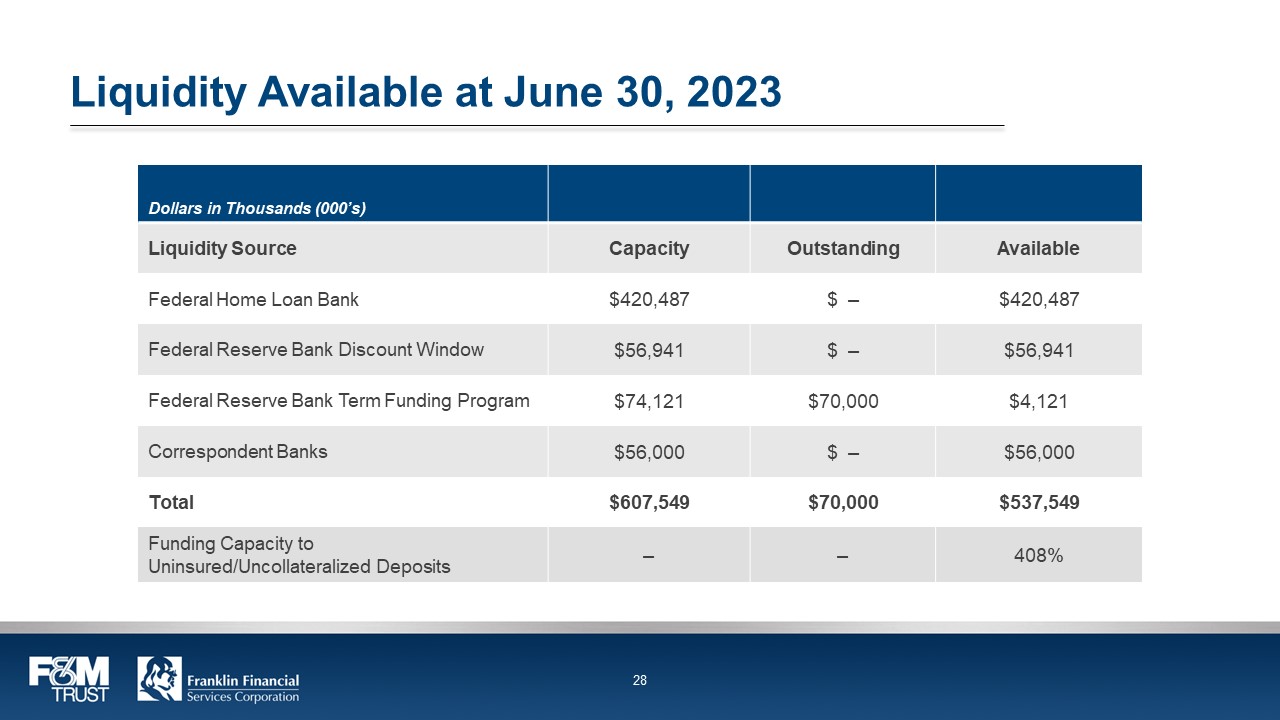
Liquidity Available at June 30, 2023 Dollars in Thousands (000’s) Liquidity Source Capacity Outstanding Available Federal Home Loan Bank $420,487 $ – $420,487 Federal Reserve Bank Discount Window $56,941 $ – $56,941 Federal Reserve Bank Term Funding Program $74,121 $70,000 $4,121 Correspondent Banks $56,000 $ – $56,000 Total $607,549 $70,000 $537,549 Funding Capacity to Uninsured/Uncollateralized Deposits – – 408% F&M TRUST Franklin Financial Services Corporation 28
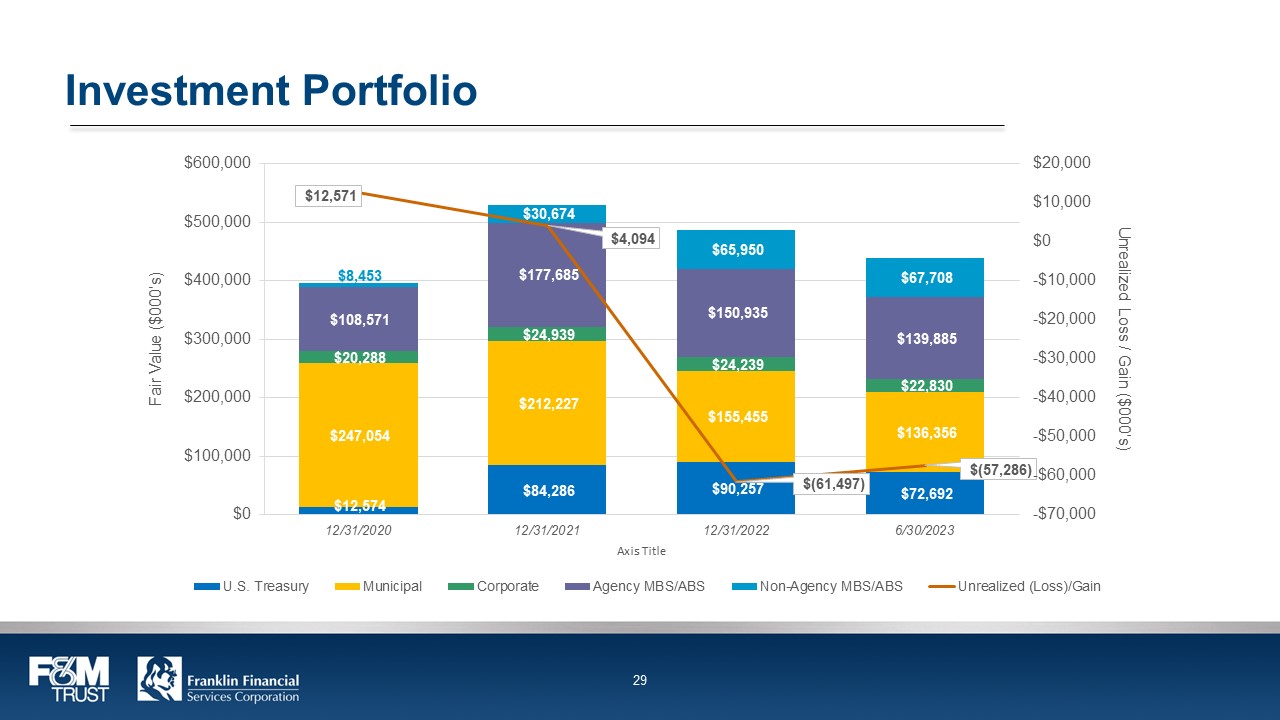
Investment Portfolio $12,571 $4,094 $(61,497) $(57,286) $8,453 $3,074 $65,950 $67,708 $108,571 $177,685 $150,935 $139,885 $20,288 $24,939 $24,239 $22,830 $247,054 $212,227 $155,455 $136,356 $12,574 $84,286 $90,257 $72,692 12/31/2020 12/31/2021 $44,926 $45,107 U S. Treasury Municipal ^Corporate Agency MBS/ABS Non-Agency MBS/ABS Unrealized (Loss)/Gain F&M TRUST Franklin Financial Services Corporation 29

Investment and Trust Services Total and New Assets Under Management ($000’s) $116,398 $904,323 $1,020,722 $147,454 $124,483 $942,476 $1,066,958 $410,002 $127,807 $977,471 $1,105,279 $82,167 December 2022 March 2023 June 2023 Brokerage Trust Total New Assets Under Management (YTD) F&M TRUST Franklin Financial Services Corporation 30
Stock Symbol: FRAF (Nasdaq) www.franklinfin.com www.fmtrust.bank F&M TRUST Franklin Financial Services Corporation 31

Appendix F&M TRUST Franklin Financial Services Corporation 32
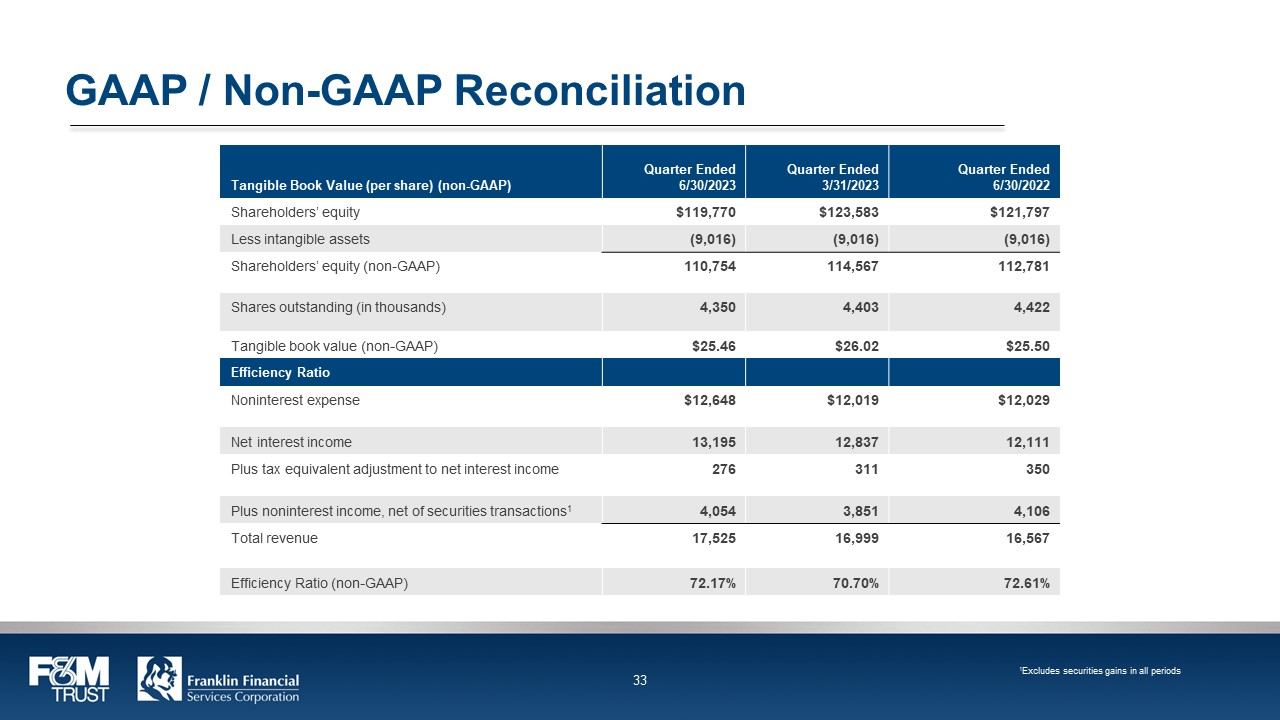
GAAP / Non-GAAP Reconciliation Tangible Book Value (per share) (non-GAAP) Quarter Ended 6/30/2023 Quarter Ended 3/31/2023 Quarter Ended 6/30/2022 Shareholders’ equity $119,770 $123,583 $121,797 Less intangible assets (9,016) (9,016) (9,016) Shareholders’ equity (non-GAAP) 110,754 114,567 112,781 Shares outstanding (in thousands) 4,350 4,403 4,422 Tangible book value (non-GAAP) $25.46 $26.02 $25.50 Efficiency Ratio Noninterest expense $12,648 $12,019 $12,029 Net interest income 13,195 12,837 12,111 Plus tax equivalent adjustment to net interest income 276 311 350 Plus noninterest income, net of securities transactions1 4,054 3,851 4,106 Total revenue 17,525 16,999 16,567 Efficiency Ratio (non-GAAP) 72.17% 70.70% 72.61% 1Excludes securities gains in all periods F&M TRUST Franklin Financial Services Corporation 33